Ivan Basile Kabiena1, Emmanuel Tonye1, Pascal Eloundou Ntsama2
1Department of Electrical and Telecommunication Engineering, National Advanced School of Engineering, Yaounde
2Department of Physics, Ngaoundere University, Ngaoundere
Correspondence to: Ivan Basile Kabiena, Department of Electrical and Telecommunication Engineering, National Advanced School of Engineering, Yaounde.
| Email: |  |
Copyright © 2012 Scientific & Academic Publishing. All Rights Reserved.
Abstract
The triangle inequality can generate it is easier to reduce errors in processing the image into small windows in the processing entirely. The projections are grouped windows in proportion to their intensity and then rebuilt. After each iteration, the projections are returned to their original places to assess the quality of the reconstructed image, the operation will be repeated at the next iteration until convergence of the algorithm. The iterations stop signal is given when the majority of the first rebuilt windows have a constant variance over the iterations. The results are used to assess the quality of the final image, optimize the convergence of the algorithm and provide a wide range of choice to the user in terms of noise suppression.
Keywords:
Tomography, Convergence, Selective Discrimination
Cite this paper: Ivan Basile Kabiena, Emmanuel Tonye, Pascal Eloundou Ntsama, Algebraic Tomographic Reconstruction by Selective Discrimination (ART -DS), American Journal of Signal Processing, Vol. 3 No. 4, 2013, pp. 106-112. doi: 10.5923/j.ajsp.20130304.03.
1. Introduction
To improve the conditions and life expectancy, modern medicine uses a variety of techniques to facilitate the diagnosis of pathologies. Positron emission tomography (PET) is one such technique that uses signal processing methods to rebuild more or less faithfully the internal images of both human and animals[1] (see figure 1 ) organizations. The (PET) is a medical imaging modality that measures the three-dimensional marked by a positron emitter[2] molecule distribution. The acquisition is performed by a set of detectors arranged around the patient.The realization of a PET scan is the result of a series of operations , from production of the isotope, the synthesis of the molecule, the injection of the radioactive tracer , radiation detection , tomographic reconstruction, and finally linking a set of corrections to provide an image representative of the distribution of the tracer within the patient. The sections were reconstructed by algorithms more complex depending on the desired result; the correction of physical phenomena provides a representative picture of the distribution of the tracer[3, 4]. There are two methods of tomographic reconstruction, analytical methods with retro filtered projection and iterative methods that provide a better modelling of the error and that we present in the next sections. In this paper, we try to solve a crucial problem in tomographic and specific to iterative reconstruction methods, namely, the convergence criterion of the algorithm and therefore to quantify the reconstruction error. According to the algorithms used, there may be for a single image, convergence after 10 or 20 iterations, however, it should be noted that the same improvement in the range of only one iteration can be crucial in medical diagnosis.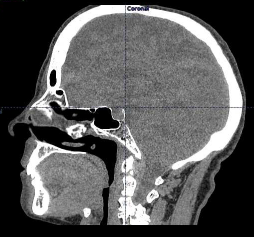 | Figure 1. Tomographic image of a human skull. Source: Data CHU Montpelier |
The proposed method introduces the notion of a window or block reconstruction by introducing a selective discrimination. It is an extension of the method introduced by Alain tweener Hassoun et al [3], which allows reconstructing all projected levels close energies, expected to be a high frequency isolation effect[5]. The reconstruction method uses mathematical concepts that we present in Section 2, however, it should be a reminder of the iterative reconstruction tomography.
2. The Iterative Reconstruction
It is a discrete matrix formulation or (and) the problem of tomographic reconstruction posed by the inverse of the Radon transform[6]. There are direct iterative methods such as ART (Algebraic Reconstruction Technique) or SIRT (Simultaneous Iterative Reconstruction Technique), statistical methods such as MLEM (Maximum Likelihood Expectation Maximization) or OSEM (odered Subset Expectation Maximization) as well as geometric methods [7][8].They are based on solving the matrix system: | (1) |
Where P is the projection matrix; f is the object to be reconstructed and R the projection operator.
2.1. Algebraic Reconstruction Technique
The ART method is to correct the fi coefficients of f using a projection every time. Geometrically, it is interpreted as the search for the intersection of hyperplanes whose equations are those of the system (1). These hyperplanes can be interpreted as constraints to be satisfied solution. The search is performed by successive projections of the solution to a given constraints on iteration. And at least one system of equations is satisfied each iteration. This geometric interpretation is illustrated in figure 2 where i = j = 2 (rows and columns). The convergence of the method can also be illustrated by geometrical considerations on the triangle whose vertices are the solutions to three successive iterations.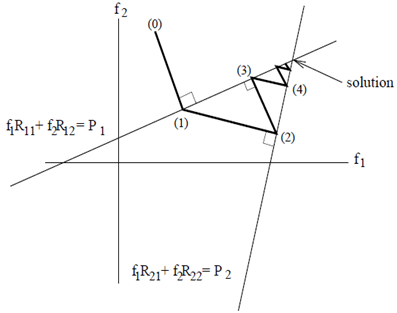 | Figure 2. Principle of the ART method[7] |
The mathematical expression of the correction according to the ART approach in its variant Kaczmarz easily obtained from the equation of the projection of a point on a hyperplane : | (2) |
k is the iteration number , a relaxation parameter λ.This equation can be interpreted as follows: each component of the vector i. at iteration k is corrected by adding the value,
  obtained in the previous iteration , a coefficient which is 0 if the ray j used for correcting only through not the point xi (in this case Rji is 0 ) and is otherwise proportional to the difference between the given pj ( true projection) and projection recalculated from
  equal to Rjf ( k -1 ) . The normalization factor
  is the standard line of the matrix R corresponding to the given day, that is to say, in the simple case considered here is equal to the number of pixels traversed by the ray j. In summary, the radius d can correct all pixels it crosses. At each iteration, a different beam is selected according to the following rule:
 | (3) |
When the system (1) has at least one solution, the algorithm converges to the solution of minimum variance when initialized to 0. However, when the data are noisy, the system may not have a solution, and the oscillation phenomenon occurs[9]. This is solved in this paper through the proposed new algorithm.
2.2. MLEM
M.L.E.M. is a technical Expectation Maximization (EM). It was presented in emission tomography by Shepp and Vardi[10]. This is an iterative technique that uses a probabilistic formulation of the reconstruction problem assuming the measured projections follow a Poisson statistics. The objective of this method is to determine the best image solution in the sense of maximum likelihood. An analysis of the reconstruction process MLEM helped implement a tweener interesting replica[11, 12, 13, 14]. It is done in two steps:§ calculating the expectation of the likelihood given the projections pk which is a measure of the current estimate of fi § maximization of hope in the partial derivatives with respect to fi . The formula is updated : | (4) |
with Rki , matrix elements of R.
2.3. The New Approach: ART -DS
Method identifies several advantages: the limitation of noise at high frequencies discrimination selected based on their current projections, the optimal convergence of the algorithm through proper quantification of the error introduced by the windowing all this resulting in a high quality picture. In the context of this paper only the first property is presented.If I is the initial matrix projected ART-DS method then requires that I be empirical and not sum matrix of four major blocks are: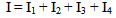 | (5) |
The highest projected value, M is divided into four and each block will consist of projections respectively between M, 3/2M, M / 2 and the minimum. During the experiments, beyond four blocks, we observe a distortion of the image due to poor distribution of projections. To ensure that the blocks have the same dimensions, the following is done: | (6) |
Where RN is the number of zeros for complete the block IN to obtain matrices of the same dimensions. This choice depends on the matrix block with the largest number of projections. In short: | (7) |
If we set | (8) |
We will have, | (9) |
With, 
 i and j represent the rows and columns respectively , ΣΣ is an empirical or non- algebraic and arithmetic as defined subset sum.
3. Materials and Methods
3.1. Material
 | Figure 3. Phantom Seismic representing a section of shin bone |
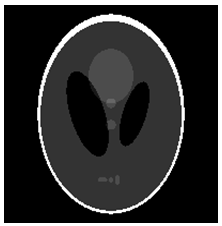 | Figure 4. Phantom Logan representing a section of the brain |
The experiments were evaluated on machines with two processors to reproduce the most powerful computers in the environment integrated with scanners currently available on the market. The images used are digital ghosts SHEPP kind LOGAN (see figure 4) and SEISMIC (see figure 3), generated in Matlab V7.5 software.
3.2. The Theory of Sets: Subsets
Cantor is the main creator of the theory of sets he has introduced in the early 1880s[15]. It is working on issues of convergence of trigonometric series in the 1870s, it was necessary to define a notion of derivation of sets of real numbers. Applications of his work have been extraordinarily influential and have had many different applications in mathematical logic and signal processing especially in the context of this work.Let P = {1, 2, 3, 4, 5}. A group made up of five elements, note card {P} = 5 (see Diagram 1). Then: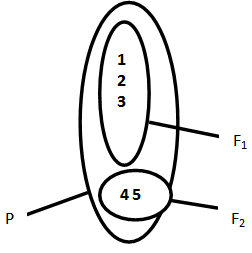 | Diagram 1. Distribution subsets |
Separating a multi-part assembly is formed of pieces of sets, subsets. All the elements of a subset of the set P Fi belong to P.By applying the consequences of this theory to projections from the tomograph, we deduce that there is within the set P of projections, sub -assemblies that can organize windows in M * N size depending of their values (intensity of future pixels) so, if we consider P consists of four windows as is the case in the context of this work, then: | (10) |
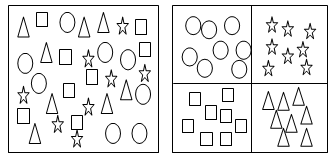 | Figure 5. Set of indiscriminate (left), subsets of projections discriminated by intensity, with improvement of the correlation (right) projection |
Windows are of similar values thus formed (see figure 5), which has the effect of increasing the inter-pixel correlation. The noise is considered in this case as part of the reconstructed image at high frequencies, when the reverse operation, the effect of noise is diminished and therefore sees justified by the triangle inequality explained in the next section.
3.3. The Triangle Inequality
The images from scanners, being coded on 8 bits ie positive pixel values between 0 and 255, the need to work with the positive variation of the theorem is imperative , the Cauchy defined by: | (11) |
Performing an algebraic extension of this equation, we get: | (12) |
because  and
and  If we denote E {X}, the statistical error in the reconstruction by ART method a set or subset of X, it follows that:
 | (13) |
This inequality shows that the likelihood of introducing errors or parasites in treatment is reduced if the treatment is carried out by piece, to the detriment of overall treatment Hence the need for a reconstruction windows or subassemblies, with an effect on the error quantized.
3.4. The Convergence Criterion
The quantification of the error is the main effect sought in this work. Upstream of iterations, windows where the reconstructed value of the variance will be constant over the iterations are obtained. Convergence is established when the variance becomes stable in the majority of the first rebuilt windows. The choice of the variance as a statistical parameter of the error here is justified by the fact that it allows to evaluate the fluctuations around the average, and is therefore more sensitive to the images.
4. Results and Discussion
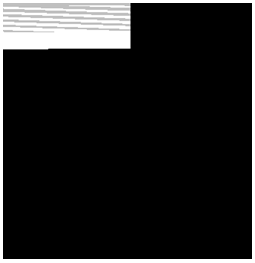
For the experiments, it was at first worked with non noisy projections from the phantom Logan figures 8 and 9, and the noise level was raised to 2 % to close as possible to clinical conditions, the experiment was repeated with the phantom seismic (figure 13). At the beginning of treatment, the selective discrimination has been applied.The results in figures 6 and 7 show the images discriminated four windows, Logan phantoms and seismic; Interdependence of pixels is better established and the correlation is significant.The first window of figure 6 consists of high frequencies and the third is the one with the least bias or parasites. This is why the subsequent behaviour of the curve 3 in figure 10 compared to others, due to a low value of the variance is observed. Phantom for seismic, it is the windows 3 and 4 are the most stable according to the plots in figure 13.It thus appears that the ART -DS method , using information provided by tracing the curves of variation of the variance , which is to identify the block or blocks that contain more inconsistencies with prospects as a specific filter and not for the global elimination of high frequencies. | Figure 6. Phantom Logan after selective discrimination in four blocks and before reconstruction |
 | Figure 7. Phantom Seismic after selective discrimination in four blocks and before reconstruction |
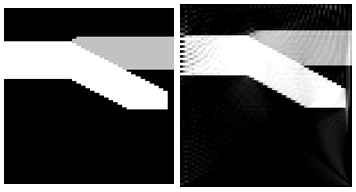 | Figure 8. Seismic Phantom original ( left) and reconstructed without (right) noise after 10 iterations |
Once this process is the iterative reconstruction algorithm is applied to the image (projected) discriminated. The behaviour of the variance in the iterations is given in figures 10, 11 and 13;By applying the properties of the ART -DS algorithm for Phantom Logan, one realizes that the iterations stop signal is given around six iterations becomes stable variance of 1% to 5 iterations in the first and the fourth window, and 6 for the second, which is sufficient according to the algorithm to decide on the convergence of the algorithm (see figure10) Continuing the experience with a higher level of noise (2%) (see figure 12 ), convergence will be established around 8 iterations and that the noise level is relatively low, there was a slight increase in the variance in the windows , showing that the algorithm quantifies the error actually (see figure 11 ). | Figure 9. Seismic Phantom original ( left) and reconstructed to 2% (right) noise after 10 iterations |
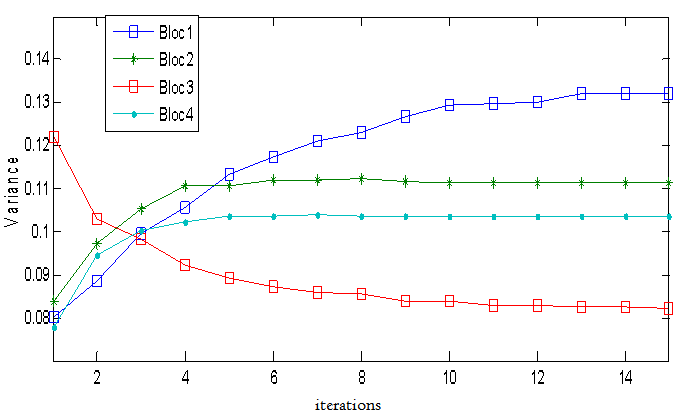 | Figure 10. Evolution of the variance for the phantom Logan noiseless |
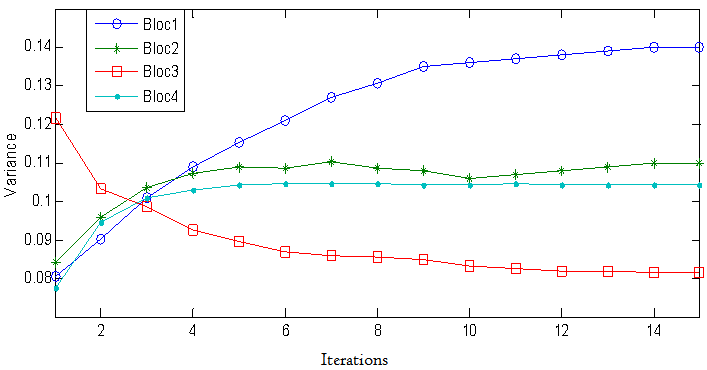 | Figure 11. Evolution of the variance in each block during the iterations for phantom Logan noisy 2% |
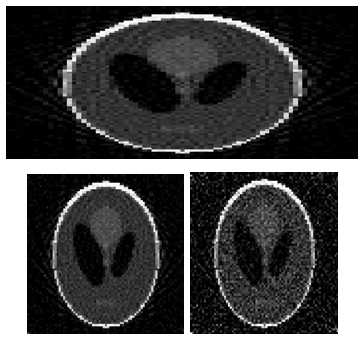 | Figure 12. Logan Phantom original (top) and reconstructed respectively 2 % and 9% (left and right) noise after 5 iterations |
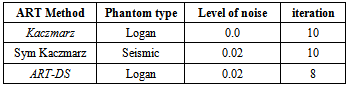
The Seismic phantom, under the same conditions, converges after 4 iterations as shown in figure 13 , the blocs1 and 3 converge around 4 iterations and block 4 around 3.The following table provides a comparison of different iterative algorithms based on their convergence criterion:Table 1. Comparison of results
 |
| |
|
We realize that actually account for digital Phantom of the same configurations and settings, proposed reducing the number of iterations method, establishing a more accurate convergence.
5. Conclusions
We presented in this paper, a new approach to iterative tomographic reconstruction, based on a convergence track that proves to be more accurate than many other methods. The results are used to note that the ART -DS method provides a good quantification of the error, with the outlook, a local filter for high frequencies but also a study of the noise reduction will be presented in another trial. However, it would be interesting to test the algorithm on real clinical data to confirm its effectiveness.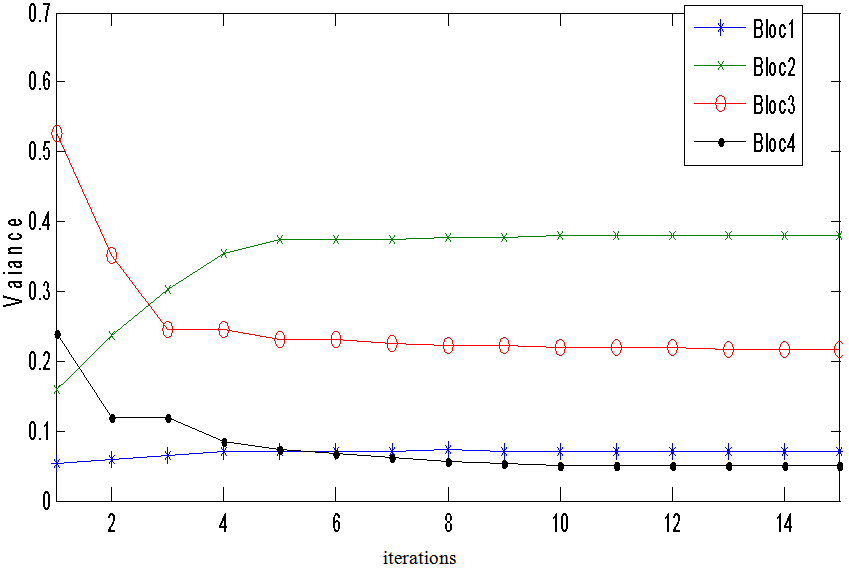 | Figure 13. Evolution of the variance in each block during the iterations for phantom Seismic noisy 2% |
References
| [1] | Z. J Lin, H. Niu , L.Li, and H.Liu, “Volumetric Diffuse Optical Tomography for Small Animals Using a CCD- Camera -Based Imaging System, ” Hindawi Publishing Corporation International Journal of Optics , 2012. |
| [2] | M .Pagani, S.Elander , and S.A Larsson “Alternative positron emission tomography with non- conventional positron emitters: effects of physical properties on Their picture quality and potential clinical applications, ” Eur J Nucl , Med , 1997. |
| [3] | A. Hassoun and O. Strauss, “Comparison of reconstruction activities in scintigraphic tweener. ” DOCTISS11 19th edition , St Priest , 2011. |
| [4] | B.Shalom , Z .Keidar, and A. Engel. “A new dedicated combined PET / CT system in the assessment of cancer patients, ” J Nucl Med , 2001. |
| [5] | A. Rico, “Choquet integrals as projection operators for quantified tomographic reconstruction,” Fuzzy Sets and Systems, 2008. |
| [6] | Johann Radon , “Über die Bestimmung von Funktionen durch ihre Integralwerte längs gewisser Mannigfaltigkeiten, ”, Berichte über die der Verhandlungen Königlich – Sächsischen Akademie der Wissenschaften zu Leipzig, Mathematisch Physische - Klasse (Leipzig : Teubner ) 1917 |
| [7] | A. Alpers, “Geometric reconstruction methods for electron tomography .,”Ultramicroscopy , 2013. |
| [8] | N. Konrad, “ Electrical Impedance Tomography in medical research, ” Przegląd Elektrotechniczny , 2013. |
| [9] | R. Gordon. “A Tutorial on ART ,” IEEE Trans. on Nuclear Science, 1974. |
| [10] | L.Shepp, and Y. Vardi, “reconstruction for emission tomography, ” IEEE Trans . Med Imaging, 1982. |
| [11] | O. Dreuille, P. Maszelin, H. Foehrenbach, and J.F. Gaillard, “Principle and technique of positron emission tomography (PET), ” Encycl Med Chir , Diagnostic Radiology - Principles and techniques of imaging , 2002. |
| [12] | V.Valotassiou, A.Leondi, G. Angelidis , D. Panagiotis , and Georgoulias, “PET and SPECT Imaging of Meningiom as, ” The Scientific World Journal , 2012. |
| [13] | R.A Koeppe, C.D Hutchins, “Instrumentation for positron emission tomography : tomographs and data processing and display systems, ” Semin Nucl Med 1992. |
| [14] | M.T Hirschmann, C.R Wagner, H. Rasch and J.Hencke, “Standardized volumetric 3D -analysis of SPECT / CT imaging in orthopedics : overcoming the limitations of 2D qualitative analysis ,” BMC Medical Imaging, 2012. |
| [15] | J.Louis Krivine , “Set Theory ,” cassini edition, 1998. |
 Abstract
 Reference
 Full-Text PDF
 Full-text HTML