Amin Jarrah1, Mohsin Jamali1, Jermy Ross2, Peter Gorsevski2, J. Frizado2, V. P. Bingman2
1Department of Electrical Engineering & Computer Science, The University of Toledo, Toledo, 43606, USA
2Geospatial Sciences School of Earth & Environment, Bowling Green State University, Bowling Green, USA
Correspondence to: Amin Jarrah, Department of Electrical Engineering & Computer Science, The University of Toledo, Toledo, 43606, USA.
| Email: |  |
Copyright © 2012 Scientific & Academic Publishing. All Rights Reserved.
Abstract
A bird and bat monitoring system has been developed that uses marine radar, IR camera and acoustic recorders for wind farm applications. IR video recording is used to monitor birds and bats activity which will be useful for wildlife biologists in developing mitigation techniques to minimize impact of wind turbines on birds and bats. The goal is to quantify birds and bats activity near wind turbines. Radar will provide z-coordinate (altitude) and IR camera will provide (x, y) coordinates of birds/bats. Acoustic monitoring is used to identify birds and bats at their species level. This paper deals with the use of marine radar for determining altitudes, direction and quantity (passage rates) of birds/bats. Data from the marine radar is digitized and processed with open source radR software. Since the data is unknown tracking and quantification can be very challenging. This paper deals with the sensitivity analysis and effects of various parameters used in the tracking algorithm so resulting data can be meaningful.
Keywords:
Marine Radar, Data Processing, Sensitivity Analysis
Cite this paper: Amin Jarrah, Mohsin Jamali, Jermy Ross, Peter Gorsevski, J. Frizado, V. P. Bingman, Sensitivity Analysis for Optimal Parameters for Marine Radar Data Processing, American Journal of Signal Processing, Vol. 3 No. 3, 2013, pp. 78-83. doi: 10.5923/j.ajsp.20130303.05.
1. Introduction
Wind turbine installations are increasing at a very rapid pace all around the world. Wind turbines are often in the path of nocturnally migratory birds and bats and putting them at a higher risk of colliding with wind turbines[1, 2, 3]. One way to deal with this issue and living in harmony is to provide some technical data to wild life biologists so they can develop mitigation methods. They can also use quantified data for resolving siting issues. Biologists have used radars, infrared cameras and recorded bird/bat calls for their work for number of years. Use of radars originated in the 1940s when early users attributed echoes of unknown origin ("angels") that they observed on radar screens, to birds[4, 5]. In the years since, zoologists have used radar to study the behavior of many types of mobile organisms including birds, bats and insects[6]. Today, researchers study the movements of organisms using a wide variety of types of radar from small marine units[5, 7], surplus military equipment[8], fixed beam "entomological radars"[9] to broad-scale Weather Surveillance Radar (WSR) arrays[10]. Radar is a useful tool where direct observations of biological phenomena are challenging, such as at night or in fog[5]. The radar system consists of a Furuno 1500 Mark 3 marine radar, digitizing card (XIR3000B) from Russell Technologies and a PC. Radar has been used to collect data during migratory period in the fall and spring of 2011 and 2012 near Ottawa National Wildlife Refuge. This area has a very potential of on-shore and off-shore future wind turbine installation. The data collection site was also recommended by our team wild life biologists. Radar data was collected for almost three months during each spring and fall nocturnal migration period. The data was collected every clear night with high probability of heavy bird migration from one hour sunset to one hour to sunrise. The collected data was digitized in real time and stored on PC.The data collected is processed using open source radR software. This software is developed by the Taylor, Brzustowski and others at the Acadia University in Canada. The radR software is used to process raw radar data, removes noise or clutter and track targets. It has been used extensively in this project. The experimental setup of the entire system is shown in Figure. 1. The data obtained from the marine radar is the reflectivity information and bird detection is performed using filtering techniques. Filtering of radar data is implemented by applying background subtraction, median filtering, segmentation and morphology [11]. | Figure 1. Experimental setup |
Small targets within 500 m of the radar range and targets with a velocity of less than 6 m/s has been filtered using air speed. The airspeed is calculated using the formula given in[12]: | (1) |
Where Va is the airspeed, Vg is the groundspeed, Vw is the wind velocity, and θ is the angle between the target direction and wind vector direction. The average flight direction is given as[12]: | (2) |
 | (3) |
 | (4) |
Where  is the flight direction at ith observation, and n is the number of observations. Dispersion is calculated as:
  | (5) |
The rest of this paper is organized as follows; research motivation is presented in Section 2. A brief overview of radar data processing using radR and its most features are presented in Section 3. A sensitivity analysis is provided in Section 4. Conclusions are given in Section 5.
2. Research Motivation
IR video recording is used to monitor birds and bats activity which will be useful for wildlife biologists in developing mitigation techniques to minimize impact of wind turbines on birds and bats. One of the problems in this application is that the data is unknown and tracking of targets is very challenging. The radR software requires setting of various parameters and threshold values before processing of any data. It has then become a challenging task for providing initial set up data. So, a sensitivity analysis and effects of various parameters used in tracking algorithm is performed. This will allow proper use of initial parameters that will result in reasonable accurate result and proper inferences can be drawn from unknown data set.
3. Radar Data Processing
There are few readily available software tools for the acquisition, storage and processing of such data. Program radR is user friendly, easily available and open source software[5]. radR is written in R which is available as Free Software under the terms of the Free Software Foundation's GNU General Public License in source code form. It compiles and runs on a wide variety of UNIX platforms and similar systems (including FreeBSD and Linux), Windows and MacOS[13]. The target detection in marine radars is difficult due to high amount of clutter and noise. The ground clutter can be reduced in the marine radar by using protection shield around the radar beam or by elevating the antenna mount[14]. Various steps in processing marine radar data are shown in Figure. 2. The efficiency of target detection depends on the accuracy of the tracking method used as it helps in removal of unwanted targets[11].  | Figure 2. Target detection using marine radar data |
The tracking of the targets is based on their detection on multiple sweeps of the radar to understand their flight behavior. Tracking also helps in identifying the bird migration paths. Tracking algorithms are based on estimation methods in which a data with random noise is used to predict the position of the target in the next time interval. Tracking methods use initial position, velocity and acceleration and predict future position of the target. The efficiency of the tracking method depends on the accuracy of initial conditions and the assumptions made during their design. Some of the tracking techniques are maximum likelihood, Bayes estimators, maximum a posteriori, minimum variance unbiased estimator, Kalman filter, particle filter and Weiner filter[15].The tracking model uses the scan approach by which multiple targets are tracked by search and scan technique[16]. Marine radars operate in surveillance mode and requires target tracking algorithm for generation of target tracks. Figure. 3 shows steps involved in target tracking. | Figure 3. Target Tracking |
The Furuno radar used in this project has power of 25 KW. It used with 6 ft t-bar and parabolic dish antennas. It is capable of operating in horizontal and vertical mode when used with the t-bar antenna. radR project comprised of various plugins. It reads data from the digitizing card, removes noise, processes blips and saves them for target tracking. It operates in batch file fashion, loads various plugins, parameters, runs the data and saves the processed data. First of all required plugins are selected and then each plugin would require its own configuration. Various plugins are loaded and configured in the following fashion.-xir3000- Used to receive data from XIR3000 digitizing card-tracker-Creates tracks for objects of interest-video- Reads video data-antenna- Used for selection of an antenna and its parameters-blipmovie-Saves data in blip movie format-declutter- Removes unwanted noise or objects-zone-Excludes data within the defined region-genblips- Generates artificial blips-saveblips-Saves blip information in .blip fileOptimal processing of radar data requires that parameters in radR (radar data processing environment) should be set appropriately. radR project currently supports two types of tracking model; multi-frame based model and nearest neighbor model. In our analysis we used multi-frame model since it gives more accurate results. It starts with two scans and matches blips between them using the nearest neighbor. It then assigns a velocity to the set of matched blips in the 2nd scan. It will have knowledge of how far blip has moved and its time duration. The third scan will consider all possible connections between blips in the first two scans, and those in the third. Initial steps involve running the batch file, antenna selection and XIR3000 reader plugin. The data is read by the .REC file reader plugin called XIR3000. Initially the radR application is launched and then the XIR3000 plugin is enabled which helps in batch processing of the files. Then various parameters must be selected carefully to get high accuracy as shown in Figure. 4. Some of the parameters are the antenna which is selected based on the type of antenna, the beam widths, angle above the ground and axis of rotation, the number of learning scans which is used in background subtraction technique, noise threshold, hot score and cold score which is used to differentiate bird targets from the background noise, cell size and filtering based on a logical expressing, minimum blip area, maximum blip area, minimum number of samples and maximum number of samples, blip extend diagonally, maximum speed of tracked object, minimum number of blips for a track, minimum gain of a blip to join a track, and Old stats weighing is a parameter that defines weights between past and present frame’s background mean and mean deviances. | Figure 4. Processing of data in radR |
Antenna plugin will require selection of antenna as there are two kinds of antenna used in this project namely parabolic dish with 4º pencil beam and a 6 ft t-bar antenna. Marine operates in vertical mode when t-bar antenna is used. Parabolic antenna is pointed 15º above the horizon. Tracking has two main steps: declutter learning and declutter filtering. First learning the pattern of clutter is performed by the declutter plugin. More than one hundred scans are processed from blip movie. Using the learned pattern clutter is filtered out. A radar parameter sensitivity analysis has been performed. Variation of each parameter value is plotted with respected to other critical parameters. The direction (x-axis) and number of the migrating birds (y-axis) are critical parameters and they have been plotted with various parameter settings. Since birds migrate in groups so a sharp peak will be desired. Moreover side lobes should be smaller. Following are ten parameters that have been analysed which are recommended by our team wild life biologists.
4. Sensitivity Analysis
4.1. Hot Score Threshold Parameter without Cluttering
This parameter identifies the mean intensity of the blip to differentiate bird targets from the background noise. It should correspond to the sharp peak value of the plot. Three appropriate values were considered and are plotted in Figure. 5. The best value will be 2.8 as it has sharp peak and has little error on sides as compared to others. This threshold value detects 215 objects. A value of 3.0 removes some of objects and its peak is not sharp. It is only able to detect 175 objects. 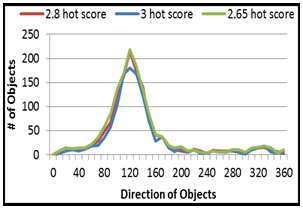 | Figure 5. Hot score threshold (high) without cluttering |
4.2. Hot Score Threshold Parameter with Cluttering
Four appropriate values were considered and plotted. It can be seen in Figure. 6 that there is a need for clutter removal to obtain correct results. The best value is 2.5 which provides sharp peak and lower sides. 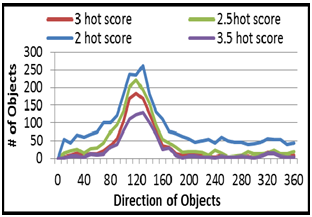 | Figure 6. Hot score threshold (high) with cluttering |
4.3. Blip Extend Diagonally
It can be seen from Figure. 7 that almost no change if the blip is extended diagonally. 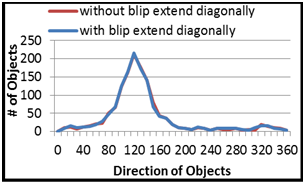 | Figure 7. Impact of blip extend diagonally |
4.4. Maximum Speed of Tracked Objects
This parameter identifies the maximum speed of the object. If the speed of the object is faster than 100m/s, it will be ignored and considered it as noise. Various values were considered and the best value of 100. It provides sharp peak and has a little error on sides compared with others. If this parameter is changed then results are worst as shown in Figure. 8.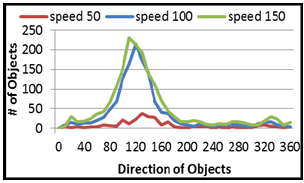 | Figure 8. Impact of maximum speed of tracked objects |
4.5. Minimum Blip Area
This parameter identifies the minimum area of the object. If the area of the object is less than 300 then it will be ignored and considered it as noise. Various values were considered and the best value of 300 provides sharp peak. There is not much difference with the use of other values as shown in Figure. 9. 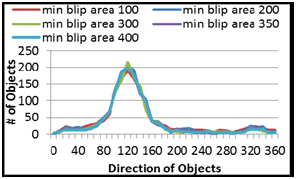 | Figure 9. Impact of min blip area |
4.6. Minimum Number of Blip Samples
It identifies the minimum number of sample of the object of interest. Various values were considered and the best value of 30 is selected. It provides sharp peak and has a little error on sides as shown in Figure 10.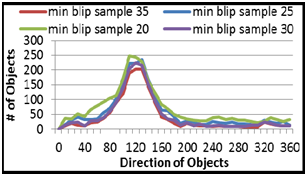 | Figure 10. Impact of min blip sample |
4.7. Minimum Number of Blips Required for a Track
This identifies the minimum number of blips that will be required to form a track. This parameter has a strong impact on data processing and must be selected carefully. The best value is 4 as it has sharp peak and has a little error on sides as shown in Figure 11.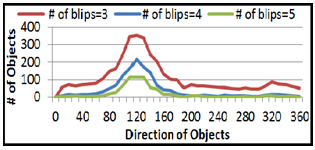 | Figure 11. Impact of minimum number of blips required for a track |
4.8. Minimum Gain of a Blip to Join a Track
It identifies the minimum gain value of the object to be considered in a certain track. It is computed by a gain function for each combination of track and blip by predicting the target location based on the velocity and the time elapsed between the track endpoint and the blip. The best value is 10 as it has sharp peak as shown in Figure. 12. This parameter has a strong impact on data processing and must be selected carefully. 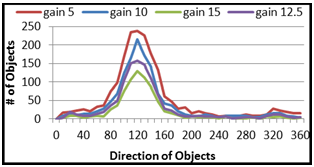 | Figure 12. Impact of minimum gain of a bilp to join a track |
4.9. Number of Scans to Build Tracks
It is the minimum number of scan to build a track. The best value is 2 as shown in Figure. 13. It also has a strong impact on data processing and must be selected carefully. 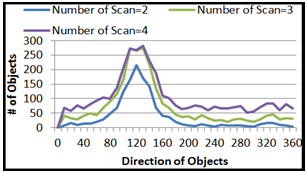 | Figure 13. Impact of number of scans to build tracks |
4.10. Number of Samples per Cell
It is the number of samples for each cell which represents the number of rows in one stats cell. The best value is 4 as shown in Figure. 14.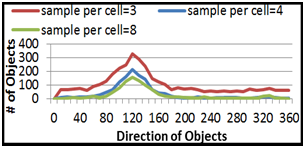 | Figure 14. Impact of number of samples per cell |
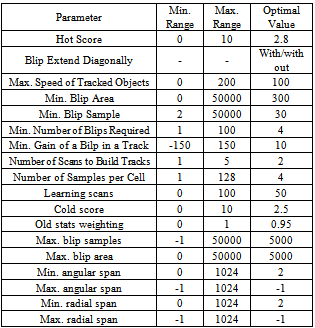
Table 1. Optimal parameter values for radar data processing
 |
| |
|
Finally optimal parameter values for radar data processing in radR project simulator are summarized in Table 1. It allows proper use of initial parameters that will result in reasonable accurate result and proper inferences can be drawn from unknown data set
5. Conclusions
Marine radar was used for monitoring of birds/bats activity near potential wind farm area. Radar data was processed using radR open source software. It required setting of appropriate parameters and threshold values. A sensitivity analysis was performed. We showed that some parameters have strong impact on tracking and data analysis while other parameters may have a little impact. Optimal values of these parameters for obtaining accurate result are summarized which will be useful for wildlife biologists in developing mitigation techniques to minimize impact of wind turbines on birds and bats.
References
| [1] | M. M. Jamali, Brett Snyder, John Williams, Ryan Kindred, Gavin St. John, M. W. Majid, J. Ross, J. Frizado, P. V. Gorsevski, V. Bingman, “Remote Avian Monitoring System for Wind Turbines, Paper presented at the 2011 IEEE International Conference on Electro/Information Technology, May 2011. |
| [2] | S. Bastas, G. Mirzaei, M. W. Majid, J. Ross, M. M. Jamali, J. Frizado, P. V. Gorsevski, V. Bingman, “A Novel Classification System for Flight Calls,” The 2012 IEEE International Symposium on Circuits and Systems, Seoul, Korea, May 2012. |
| [3] | Golrokh Mirzaei, Mohammad Wadood Majid, Selin Bastas, Jeremy Ross, Mohsin M. Jamali, Peter V. Gorsevski, Joseph Frizado,Verner P. Bingman, “Acoustic Monitoring Techniques for Avian Detection and Classification,” The Asilomar Conference on Signals, Systems, and Computers,” November 2012. |
| [4] | Eastwood E: Radar Ornithology. London: Methuen & Co. Ltd; 1967.  |
| [5] | Philip D, John M, Carolyn M, Michael L and Dave W. “radR: an open-source platform for acquiring and analysing data on biological targets observed by surveillance radar”. 2010 Taylor et al; licensee BioMed Central Ltd. |
| [6] | Alerstam T: Bird migration. Cambridge: Cambridge University Press; 1990.  |
| [7] | Cooper BA, Day RH, Ritchie RJ, Cranor CL: An improved marine radar system for studies of bird migration. Journal of Field Ornithology 1991, 62:367-377.  |
| [8] | Bruderer B, Steuri T, Baumgartner M: Short-range high-precision surveillance of nocturnal migration and tracking of single targets. Israel Journal of Ornithology 1995, 41:207-220.  |
| [9] | Drake VA: Automatically operating radars for monitoring insect pest migrations. Entomologia Sinica 2002, 9:27-39.  |
| [10] | Gauthreaux SA, Belser CG: Radar ornithology and biological conservation. Auk 2003, 120:266-277. Publisher Full Text . . |
| [11] | Ning Huansheng, Chen Weishi, Mao Xia and Li Jing, Bird-Aircraft Strike Avoidance Radar, IEEE A&E Systems Magazine, January 2010, Vol. 25(1): p. 19-28. |
| [12] | Todd J. Mabee, Brian A. Cooper, Jonathan H. Plissner and David P. Young, Nocturnal Bird Migration Over an Appalachian Rigde at a Proposed Wind Power Project, Available from:http://onlinelibrary.wiley.com/doi/10.2193/0091-7648%282006%2934%5B682:NBMOAA%5D2.0.CO;2/abstract. |
| [13] | Philip D. Taylor, John M. Brzustowski, Carolyn Matkovich, Michael L. Peckford and Dave Wilson, radR: An Open-source Platform for Acquiring and Analysing Data on Biological Targets Observed by Surveillance Radar, BMC Ecology, 2010, from: http://www.radr-project.org/. |
| [14] | Brian A. Cooper, Robert H. Day, Robert J. Ritchie and Clayton L. Cranor, An Improved Marine Radar System for Studies of Bird Migration, Journal of Field Ornithology, 1991, Vol. 62(3): p. 367-377. |
| [15] | Methods of Estimation from:http://web.as.uky.edu/statistics/users/viele/sta321s98/estimation/estimation.html |
| [16] | Track Radar Systems Available from:http://ed-thelen.org/MMS-150-Ch04.pdf |


 is the flight direction at ith observation, and n is the number of observations. Dispersion is calculated as:


 Abstract
 Reference
 Full-Text PDF
 Full-text HTML


 .
.