-
Paper Information
- Next Paper
- Previous Paper
- Paper Submission
-
Journal Information
- About This Journal
- Editorial Board
- Current Issue
- Archive
- Author Guidelines
- Contact Us
American Journal of Signal Processing
p-ISSN: 2165-9354 e-ISSN: 2165-9362
2013; 3(3): 71-77
doi:10.5923/j.ajsp.20130303.04
Knowledge-based Classification of Quickbird Image of Ulaanbaatar City, Mongolia
 Abstract
 Reference
 Full-Text PDF
 Full-text HTML
D. Amarsaikhan1, Ts. Bat-Erdene2, M. Ganzorig1, B. Nergui1
1Institute of Informatics, Mongolian Academy of Sciences, av.Enkhtaivan-54B, Ulaanbaatar-51, Mongolia
2Department of Geography and Tourism, Mongolian State University of Education, Ulaanbaatar-46, Mongolia
Correspondence to: D. Amarsaikhan, Institute of Informatics, Mongolian Academy of Sciences, av.Enkhtaivan-54B, Ulaanbaatar-51, Mongolia.
| Email: |  |
Copyright © 2012 Scientific & Academic Publishing. All Rights Reserved.
The aim of this research is to produce an urban land cover map ready to be used for planning and management. To extract the reliable information from the selected remote sensing (RS) data, a knowledge-based method based on a rule-based approach is constructed. The result of the knowledge-based technique is compared with the result of a standard maximum likelihood classification (MLC) method and it indicates a higher accuracy. Overall, the study indicates that the knowledge-based method is a powerful tool in the production of a reliable land cover map and the output of the method can be used for any spatial decision-making process.
Keywords: RS Image, Land Cover, Knowledge-based, Classification
Cite this paper: D. Amarsaikhan, Ts. Bat-Erdene, M. Ganzorig, B. Nergui, Knowledge-based Classification of Quickbird Image of Ulaanbaatar City, Mongolia, American Journal of Signal Processing, Vol. 3 No. 3, 2013, pp. 71-77. doi: 10.5923/j.ajsp.20130303.04.
Article Outline
1. Introduction
- At present, because of the rapid development of a human society and the related newly emerging issues, appropriate planning and management are becoming the major tasks of governments in both developed and developing countries. To analyze the current changes and conduct planning and management, the planners and decision-makers need to regularly evaluate development procedures using updated planning maps. However, most planners in developing countries do not have updated maps, because conventional mapping is still very expensive and time consuming. One of the possible solutions could be the use of remotely sensed images with different spatial and spectral resolutions[1].In recent years, satellite RS techniques and technologies have been revolutionized. System capabilities have greatly improved and the costs for the primary RS data sets have been drastically decreased. Meanwhile, much satellite information can be available free of charge from different sources on the Internet. Now the highest spatial resolution images can be acquired with centimeters-accuracy, whereas the ordinary high-resolution images can be acquired with a few meters accuracy. This means that it is possible to extract different thematic information of varying scales from RS images having different spatial and spectral resolutions[2]. As the advancements are made in RS, the space images have been increasingly used for mapping and planning activities [3,4].Over the years, for the extraction of thematic information from RS images, different digital methods of classification which mainly assigned the pixels to class labels based on their spectral properties, have been used. The widely used methods are parametric and non-parametric methods as well as neural network classifications[5,6]. Although, the current satellite RS data classification methods have been tremendously improved, it is still difficult to separate the spectrally similar pixels. To separate these pixels, some researchers have conducted studies based on the spatial unit of fields instead of pixels, utilizing field attributes as discriminant criteria for pre-classification, post-classification, or bothpre-classification and post-classification[7]. It is obvious that spatial characteristics might play a key role, if spectral properties could not solve the problem.The aim of this study is to produce an urban land cover map from a Quickbird image to be used for planning and management. For the identification of urban land-cover types a knowledge-based classification technique based on a rule-based approach has been constructed. The constructed method uses an initial image segmentation procedure based on a MLC method as well as the constraints on spectral and spatial thresholds. The result of the knowledge-based method was compared with a result of a traditional statistical MLC and it demonstrated higher accuracy.
2. Test Site and Data Sources
- As a test site, Baga toiruu area situated in central part of Ulaanbaatar, the capital city of Mongolia has been selected. The Baga toiruu is the city business district of Ulaanbaatar where different government, educational, cultural and commercial organizations are located. The location of the Baga toiruu area represented in a panchromatic Quickbird image of 2012 is shown in figure 1a.In the current study, a 1:5000 scale topographic map of 2000, and Quickbird images acquired in May 2012 have been used. The Quickbird data has four multispectral bands (B1: 0.45–0.52μm, B2: 0.52–0.60μm, B3: 0.63–0.69μm, B4: 0.76–0.90μm) and one panchromatic band (Pan: 0.45-0.9μm). The spatial resolution is 0.63 m for the panchromatic image, while it is 2.44 m for the multispectral bands. In the current study, green, red and near infrared bands as well as panchromatic image have been selected.
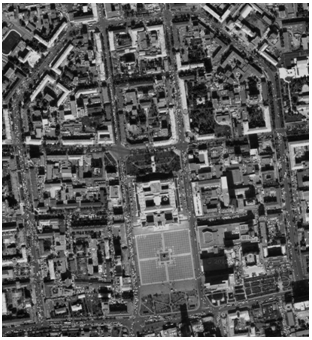 | Figure 1. The location of the Baga Toiruu area represented in a Quickbird image of 2012 |
3. Radiometric Correction and Co-registration of the RS Images
- At the beginning, the panchromatic and multispectral Quickbird images were analyzed in terms of radiometric quality and geometric distortion. The panchromatic data had some radiometric noise and in order to correct it, a 3x3 size average filtering[8] was applied.There should be needed a high geometric accuracy and good geometric correlation between the images in order to perform successful data fusion. Initially, the panchromatic Quickbird image has been georeferenced to a Gauss-Kruger map projection using a topographic map of 2000, scale 1:5000. The ground control points (GCP) have been selected on well defined cross sections of roads, streets and building corners and in total, 12 regularly distributed points were selected. For the transformation, a second order transformation and nearest neighbour resampling approach[9] have been applied and the related root mean square (RMS) error was 0.98 pixel. Likewise, the multispectral Quickbird image has been georeferenced to a Gauss-Kruger map projection using the same topographic map of the test area. For the transformation the same number of GCPs has been used and the related RMS error was 0.97 pixel. In each case of the georeferencing, an image was resampled to a pixel resolution of 1m.
4. Fusion of Panchromatic and Multispectral Quickbird Images
- As there are data sets with different spatial and spectral resolutions, they should be fused for conducting further analysis. The concept of image fusion refers to a process, which integrates different images from different sources to obtain more information from a single and more complete image, considering a minimum loss or distortion of the original data[10]. In other words, the image fusion is the integration of different digital images in order to create a new image and obtain more information than can be separately derived from any of them[11]. Generally, image fusion can be performed at pixel, feature and decision levels[12]. In this study, data fusion has been performed at a pixel level and the following techniques were compared: (a) Brovey transform, (b) Gram-Schmidt fusion method, (c) principal component analysis (PCA), (d) intensity–hue–saturation (IHS) transformation. Each of these techniques is briefly discussed below.Brovey transform: This is a simple numerical method used to merge different digital data sets. The algorithm based on a Brovey transform uses a formula that normalises multispectral bands used for a red, green, blue colour display and multiplies the result by high resolution data to add the intensity or brightness component of the image[13]. The high spatial resolution data is usually a panchromatic band with more finer spatial resolution than the multispectral images. In the present study, for a Brovey transform, the multispectral Quickbird bands were considered as the low resolution bands, while the panchromatic image was considered as the higher spatial resolution band.Gram-Schmidt fusion method: Gram-Schmidt process is a procedure which takes a non-orthogonal set of linearly independent functions and constructs an orthogonal basis over an arbitrary interval with respect to an arbitrary weighting function. In other words, the Gram-Schmidt method creates from the correlated components non- or less correlated components by applying orthogonalization process[14]. In the method, at any inner product space, we can choose the basis to work and it often simplifies the calculations to work in an orthogonal basis. Within the framework of the current study, like in the case of a Brovey transform, the multispectral images were considered as the low resolution bands, while the panchromatic data was considered as the higher spatial resolution band.PCA: The most common understanding of the PCA is that it is a data compression technique used to reduce the dimensionality of the multidimensional datasets or bands. When the PCA is performed, the axes of the spectral space are rotated and the new axes are parallel to the axes of the ellipse. The length and direction of the widest transect of the ellipse are calculated using a matrix algebra. The transect, which corresponds to the major axis of the ellipse, is called the first principal component of the data. The direction of the first principal component is the first eigenvector, and its length is the first eigenvalue. A new axis of the spectral space is defined by this first principal component. The second principal component is the widest transect of the ellipse that is perpendicular to the first principal component. As such, the second principal component describes the largest amount of variance in the data that is not already described by the first principal component. In a two-dimensional case, the second principal component corresponds to the minor axis of the ellipse. In n dimensions, there are n principal components. Each successive principal component is the widest transect of the ellipse that is orthogonal to the previous components in the n-dimensional space, and accounts for a decreasing amount of the variation in the data which is not already accounted for by previous principal components[15].
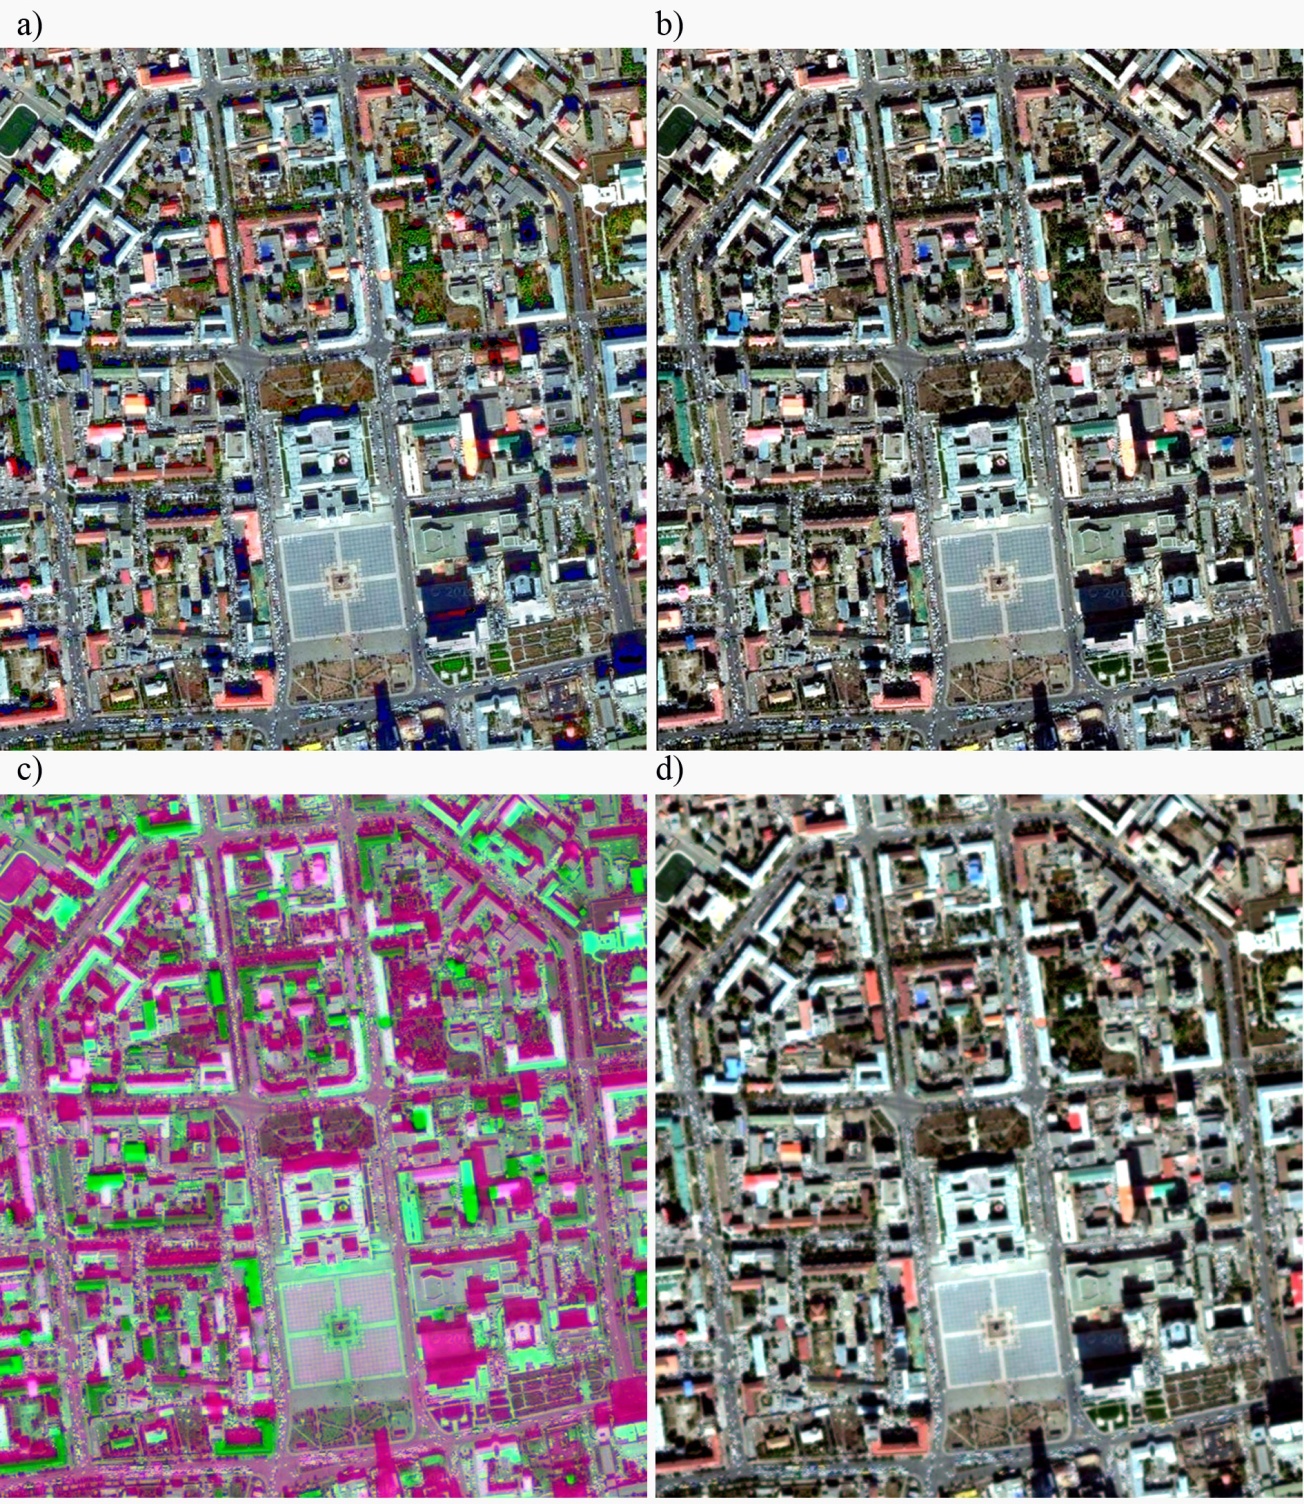 | Figure 2. Comparison of the fused images: (a) Brovey transformed image; (b) image obtained by Gram-Schmidt fusion; (c) PC image (red=PC2, green=PC3, blue=PC1); (d) image obtained by IHS method |
5. Standard Classification
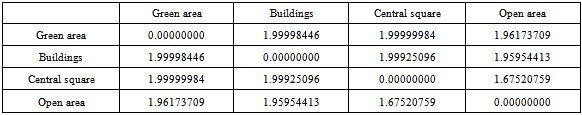
- Initially, in order to define the sites for the training signature selection, from the Gram-Schmidt fused image, some areas of interest (AOI) representing the selected four classes (green area, buildings, central square and open area) have been selected through thorough analysis using a polygon-based approach. The separability of the training signatures was firstly checked in feature space and then evaluated using transformed-divergence (TD) separability measure (table 1). The values of TD separability measure range from 0 to 2.0 and indicate how well the selected pairs are statistically separate. The values greater than 1.9 indicate that the pairs have good separability (ERDAS 1999, ENVI 1999). After the investigation, the samples that demonstrated the greatest separability were chosen to form the final signatures. The final signatures included 573-7176 pixels for all classes.In general, urban areas are complex and diverse in nature and many features have similar spectral characteristics and it is not easy to separate them by the use of ordinary feature combinations. For the successful extraction of the urban land cover classes, reliable features derived from different sources should be used[17]. In the current study, we considered the Gram-Schmidt fused image as the image that can statistically separate the available classes.For the actual classification, a supervised MLC has been used assuming that the training samples have the Gaussian distribution[18]. For the accuracy assessment of the classification result, the overall performance has been used. This approach creates a confusion matrix in which reference pixels are compared with the classified pixels[9]. As ground truth information, different AOIs containing 5674 purest pixels have been selected. AOIs were selected on a principle that more pixels should be selected for the evaluation of the larger classes than the smaller classes. The confusion matrix produced for the MLC showed overall accuracy of 80.57%. The final classified image is shown in figure 3a. As seen from figure 3a, it is still very difficult to obtain a reliable land cover map by the use of the standard technique, specifically on decision boundaries of the statistically overlapping classes.
|
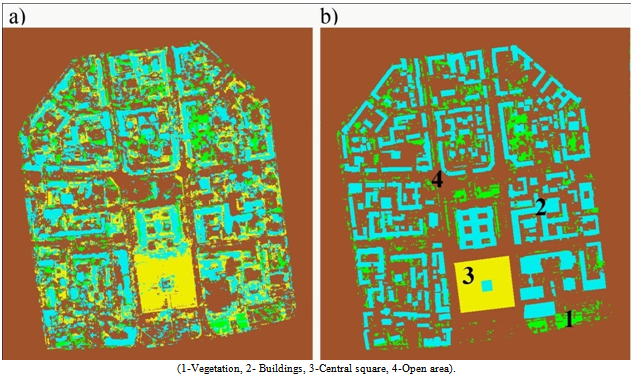 | Figure 3. a) The result of the standard MLC, b) The result of the rule-based method |
6. Knowledge-based Classification
- Over the past years, knowledge-based techniques have been widely used for the classification of RS images. In general, a knowledge-based approach is part of artificial intelligence and is considered one of the very high level methods. The knowledge in image classification can be represented in different forms depending on the type of knowledge and necessity of its usage. The most commonly used techniques for knowledge representation are a rule-based approach and neural network classification[19]. In the present study, for discrimination of the urban land-cover types a rule-based approach has been applied. A rule-based approach uses a hierarchy of rules, or a decision tree describing the conditions under which a set of low-level primary objects becomes abstracted into a set of the high-level object classes. The primary objects contain the user-defined variables and include geographical objects represented in different structures, external programs, scalars and spatial models[20].The constructed rule-based approach consists of a set of rules, that contains the initial image segmentation procedure based on a Mahalanobis distance classifier[9] and the constraints on spectral parameters and spatial thresholds. In the Mahalanobis distance estimation, for the initial separation of the classes, only pixels falling within 1.0 standard deviation (SD) and the Gram-Schmidt fused features were used. The pixels falling outside of 1.0 SD were temporarily identified as unknown classes and further classified using the rules in which different spectral and spatial thresholds were used.The spectral thresholds were determined based on the knowledge about spectral characteristics of the selected classes, whereas the spatial thresholds were determined based on polygon boundaries of a geographical information system (GIS) layer. The GIS layer was created through digitizing of the available classes from the topographic map of study area, scale 1:5000. The image classified by this method is shown in figure 3b. As seen from the classified image, the rule-based approach could very well separate all individual objects and this result can be successfully used for planning and management. For the accuracy assessment of the classification result, the overall performance has been used. As ground truth information, for each class several regions containing the same number of (5674) purest pixels have been selected. The confusion matrix indicated an overall accuracy of 95.17%. The flowchart of the constructed rule-based classification procedure is shown in Figure 4.
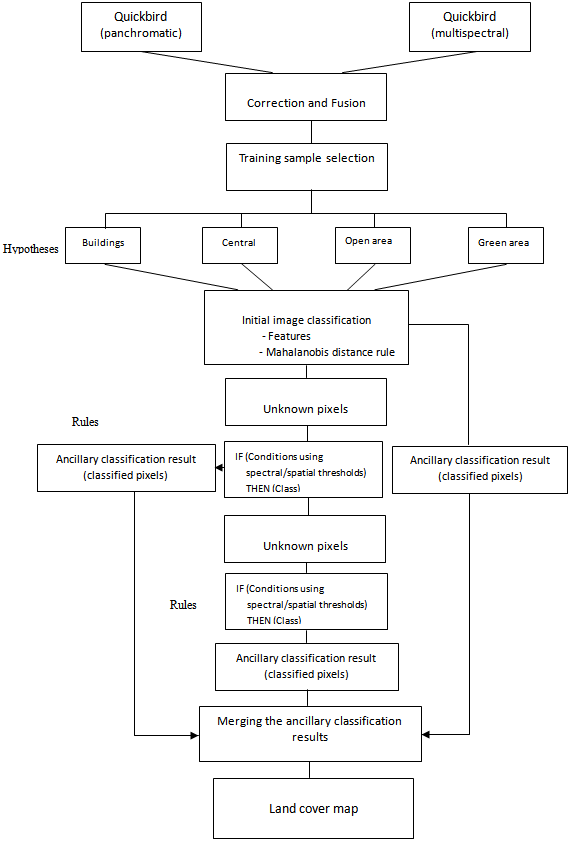 | Figure 4. A general diagram of the constructed rule-based classification |
7. Conclusions
- The main aim of the research was to produce an urban land cover map ready to be used for planning and management. As the RS data sources, panchromatic and multispectral Quickbird images of Ulaanbaatar, the capital city of Mongolia were used. For the generation of a land cover map, statistical MLC and knowledge-based method were used and the results were compared. As could be seen from the classification results, the performance of the knowledge- based technique was much better than the performance of the standard method and the result could be used for any spatial decision-making. Overall, the research indicated that the knowledge-based method is a powerful tool in the production of a reliable land cover map and for the high quality output sophisticated rules should be constructed.