-
Paper Information
- Paper Submission
-
Journal Information
- About This Journal
- Editorial Board
- Current Issue
- Archive
- Author Guidelines
- Contact Us
American Journal of Signal Processing
p-ISSN: 2165-9354 e-ISSN: 2165-9362
2013; 3(2): 35-40
doi:10.5923/j.ajsp.20130302.03
Characterization of Vibration Test Data of Satellites
 Abstract
 Reference
 Full-Text PDF
 Full-text HTML
B R Nagendra1, A M Khan2, V Ramesh Naidu1, S N Prakash1, N K Misra1
1Facilities, ISRO Satellite Centre, Bangalore, Karnataka, India
2Department of Electronics, Mangalore University, Mangalore, Karnataka, India
Correspondence to: B R Nagendra, Facilities, ISRO Satellite Centre, Bangalore, Karnataka, India.
| Email: |  |
Copyright © 2012 Scientific & Academic Publishing. All Rights Reserved.
Characterization of a signal provides information about the nature of the signal. It also helps in the selection of methodologies to process the signal, and is essential for development of efficient compression algorithm for the data representing the signal. Techniques for characterization of a signal are categorized into three types: signal magnitude analysis, time domain analysis, and frequency domain analysis. Each technique reveals unique characteristics of a signal and hence all these three techniques are essential to get complete information about the signal. In the present work, these three analysis techniques are used to estimate various signal parameters and characterize the response signals monitored during vibration tests on the satellites. Considering the fact that the efficiency of compression techniques depends on the characteristics of the data being compressed, characterization results will be used to choose a suitable approach to compress the satellite vibration test data.
Keywords: Signal Characterization, Satellite Vibration Test Data, Signal Magnitude Analysis, Time Domain Analysis, Frequency Domain Analysis, Vibration Signal, Random Signal, Sine Signal, Shock Signal, Vibration Data Size
Cite this paper: B R Nagendra, A M Khan, V Ramesh Naidu, S N Prakash, N K Misra, Characterization of Vibration Test Data of Satellites, American Journal of Signal Processing, Vol. 3 No. 2, 2013, pp. 35-40. doi: 10.5923/j.ajsp.20130302.03.
Article Outline
1. Introduction
- Satellites and its subsystems are subjected to various environmental tests such as vibration tests, shock tests, thermo vacuum tests and acoustic tests etc. as part of design validation, qualification and flight acceptance requirements. These systems are designed with optimum design margins. Vibration testing is one of the important environmental tests being carried out on aerospace system elements.Vibration and shock tests are carried out on satellites and its subsystems to ensure that they sustain the vibration and shock loads that are experienced during their life. Most severe vibration loads are observed during launch of the satellite cycle. Satellite or the subsystems to be tested is mounted on an electro-dynamic shaker using a suitable fixture. Vibration controller generates the required vibration signal for the test. This vibration signal is applied to electro-dynamic shaker through power amplifier and the shaker vibrates in accordance with the signal applied to it. In this way the satellite or the subsystem is subjected to the required vibration level. Various vibration tests carried out on satellites are categorized as random tests, swept sine tests and shock tests. When such a large specimen is being tested, it is essential to monitor the vibration levels at different locations of the specimen using accelerometers or any other transducers, as in[2]. During the vibration test on a satellite, to understand the behaviour of the satellite and compare the test results with the design data, as in[5], few hundreds of responses are monitored depending on the size and complexity of the satellite being tested. The data corresponding to the vibration responses at various locations of a large test specimen is acquired by specially designed high speed dynamic parameter data acquisition systems, as in[15]. Considering the sampling rate of about 50 K samples/sec, a recording duration of about 5 minutes per test, and 4-byte representation for storing the data, the storage requirement will be about 15 GB per test. Typically, 15 tests are conducted on a satellite and with 4 satellite tests per year; about 900 GB of data per year is generated during these vibration tests at vibration laboratory of a typical space organization. Apart from this, vibration test data of different subsystems of various on-going satellite projects are conducted and the data of these tests are to be stored. Hence, a minimum of about 3 TB of data is generated every year, which has to be archived for analysis and for future reference. This post-processing of the archived data, encounters two challenges. Firstly, space required to store vibration test data is very high of the order of hundreds of Terra bytes per year. Another challenge is that time required to access the large amount of test data from the data server over intranet is very high and possess practical difficulties. Hence, there is a need to use a suitable compression algorithm for efficient archival and post-processing of the data, as in[7]. The compression algorithm to be designed for this purpose should support the reconstruction of original signal with minimal error that corresponds to about 0.1 mg, which is acceptable in the field of vibration testing of satellites. Such a compression algorithm should make use of the unique characteristics of the vibration test data for improved efficiency. Post-processing of data involves identifying various frequency components in the data and their amplitudes, in order to qualify the satellite for its capability to sustain expected vibration loads during its launch. Frequency components in the data can be extracted by applying any of the transformation technique, depending on the type of data, as in[6].Vibration test data has to be characterized and properly understood to choose a suitable algorithm from the existing array of compression techniques or to develop a new algorithm for efficient compression of the vibration test data. The present work focuses on characterizing the vibration data to identify the unique features in the data. Vibration test data of a typical satellite is considered in the present study. Characterization of the data representing a vibration signal includes analysis techniques such as signal magnitude analysis, time domain analysis and frequency domain analysis. Signal magnitude analysis and time domain analysis provides basic information about the signal such as statistical parameters, as in[3, 8], whereas frequency domain analysis provides the detailed information about the signal including frequency components present in the signal.Signal magnitude analysis involves estimation of magnitude related parameters such as peak value, extreme value, range, mean value, mean square value, root mean square value, variance, standard deviation, skewness, kurtosis, probability density functions and probability distribution functions of the signals. Time domain analysis involves analysis of autocorrelation, covariance, normalized correlation, cross correlation, distortion in the signal waveform and time record averaging. Frequency domain analysis involves estimating the parameters such as power spectral density, cross spectral density, energy spectral density and root mean square value of these density functions.
2. Description of Parameters
- Different signal characterization parameters of satellite vibration test data are studied, as part of this work. The parameters chosen are based on their relevance to the objective of the present work. The significance of these parameters is explained in the following paragraphs.
2.1. Parameters for Signal Magnitude Analysis
- Peak value is the value that corresponds to maximum acceleration level that the specimen has undergone during the vibration test. Extreme values are used to decide on DC level shifting, if required, during compression of the data. A measure of central tendency is a mean value or average value, which is very essential and an important summary measure in statistical analysis. Mean square value provides information about energy content in the signal. Standard deviation gives a numerical value to the clustering tendency of the data. A large standard deviation is an indication that the vibration data values are widely distributed, with some relatively extreme values possibly observed. If the standard deviation is small, the vibration data points will be more closely clustered around the center of the data. Skewness of a data set refers to asymmetry in the vibration test data. It indicates the noise content in the data, as in[1]. The skewness of a data set is defined as given in the equation (1):
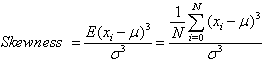 | (1) |
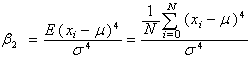 | (2) |
2.2. Parameters for Time Domain Analysis
- Auto-correlation function, Rxx(τ) provide a measure of the degree of correlation of signals with themselves as a function of time displacement (τ). Auto-correlation function can be used to identify pulses in signals and their associated time delays, and to detect any sinusoidal components that might be submerged in a random noise signal. For periodic signals, Rxx(τ) is always periodic, and for random signals it always decays to zero for large values of τ. It is therefore a useful tool for identifying deterministic signals in the vibration data, which would otherwise be masked in a random background. Auto-correlation function, Rxx(τ) is given by the equation (3)
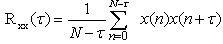 | (3) |
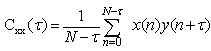 | (4) |
2.3. Parameters for Frequency Domain Analysis
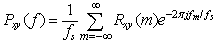
- The Fourier transform is one of several mathematical tools that is useful in the analysis and design of Linear Time Invariant systems. The signal representation by Fourier transforms basically involves the decomposition of the signals in terms of sinusoidal components. With such decomposition, a signal is said to be represented in the frequency domain. Frequency domain analysis of the satellite vibration test data can be carried out by applying the appropriate transformation such as Fourier transform, wavelet transform, Hilbert transform, etc, as in[12, 13, 14]. Frequency domain analysis is an important tool to identify and eliminate noise present in the vibration data, as in[9, 11]. Power spectral density (PSD) function shows the strength of the signal variations as a function of frequency. PSD is a very useful tool if we want to identify and get the amplitude of oscillatory signals in the time series data. The PSD function describes the nature of distribution of power with frequency in a signal. Estimation of power spectra is useful in a variety of applications, including the detection of signals buried in wide-band noise. Power Spectral Density (Pxx(f)) of a data set can be computed using correlation method or Fast Fourier Transform (FFT) method. Using correlation method, power spectral density can be computed using the equation (5).
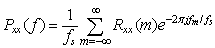 | (5) |
 | (6) |
3. Experimental Results
- Data acquired during different vibration tests viz. random, swept sine and shock tests are analysed in the present work. There are various data acquisition systems specially designed and developed for acquisition and processing of vibration test data, as in[4]. Vibration data acquisition system used in the present study is capable of acquiring data of about 250 responses with the sampling rate of 50 KHz for each response. The raw time domain data acquired during the vibration test by this data acquisition system is stored in the throughput disks. This raw time domain data is available for storage and archival in MATLAB binary format. The present work uses this data for carrying out analysis of satellite test vibration data. Random test data contains samples of a stationary random signal, whose statistical parameters do not vary with time. Swept sine test data represents a periodic signal that starts from initial frequency and sweeps till the final frequency, and its amplitude varies as per the response at the monitored location. Shock test data contains samples that contain high frequency transient responses of the monitored location during a shock test. At any instant of the signal, random data has all the frequency components from initial test frequency to the final test frequency, sine data has only one frequency component, and shock also has many frequency components. Hence, each data set is unique by itself and the analysis is carried out independently, on all three sets of data.The plots of original time domain data of random, sine and shock test data are shown in Figure 1. Table 1 shows comparison of values of all parameters of these three different data sets.
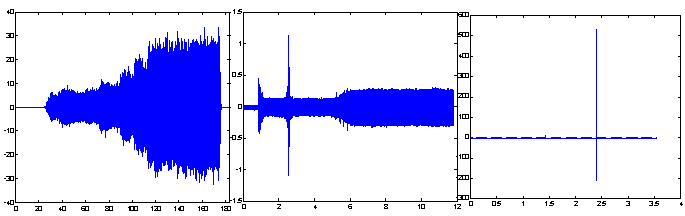 | Figure 1. Amplitude in g Vs samples plot of random, sine and shock test data in time domain acquired in a data acquisition system |
|
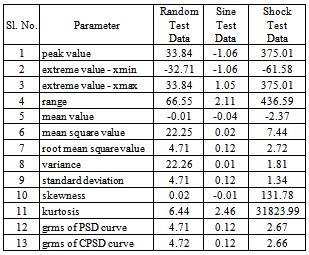
4. Observations
- The characterization of satellite vibration test data provides a wealth of information about the data. It indicates nature of the data, dispersions, variations, distributions, power densities, energy content, frequency components, correlations, etc. From the experimental results, following observations are made about satellite vibration test data.● The range of values for random test data is one order above that of sine test data and is one order below that of shock test data. ● The mean of the data values indicates that sine and random data is almost symmetrical about ‘zero’ and it is not so in the case of shock data.● Root mean square values indicate that the degree of variation is high in the case of random data and is low in case of sine data, compared to that of shock test data. ● The dispersion of data values about the mean, indicated by standard deviation is high in case of random and low in case of sine data, compared to that of shock test data. ● The skewness values indicate that random and sine test data are evenly distributed on both sides of the mean. But, shock test data has very high skewness value indicating that most of the values lie to the right of the mean.● Shock test data has the transient behaviour because of its nature and hence has very high value of kurtosis, where as random and sine test data have nominal values of kurtosis.● Frequency distribution(as shown in Figure 2), PDF and CDF plots of random, sinusoidal and shock test data indicates that majority of the values lie in the vicinity of zero. This is due to the fact that though the test duration of random and sinusoidal test is one or two minutes and few milliseconds in case of shock test, data acquisition is done before the start of test and continues after the completion of test. Hence significant number of samples represents noise which has the value about zero.● Periodicity is observed in autocorrelation function of sine data where as the autocorrelation is high and decreases exponentially in case of random and shock test data.● Cross correlation plots indicate that there is negligible correlation amongst different response monitoring locations for all three data sets.● Least distortion is observed in all the data and is as expected because instrumentation used in acquiring data has very high noise performance. As averaging is carried out, the peaks in the signal smoothens which is observed in all the data sets. As the number of samples of averaging increases smoothness in the signal also increases.● Power spectral density plots and RMS values shows that the strength of the signal variations as a function of frequency i.e. they indicate the frequencies at which the variations are strong and frequencies at which the variations are weak. It is observed that random data has very high energy and is uniformly distributed throughout the frequency spectrum compared to that of sine and shock test data.
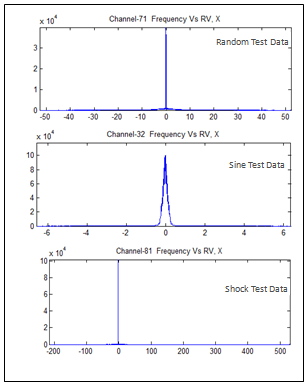 | Figure 2. Frequency distribution plots of vibration test data |
5. Inferences
- From the observations made in the previous section, following inferences are made.● The characteristics of each test data are unique. It is proposed to look for suitable algorithm for compression of each of these data sets independently. ● It is also proposed to discard the data samples that are stored before actual start of the test and after the end of test, as they do not carry any information about the test. This will improve the efficiency of the compression algorithms to a large extent.● The normal distribution of the sine and random test data as indicated by plots of the original data suggests that the transformation to be used in compression algorithm must be suitable for normally distributed data.● Plots of autocorrelation function reveal the periodicity hidden in the sine test data, and hence Fourier transform based compression algorithm is more suitable for this data set. Shock data is a transient and the efficient compression can be obtained by adopting wavelet based compression algorithms. High energy content of random test data indicates that the use transformations such as DCT should be considered while developing the efficient compression algorithm.● As each of the three data sets has unique characteristics, it is also proposed to incorporate algorithms such as using Karhunen–Loeve transform which results in development of data based compression techniques.
6. Conclusions
- From the observations and inferences made from characterization of all three sets of data, it can be concluded that the random test data, sine test data and shock test data have unique characteristics. These unique characteristics are to be utilized while developing an efficient compression algorithm. Therefore, it is essential to develop a suitable algorithm for compression of each these data sets independently. It is also proposed to discard the data samples that are stored before actual start of the test and after the end of test, as they do not carry any information about the test. This will improve the efficiency of the compression algorithms to a large extent.
ACKNOWLEDGEMENTS
- Authors wish to acknowledge A R Prashant and M Madheswaran of Vibration Laboratory, ISRO Satellite Centre, Bangalore, India, for the support given to carry out the present study.