Moein Ahmadi , Kamal Mohamedpour
Electrical Engineering Faculty, K.N. Toosi University of Technology, Tehran, 14191-14317, Iran
Correspondence to: Moein Ahmadi , Electrical Engineering Faculty, K.N. Toosi University of Technology, Tehran, 14191-14317, Iran.
| Email: |  |
Copyright © 2012 Scientific & Academic Publishing. All Rights Reserved.
Abstract
In a dense modern electronic warfare environment, there are a lot of radar signals. Pulse repetition intervals of signals received from radars can have various modulations and levels. It is very important to recognize these modulations and to determine their levels in electronic warfare support systems. In this paper, a new method of recognizing PRI modulation type and its levels is proposed for ESM systems. The proposed method is based not only on the properties of the biased autocorrelation function of the PRI sequences but also on the development of a hierarchical clustering method for both classifying PRI modulation types and clustering the PRI levels. This new method is also capable of working in a situation that lost and spurious pulses exist. The performance of the proposed method has also been evaluated in a simulation scenario.
Keywords:
Biased Autocorrelation Function, Electronic Support Measures, Pulse Repetition Interval
Cite this paper:
Moein Ahmadi , Kamal Mohamedpour , "PRl Modulation Type Recognition Using Level Clustering and Autocorrelation", American Journal of Signal Processing, Vol. 2 No. 5, 2012, pp. 83-91. doi: 10.5923/j.ajsp.20120205.01.
1. Introduction
An electronic support measures (ESM) system receives signals from many radar sources with various parameters. A pulsed-radar system uses specified parameters to transmit its signal. measured parameters include time of arrival (TOA), pulse width (PW), radio frequency (RF), pulse amplitude (PA) and angle of arrival (AOA). As the radars are developing, they use more complicated pulse repetition interval (PRI) modulations to have multiple purposes and to hide from ESM systems. Therefore, it is important to develop the ESM systems which have duty of recognizing active radars in the environment. By using PRI modulation recognition in ESM systems, the process of recognizing the radars can be developed.Common types of PRI modulation are constant, jittered, staggered, sliding, wobulated and DS (Dwell and Switch). In conventional methods, constant and staggered PRI modulations are recognized in pulse de-interleaving process [2]. But the other PRI modulation types are reported as complicated modulation types or classified as noise [5, 6]. In [1] it is assumed that constant and staggered PRI modulation types are extracted in pulse de-interleaving process by CDIF or SDIF methods [3, 8], then complicated PRI modulation types are recognized by autocorrelation function properties. In this paper the de-interleaving is processed by clustering the RF, AOA and PW and merging PA pulse parameters. Then TOAs of each cluster are usedto recognize the PRI modulation type and determine the PRI levels.In this paper, the mathematical definitions of PRI modulation types and their specifications are presented. Then a hierarchical clustering method is introduced to determine the PRI levels. Next, in section 4, the procedure of PRI modulation recognition is proposed. To show the performance of the presented method, it has been evaluated in a simulation scenario in section 5.
2. Radar Identification
2.1. Parameters of Radar Pulses and de-interleaving Procedure
In Figure 1, a signal emitted by a pulsed-radar is illustrated. Pulse deinterleaving procedure used in this paper includes three clustering steps and one merging step. This procedure is shown in Figure 2.The first step of deinterleaving procedure is radio frequency clustering. Because the measurement of RF is often highly accurate, RF has an important role in deinterleaving procedure and is used in the first step of clustering. Although the pulses angle of arrival is measured approximately with 10° accuracy which is not very high, AOA clustering is used after RF clustering step in deinterleaving procedure, because this parameter is only dependent on the position of radar and cannot be affected by electronic counter-countermeasure activities.After RF clustering step, the received signals from a pulsed-radar are clustered according to their pulse width parameter. The PW clustering is used in the final clustering step of pulse de-interleaving procedure because PW values are measured with difficulty and multipath phenomenon affects their accuracy. | Figure 1. Parameters of pulse radar’s signal |
 | Figure 2. ESM data processing block diagram. Blocks that are used in de-interleaving process indicated with large block |
Pulse amplitude variations are nonlinear and it is not common to use PA values in clustering steps; however, in this paper, these values are used for merging wrongly clustered pulses. Because three steps of clustering cause highly deinterleaved pulses, in the final step of the de-interleaving procedure, PA and TOA values are employed to merge the wrong clusters of AOA, RF and PW.
2.2. Signal Model for Time of Arrival
The TOA measurements are made at the ESM receiver by detecting the time at which the pulse crosses a threshold. The TOA sequence for a pulse train with N+1 pulse may be written as the following:  | (1) |
where  are samples of zero mean white Gaussian noise with unit variance and
  is additive noise variance. The ideal TOA sequence,
  , for a simple pulse train with constant intervals is described as the following:
 | (2) |
Where T is the interval between pulses of ideal pulse train and  is the time between the first received pulse and the first pulse of the ideal pulse train. The minimum squared error can be used to estimate the interval. The square error is:
  | (3) |
Differentiate  with respect to T and
 , and set the results equal to zero:
  | (4) |
Solving the equation to find T, the estimated PRI level, results in:  | (5) |
In Figure 3, the minimum square estimation error is compared with the error of estimation:  , which is a simple mean of PRI sequence.As shown in Figure 3, the estimation of (5) is more accurate than the mean estimation and the proportion of minimum square estimation errors per mean PRI estimations increases when the number of pulses increases.Radar changes the interval between its pulses to have many applications. PRI sequence can be defined as the following:
 | (6) |
Substitute (1) into (6) results: | (7) |
where  is the interval between nth pulse and (n-1)th pulse in ideal pulse train and
  are samples of zero mean colored Gaussian noise with variance equals to 2.As mentioned,
  are samples of zero mean white Gaussian noise with unit variance and its biased autocorrelation function is a delta function.
  | (8) |
 | Figure 3. Proportion of MSE error per mean error with respect to variance of noise and number of pulses |
Biased autocorrelation function of  sequence is defined as the following:
 | (9) |
where  is the mean of the
  sequence. The biased autocorrelation function is an even function and assumed that
  is sufficient.The biased autocorrelation function of PRI sequence additive noise is derived as the following:
  | (10) |
In addition to additive noise, the PRI sequence has two nonlinear noises which are caused by lost and spurious pulses.
2.3. Lost Pulses
There are many reasons which are caused lost pulses. Pulses from independent sources could arrive simultaneously and caused only first pulse detected. Spatial radar antenna scanning, low level received power and pulse de-interleaving process also can cause lost pulses.In an assumed PRI sequence,  , if the ith to (i+k)th pulses,
  , have been lost, the new PRI sequence,
  , has been created:
  | (11) |
If there is no lost pulses then  . This procedure is shown in Figure 4.If there are L lost pulses groups, the final PRI sequence will be:
 | (12) |
where | (13) |
and  is the PRI sequence which is created by the first lost pulses group. (11) shows that losing pulses makes PRI levels which are linear combination of real PRI levels. In PRI modulation type recognition procedure, this fact is used to compensate the lost pulses effect.
 | Figure 4. New PRI sequence with lost pulses ( i=3, k=2) |
2.4. Spurious Pulses
A common reason for the presence of spurious pulses is the multipath phenomenon. Multipath happens when a transmitted pulse arrives at the receiver from two or more different propagation paths [4]. Due to the difference in the path lengths, the arrival times differ but these pulses commonly are near to first received pulse. The other major reason that causes spurious pulses is the false alarms which noise transcends decision threshold.If k pulses are attached to ith pulse of PRI sequence,  , the new PRI sequence,
  , has been created as the following:
  | (14) |
where  is the interval between the last spurious pulse of ith pulse and next real pulse.
  sequence is dependent on spurious pulses distribution. In this work uniform distribution between 0 and
  is assumed for this sequence. Spurious pulses are shown in Figure 5.If there are spurious pulses in S real pulse, the final PRI sequence may be written as the following:
  | (15) |
where | (16) |
and  is the PRI sequence which is created by first spurious pulses group.Pulse radars use various pulse repetition interval patterns for different situations [2]. These patterns are known as PRI modulation types. Figure 6 illustrates the constant, jittered, staggered, sliding, wobulated and DS PRI modulations. Each of this modulation types have different application [4]. To recognize PRI modulation types, we firstly describe the mathematical definitions of them.
 | Figure 5. New PRI sequence with spurious pulses ( i=1, k=3) |
2.5. Mathematical Models for PRI Modulation Types
As seen in Figure 6, constant PRI modulation is the simplest PRI modulation type. Pulses are repeated with constant interval, T, in this modulation. Times of arrival sequence and PRI sequence of constant PRI modulation is described as the following:  | (17) |
where T is the constant interval and { } are samples of zero mean colored Gaussian noise with variance equals to 2. The minimum and maximum values of interval for constant modulation are about 10 microseconds and 5 milliseconds. The standard variation,
  , is often less than one percent of T. The PRI sequence biased autocorrelation function for this PRI modulation for
  is calculated as the following:
  | (18) |
In jittered PRI modulation, random TOA variations of pulses are limited in a distinct interval.  | (19) |
where J is the jitter value which is created in the transmitter radar to avoid the hostile jamming and its maximum value is about 0.3T.Biased autocorrelation function of the jittered PRI sequence for  is calculated as the following:
  | (20) |
Staggered PRI modulation has M PRI levels,  , where common values for M are between 2 to 8 levels. PRI sequence and its biased autocorrelation function for this modulation is written as the following:
  | (21) |
 | (22) |
where  | (23) |
In sliding PRI modulation, PRI levels are monotonically vary from a level to another level. | (24) |
 | Figure 6. PRI modulation types |
 | Figure 7. Biased autocorrelation functions of PRI modulation types |
In this modulation, PRI levels start from  and increase
  in each pulse. Biased autocorrelation function of sliding PRI modulation is calculated as the following:
  | (25) |
where | (26) |
and | (27) |
Another PRI modulation type is wobulated PRI modulation. Sinusoidal variations of its PRI sequence have amplitude about 5 percent of mean PRI and frequency about 50 Hz [2]. Wobulated PRI sequence can be written as the following:  | (28) |
where  is the modulation frequency and
  is the initial phase of modulation. The biased autocorrelation function of wobulated PRI sequence can be calculated as the following:
  | (29) |
If it is assumed that  is a uniform random variable between 0 and 2π, the (29) can be summarized as the following:
  | (30) |
DS PRI modulation has M PRI levels, each level,  , repeats
  times.
 | (31) |
Where  is the least integer number that validates the (32).
  | (32) |
It can be proved that the biased autocorrelation function of noiseless DS PRI sequence is a piecewise linear (PWL) function with different slopes. The first point that slope varies is in , and the slope variation points are selected from {
 } set, where D is a subset of {0,1,2,…,M-1} which has j numbers (j=1,2,…,M). In Figure 7, the biased autocorrelation functions of the PRI sequences which are shown in Figure 6 are illustrated. In the following section, a method for PRI level clustering is presented.
3. PRI Level Clustering
Finding the PRI levels of radars is very important in radar identification. In this section a hierarchical clustering method [9] is developed for PRI levels clustering. Also, this method is used in PRI modulation recognition.First, distances sequence, D, and indices sequence, I, are created using PRI sequence. | (33) |
In other words,  is the index of nearest last PRIs to
 . PRI Clustering is based on distances sequence, D. The set of cluster representatives, E, is calculated as the following:
  | (34) |
where a is arbitrary value. Choosing low values for a causes to have more clusters number and less clusters scattering.PRI sequence clustering can be completed when clusters representatives are determined. The ith element of PRI sequence, pi belongs to a cluster such that the distance between the cluster representative and pi would be the minimum value among all clusters.This hierarchical clustering method leads to have L clusters such that each cluster with li (i=1, 2,…, L) members, can be described as a matrix,  , as the following:
  | (35) |
where  is ascended sorted indices set for ith cluster and C is the set of all clusters.Using (5), PRI value of ith cluster can be estimated. To apply (5), it is necessary to obtain all TOAs which construct the ith cluster PRIs.
  | (36) |
Consequently | (37) |
 is the number of x set members.Another estimation for mean PRI value of ith cluster,
  , can be written as the following:
  | (38) |
(38) is the simple estimation and has less computational complexity then (37), but (37) is more accurate estimation as shown in Figure 3.
4. Recognition of PRI Modulation Types
PRI modulation types can be recognized by using classifiers. In this paper, we use classifiers which are based on not only properties of biased autocorrelation function of PRI sequence, but also the number of PRI sequence clusters.PRI variations of constant PRI modulation are very low in comparison with the other PRI modulation types. The biased autocorrelation value at k=0 determines the amount of variations. Therefore we define type classifier, cf1 to distinguish the constant PRI from the other types as the following:  | (39) |
The number of PRI clusters can be used in type classifying procedure. If the clustering arbitrary value,  , set to 0.01 to 0.02, we have often one PRI cluster for constant, jittered, sliding and wobulated PRI modulations which have very low distances between actual PRI levels. PRI sequence clustering of staggered and DS PRI modulations leads to have clusters number equal to actual PRI level number. Therefore the second classifier, cf2 defined as the following:
  | (40) |
Among the jittered, sliding and wobulated PRI modulations, the difference of biased autocorrelation values at k=0 and k=1 is greater for jittered PRI modulation. Among the staggered and D&S PRI modulations, this difference value is rather greater for staggered PRI modulation. Consequently we define the third classifier as the following:  | (41) |
At last we define type classifier, cf4 to discriminate between the sliding PRI modulation and the wobulated PRI modulation as the following:  | (42) |
In (42),  denotes the index corresponding the largest
  peak after k=0. If there is no peak in
  ,
,  . In a special case that
 , where n is an integer that is greater than 2, cf4 can be calculated as the following:
  | (43) |
Accordingly, cf4 of the wobulated PRI modulation is relatively less than that of the sliding PRI modulation.The key procedure to recognize the PRI modulation type of a radar pulse signal is shown in Figure 8.Proposed classifiers are calculated for ideal PRI sequences. In real signals, spurious and lost pulses cause changes in biased autocorrelation function properties. In applying the proposed method to the real signals, the preprocessing before calculating the biased autocorrelation function is needed to reduce the effect of lost and spurious pulses. Firstly, we compensate the spurious pulses effects eliminating the pulses which cause to have low PRI values. Then to compensate the lost pulses, noting (11), we can eliminate the PRI levels which are the linear combination of other PRI levels. Also we can eliminate PRI levels that have very large value.After compensating the lost and spurious pulses effects, the biased autocorrelation function of PRI sequence, C(k) is calculated. PRI sequence is clustered for both using in classifier cf2 and calculating the PRI levels values. After classifying the PRI sequence, the recognized PRI modulation type is verified to avoid recognizing noise data as a PRI Modulation type and to be sure that the algorithm results are correct.According to (35), the PRI sequence is divided to L clusters. The PRI sequence of ith cluster is written as the following: | (44) |
For all PRI modulation types except Staggered PRI, sequence have values equal to  . In the staggered PRI case, this sequence values are
  . Therefore, the constant, jittered, sliding, wobulated and DS PRI modulation types can be verified using the (45).
  | (45) |
The staggered PRI modulation is verified using the following equation: | (46) |
where  is the unit step function, and
  and
and  are the values that are compared to the values of
  and
and  respectively, to be used to verify the recognized PRI modulation type.As mentioned in previous section, the biased autocorrelation function of DS PRI sequence is a piecewise linear (PWL) function with different slopes. DS PRI modulation can be verified using the following equation:
  | (47) |
 is the value that is compared to the values of “(C(k+1)-2C(k)+C(k-1))/C(0))” at k for the DS PRI sequence, to be used to verify the recognized DS PRI modulation.In staggered, sliding, wobulated and DS PRI modulation types, the modulation pattern repeated in every several pulses. When the classified modulation type is one of these PRI modulation types, the PRI modulation period can be estimated as the following:
  | (48) |
5. Simulation Results
Simulation experiments were performed to show the performance of the proposed method. Simulation scenario consists of an electronic warfare environment which has fifteen active radars that transmit signals with various parameters. The parameters of these radars are shown in table 1. Radars often rotate their antenna beams to scan their environments; hence the ESM system receives the signals of these radars for a little time. The sixth column of table 1 which is entitled by “Illumination Time / 1Sec” shows the average of this time.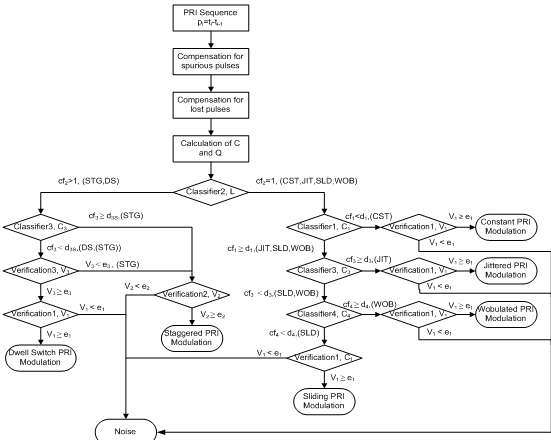 | Figure 8. Procedure of the proposed method for the recognition of the PRI modulation types |
| Table 1. The radar parameters of simulation scenario |
| | Emitter No. | AOA (Degree) | PW (usec) | RF(MHz) | RF Mode | Illumination Time / 1Sec | PRI(usec) | PRI Modulation | Pulse Number | Lost pulses (%) | Spurious pulses (%) | | 1 | 46.0 | 1.6 | 700 | CST | 50 msec | 900 | STG-3 | 160 | 5 | 15 | | 2 | 47.5 | 8.3 | 1450 | JIT | 27 msec | 3000 | CST | 27 | 10 | 10 | | 3 | 45.8 | 12 | 2650 | JIT | 65 msec | 1000 | SLD | 195 | 2 | 5 | | 4 | 49.8 | 34 | 4000 | DS | 120 msec | 350 | DS-4 | 1030 | 15 | 10 | | 5 | 65.8 | 5.8 | 2000 | CST | 1000 msec | 900 | WOB | 3330 | 5 | 5 | | 6 | 65.5 | 49 | 3000 | JIT | 45 msec | 800 | CST | 170 | 10 | 10 | | 7 | 66.3 | 27 | 4500 | CST | 60 msec | 140 | JIT | 1300 | 15 | 15 | | 8 | 132 | 63 | 2300 | CST | 80 msec | 650 | SLD | 370 | 10 | 15 | | 9 | 131 | 47 | 7000 | DS | 65 msec | 2400 | CST | 80 | 10 | 15 | | 10 | 116 | 32 | 6500 | JIT | 170 msec | 100 | JIT | 5100 | 15 | 20 | | 11 | 166 | 51 | 3300 | CST | 50 msec | 400 | STG-5 | 375 | 5 | 5 | | 12 | 54 | 35 | 2900 | CST | 140 msec | 1200 | STG-8 | 350 | 5 | 10 | | 13 | 245 | 2.1 | 14000 | DS | 75 msec | 75 | DS-7 | 3000 | 10 | 10 | | 14 | 267 | 0.5 | 9500 | DS | 60 msec | 4 | JIT | 45000 | 5 | 15 | | 15 | 323 | 1 | 9500 | JIT | 35 msec | 25 | DS-2 | 4200 | 10 | 10 |
|
|
Simulated signals have maximum PRI variations equal to thirty percent of their mean PRI. Seventh table column shows the mean PRI of radars and next column shows the PRI modulation type abbreviations with their number of PRI levels.The  in the PRI sequence clustering and the
 ,
, and
and  in the V1, V2 and V3 verifiers and the threshold values for the decision of the type classifiers and verifiers are
  ,
,  ,
, 
 ,
,  ,
,  and
and  . It can be proved that the optimum threshold value of Cf4 is
 .The proposed PRI modulation type recognition has been tested using the scenario which shown in table 1. All radars have been recognized despite the lost and spurious pulses exist.
6. Conclusions
In modern electronic warfare environments, information on PRI modulation type and PRI values is very important for ESM systems to improve the probability of identification of a radar signal and to track a pulse train precisely for electronic attack. In this paper, a model for times of arrival and PRI sequences and their noise has been proposed. MSE estimation and average estimation of PRI level have been compared. Biased autocorrelation function of PRI sequence for PRI modulation types has been calculated and a hierarchical clustering method has been proposed to cluster the PRI levels. Based on the characteristics of biased autocorrelation function for PRI sequences and also PRI sequence clustering, a procedure for PRI modulation type recognition has been proposed. Simulation results show that the proposed method is very useful for radar signal processing and emitter identification in ESM systems.
References
| [1] | Y. Ryoo and K. Song, “Recognition of PRI Modulation Types of Radar Signals Using the Autocorrelation,” IEICE Transactions on Communications, 2007. |
| [2] | R. Wiley, ELINT: The Interception and Analysis of Radar Signals. Artech House, 2006. |
| [3] | H. Mardia, “New techniques for the deinterleaving of repetitive sequences,” IEE proc. F, Communication, Radar and Signal Processing, Vol. 136, No. 4, pp. 149-154, 1989. |
| [4] | D.J. Milojevic and B.M. Propovic, “Improved algorithm for the deinterleaving of radar pulses,” IEE proc. F, Communication, Radar and Signal Processing, Vol. 139, No. 1, pp. 98-104, 1992. |
| [5] | G.P. Noone, “A neural approach to automatic pulse repetition interval modulation recognition,” Proc. Information, Decision and Control, IEEE, pp. 213-218, 1999. |
| [6] | G.P. Noone, “A neural approach to tracking radar pulse repetition interval modulations,” Proc. Neural Information Processing, IEEE, Vol. 3, pp. 1075-1080, 1999. |
| [7] | D.E Driscoll and S.D. Howard, “The detection of radar pulse sequences by means of a continuous wavelet transform,” ICASSP’99 proceeding, Vol. 3, pp. 1389-1392, 1999. |
| [8] | Y. Kuang and Q. Shi, “A Simple Way to Deinterleave Repetitive Pulse Sequences,” 7th WSEAS Int. Conf. on Mathematical Methods and Computational Techniques in Electrical Engineering, Sofia, pp. 218-222, 2005. |
| [9] | W. Koontz and P. Narendra and K. Fukunaga, “A Graph-Theoretic Approach to Nonparametric Cluster Analysis,” IEEE Transactions on Computers, Vol. 25, No. 9, pp. 936-944, 1976. |
 Abstract
 Reference
 Full-Text PDF
 Full-Text HTML