Faten Katlane , Mohamed Saber Naceur
National School of Engineers of Tunis, Laboratory of Remote Sensing and Information Systems for spatial reference BP37, Tunis le belvedere, 1002, Tunisia
Correspondence to: Faten Katlane , National School of Engineers of Tunis, Laboratory of Remote Sensing and Information Systems for spatial reference BP37, Tunis le belvedere, 1002, Tunisia.
| Email: |  |
Copyright © 2012 Scientific & Academic Publishing. All Rights Reserved.
Abstract
Interest is growing in the numerous methods of automatically detecting change in satellite imagery, especially due to the many ways they can be applied to analyze the Earth’s surface or the environment (monitoring vegetation, updating maps, risk management, etc.). However, change detection using fusion images based on an a contrario approach is a new method introduced by[5]. The main objective of this study is to introduce a process for using fusion of change indicators based on a contrario modeling. The first aim of this study is to show that change exists between different bandwidths raw of the same source image and that the rate of change remains practically the same from one source image to another. The second objective is to determine a rate of change between multi-temporal images.
Keywords:
Change Detection, Change Indicators, A Contrario Fusion, Multi-Temporal Images
1. Introduction
Numerous methods of detecting change have been used, notably by[1] and[2]. And this methods were classified by[3] according to their intervention levels, we find (i) at the pixel level, analysis by change vectors, simple detectors and regression, (ii) at the characteristic level, analysis by texture, principal components analysis, analysis of shape, vegetation index differencing and wavelets, and finally, (iii) at the object level, methods for direct multi-date classification, post-classification comparison and fuzzy post-classification comparison, artificial intelligence, artificial neuronnetworks and expert systems. Applying the a contrario approach to image processing is based on detecting unexpected structures, in other words, highly unlikely or more exactly, extremely “rare” under the a priori model[4].Thus, “events” can be detected without making any hypotheses about the shape of these events, but simply by testing consistency in contrast with an a priori model (called a naïve model), which justifies qualitative a contrario detection[5]. The main objective of this study is to show that the fusion of change indicators based on a a contrario approach improves change detection. Change indices used by[5] include those of the “absolute differencing”, those of the “absolute differencing of textural parameters” and those of the “information measurements”.Automatic change detection by the fusion of changeindicators depends upon two essential points, namely, analyzing change indicator images and fusionning these images of change indicators at the decision-making level[5]. The algorithm proposed by[5] involves considering that, at each new iteration, a change indicator is selected from the library of change indicators in such a way as to form the image of this indicator. The fusion is done traditionally using Dempster’s rule of combination. The limits of these methods can be found, on one hand,in the difficulty of choosing change indicators and, on the other hand, in the method used to fuse these indicators. The question that must be raised is this: from what thresholds are the changes detected in the images describing texture and differencing images extracted from images sources considered significant? First, a contrario change indicators fusion will bedescribed with the principal aim of showing that change exists between different bandwidths extracted from the same image source. The second objective will be to determine the rate of change between these multi-temporal images. Finally, the results of the change indicator fusion using a contrario modeling will be presented and discussed.
2.Methodology
2.1. Data and Study Area
A set of four multi-date and multispectral images were used in this study. some pretreatments were carried out on the optical images to improve the quality of these images especially those dating from 1987 and 1998 and tominimize the noise transmitted by the sensors. these pretreatments consisted in applying filters and put the images in a geographic reference.Table 1 gives an exact description of the data used: images sources and change indicators images. The study area chosen is located north of Tunis, bordered by a marsh named Sebkhet Ariana on the east and the Lake of Tunis and Tunis-Carthage airport on the southeast, extending to the northwest to the neighborhood of Soukra. This area is characterized by the heterogeneity of the environment, especially due to the presence of the marsh, a more or less high-traffic urban area, a green belt and streets.| Table 1. Description of the data |
| | Description | SPOT1 | SPOT3 | SPOT4 | SPOT5 | | Spectral bandwidth | xs1 : 0.50-0.59 μmxs2 : 0.61-0.68 μmxs3 : 0.78-0.89 μm | xs1 : 0.50-0.59 μmxs2 : 0.61-0.68 μmxs3 : 0.78-0.89 μm | B1 : 0.51-0.59 μmB2 : 0.61-0.68 μmB4 : 1.58-1.75 μm | 0.49-0.69 μm | | Entropic descriptor | X | X | X | X | | Range descriptor | X | X | X | X | | Standard deviation descriptor | X | X | X | X | | Differencing descriptor | X | X | X | X | | Date | 1987 | 1998 | 2000 | 2003 | | Resolution | 10 m | 20m | 20 m | 5 m | | Size in pixels | 256x256 | 256x256 | 256x256 | 1024x1024 |
|
|
The study area chosen is located north of the city of Tunis and bordered by a marsh named Sebkhet Ariana in the east, by the Lake of Tunis and the Tunis-Carthage airport in the southeast, and extending to the neighborhood of Soukra in the northwest. This area is a heterogeneous environment, especially due to the presence of the marsh, and a rather densely populated urban area, with green belt and roads.
2.2. Description of a General Problem of Fusion
Bloch affirmed that the objective of images fusion was principally to improve the three main tasks of detecting, identifying and recognizing shapes[6]. Thus, implementing fusion methods can occur for segmentation, reconstruction and change detection or also for updating information about a phenomenon or scene. 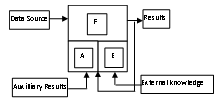 | Figure 1. fusion cell[8] |
Fusion can be a process or a sequence of tasks which must include three fundamental stages[7] extractingcharacteristics, combination and decision-making. Successfully fusion data lies in choosing a strategy (centralized, decentralized, hybrid) in which can be found the information and the type of information to be combined. The fusion process can be shown by the Houzelle general diagram[8] as shown by Figure.1. The fusion cell operates according to black box principle which receives inputs and produces outputs.
2.3. Change Indicators
Mascle proposed improving change detection based on the use of a single change indicator by combining the results of change detection of different indicators[5]. On a single image, regions or groups of pixels are detected whoseobserved measurements are unexpected. Explanation for deviating from the expected measurement, which includes change in land use either due to man-made or natural origins, local modification of environmental factors, etc. called “change qualification” by[5], is generally determined by additional information after the “change detection” .Indicators used in the a contrario fusion process include those indicators deduced from texture descriptors, namely: • local entropy• local standard deviation• local rangeAnd the last indicator was calculated from basic arithmetic operators like applied image differencing, univariate image differencing (UID) where each output pixel contains the absolute value of the difference calculated pixel by pixel[9].
2.4 Principle of the a Contrario Method for Change Indicators Fusion
Extracting change indicators on N sources images makes it possible to generate a set of “change indicator” images. These “change indicator” Mn images are fused after estimating probability images and according to certain decision-making criteria based on -significant thresholds. When the null hypothesis, called H0, is tested, probability can be calculated assuming that this hypothesis is true and that the alternative hypothesis H1 is false. If the event of the “probability of no change” is considered, estimating the probability of change in the a contrario hypothesis is such that:H0: “the probability P of having the measurement at any given pixel less than threshold α.” The probability of obtaining change P(Mn) in a binominal distribution within a series of k trials :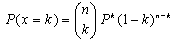 | (1) |
Where 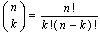 There is practically the same probability, thus one chance in two, for change:
 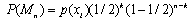 | (2) |
with P: “the probability of having an ng gray level” with ng vareing from[0-255] and xi the ith pixel of Mn images.Where | (3) |
with fng: the frequency of the ng the gray level appearing in the under consideration image.L*L: the size of the image.For a given image, it is considered that a change will occur if P(E/H0)≤α. E(αi,u) = {at least ki pixels of u have a measurement greater than αi }u represents the vector formed by the p values from each change indicator. The rule for fusion consists of choosing .The approach described will make it possible to calculate the rate of false identifications of change (RFC). Thus, for each threshold value, a rate of correct identifications of change was calculated (RCC) and a curve was drawn describing the evolution of the rate of change as a function of the considered thresholds. The last stage consists of deducing a binary mask which results in detecting changes from -significant p-values. Figure 2 provides a description of the approach used to implement the a contrario fusion of change indicators.
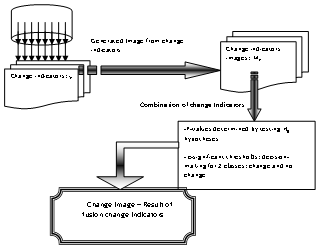 | Figure 2. Diagram of change detection methodology by fusing change indicators based on a contrario approach |
The process of a contrario fusion follows the general structure of fusion. Indeed, modeling is done from each source image Si which supplied information represented by M(n,n).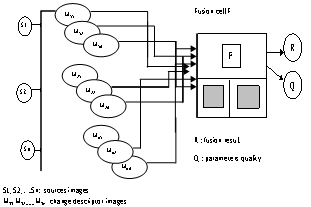 | Figure 3. Structure of the change indicators fusion based on a contrario approach |
Modeling requires an estimation phase done by calculating the p-values associated with M(n,n), followed by the combination stage. Finally, the process ends with decision-making. Figure 3 gives a description of the fusion structure which is centralized.
2.5. Results of Change Detection by a Contrario Fusion Change Indicators
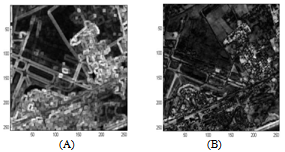
As regards generating change indicator images, those images extracted from images sources concern to: Local entropy of image I at gray level where each output pixel contains the value of entropy in a 9 by 9 window around the corresponding pixel in the input image. Figure 4.A shows an entropy image related to the SPOT1 image dating from 1987. Local standard deviation of image I at gray level, where each output pixel contains the standard deviation calculated in a 3 by 3 window around the corresponding pixel in the input image. Figure 4.B shows a standard deviation image related to the SPOT5 image (2003).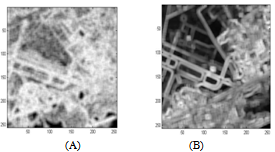 | Figure 4. (A) entropy image for SPOT1 image (1987), (B) standard deviation image for SPOT5 image (2003) |
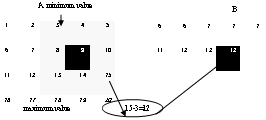 | Figure 5 . Example for calculating the range function |
 | Figure 6. (A) range image for SPOT4 image (2000), (B) differencing image between SPOT1 (1987) and SPOT4 (2000) |
Local range returns the array J, where each output pixel contains the range value (maximum value – minimum value) of the 3-by-3 neighborhood around the corresponding pixel in the input image I. Figure 5 shows how the value of element B (2,4) was calculated from element A (2,4). Figure 6.A shows a range image extracted from the SPOT4 source image dating from 2000. The differencing image described by figure 6.B is calculated from the (images sources) multispectrals images : SPOT1 and SPOT4. Change detection by a contrario fusion of the appropriate indicators was applied, first on multispectrals images with the same temporal resolution, then on multi-temporal images by choosing to combine bandwidths with the greatest amount of information. Applying the fusion algorithm on a single multispectral source image SPOT1 composed of three bandwidths: xs1, xs2 and xs3 dating from 1987 allows the detection of change. Figure 7.D shows the change image calculated for a threshold of 10-3 with a RCC of 19.61%. Thus, calculating the correlation coefficient between the three bandwidths of the source image described in Table 2 shows that there is a strong correlation between bandwidths xs1 and xs2 and that this correlation becomes weaker in the second and third bandwidths.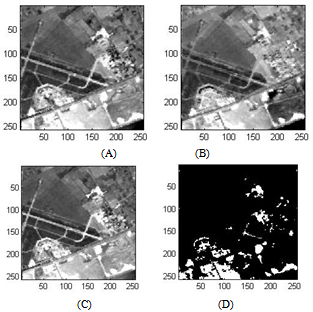 | Figure 7. Change detection by fusioning change indicators for SPOT1 image dating from 1987 (A) bandwidth xs1, (B) bandwidth xs2, (C) bandwidth xs3 and (D) change image |
| Table 2. Bandwidth correlation coefficients of the SPOT1 image |
| | Bandwidths | Xs1 | Xs2 | Xs3 | | Xs1 | 1 | 0.7806 | 0.9115 | | Xs2 | 0.7806 | 1 | 0.6820 | | XS3 | 0.9115 | 0.6820 | 1 |
|
|
Even though it is in the same source image, these bandwidths do not contain the same amount of information. The reflectance emitted by objects on the ground varies according to wavelength. RCC made it possible to highlight useful information and eliminate redundancy between the bandwidths. Applying a contrario fusion of changeindicators on the multispectral source image SPOT3 composed of three bandwidths, xs1, xs2 and xs3 dating from 1998 (Figure 8.A, B and C) give a threshold of 10-3 and a RCC of 15.46% as indicated in Figure 8.D which shows the obtained change image.Table 3 provides the correlation coefficients between the three bandwidths of the SPOT3 image. Bandwidths xs1 and xs2 were observed to be highly correlated, although bandwidths xs2 and xs3 showed a strong decorrelation.| Table 3. Bandwidth correlation coefficients of the SPOT3 image |
| | Bandwidths | Xs1 | Xs2 | Xs3 | | Xs1 | 1 | 0.9859 | -0.122 | | Xs2 | 0.9859 | 1 | -0.00865 | | XS3 | -0.122 | -0.00865 | 1 |
|
|
The algorithm in question was then applied to the multispectral SPOT4 source image dating from 2000 and composed of three bandwidths: B1, B2 and B3 (Figure 9.A, B and C). Figure 9.D shows the obtained change image for a threshold of 10-3 with a RCC of 15.53%.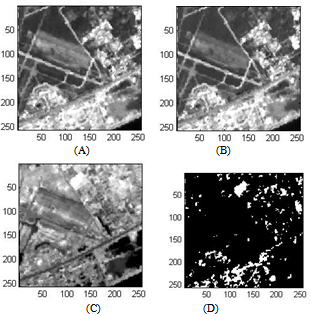 | Figure 8. Change detection by a contrario fusion of change indicators for SPOT3 image dating from 1998 (A) bandwidth xs1, (B) bandwidth xs2, (C) bandwidth xs3 and (D) change image |
The correlation coefficients between the three bandwidths from the SPOT4 image are given in Table 4.| Table 4. Bandwidth correlation coefficients of the SPOT4 image (2000) |
| | Bandwidths | B1 | B2 | B3 | | B1 | 1 | 0.9539 | 0.0333 | | B2 | 0.9539 | 1 | 0.0318 | | B3 | 0.0333 | 0.0318 | 1 |
|
|
Finally, the algorithm for a contrario fusion of change indicators was applied to multi-temporal sources images SPOT1 (bandwidth xs1), SPOT3 (bandwidth xs1), SPOT4 (bandwidth B1) and SPOT5 dating from 1987, 1989, 2000 and 2003, respectively. The choice of sources images was made according to the bandwidths with the maximum of information.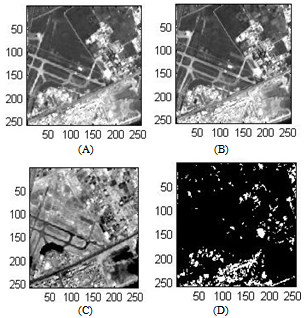 | Figure 9. Change detection by a contrario fusion of change indicators for SPOT4 image dating from 2000 (A) bandwidth B1, (B) bandwidth B2, (C) bandwidth B3 and (D) change image |
Knowing that the change detection algorithm operates by taking different values of threshold, for each threshold value , a RCC is obtained. The study results are summarized by the graph in Figure 10.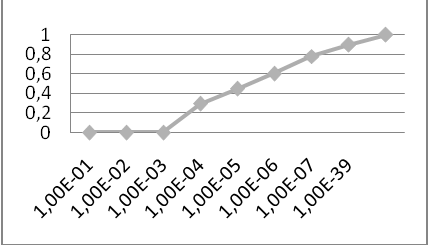 | Figure 10. RCC as a function of threshold |
The lower limit of this algorithm is 10-3 while the upper limit is 10-40. The question addressed in this study was for what -significant threshold value can a valid RCC be obtained, given that the smaller the threshold, the greater the RCC and that from 10-7, 80% change has already been reached. In addition, the study on change detection in relation to multispectrals images from the same sensor shows that, for a threshold of 10-3, changes could be detected since the different bandwidths did not have the same amount of information. The RCC was also nearly constant at 15% for the different bandwidths in a single image source. These analyses led to opting for a threshold of 10-4.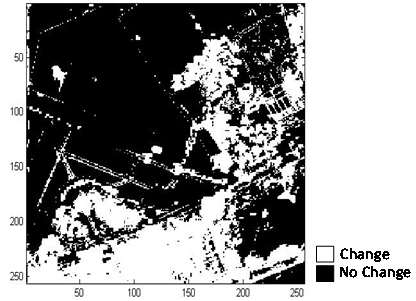 | Figure 11. Change image by a contrario fusion of change indicators |
Figure 11 provides a change image for a threshold of 10-4 with a rate of correct change identification (RCC) of 44.80%. The calculated correlation coefficient between multi-date sources images is given in Table 5 which shows that the correlation decreases with time.| Table 5. Correlation coefficients between SPOT1, SPOT3, SPOT4 and SPOT5 images |
| | Images | 1987 | 1998 | 2000 | 2003 | | 1987 | 1 | 0.5457 | 0.4675 | 0.3845 | | 1998 | 0.5457 | 1 | 0.4979 | 0.4099 | | 2000 | 0.4675 | 0.4979 | 1 | 0.6437 | | 2003 | 0.3845 | 0.4099 | 0.6437 | 1 |
|
|
3. Conclusions
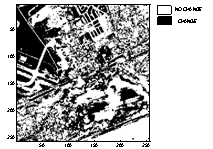
Applying the method of change detection based on a contrario fusion of change indicators between 1987 and 2003 gave a RCC of 44.80%. However, applying a traditional change method such as differencing provided a rate of change of 86.83% (figure.12). Moreover, applying a change detection method based on a contrario differencing,[10] obtained a rate of change of 57.34% as shown by figure 13. 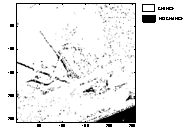 | Figure 12. Map of change relative to the simple differencing (ID) method |
 | Figure 13. Map of change relative to the contrario differencing method [10] |
These rates of change were validated compared to on-site reality for plots of land established between 1987 and 2003, thus stipulating that the region underwent an overall change of 54.98%. Combining change indicators a contrario seems to give good results compared with the traditional method of change detection. Nevertheless, change detection based on a contrario differencing gave the best results. These results are presented in Table 6.Change detection based on a contrario fusion of change indicators made it possible to calculate overall rates of change. A more detailed study would provide rates of change concerning each theme corresponding to specified land use. In addition, further information could be incorporated such as integrating other indicators in the fusion process as well as using classified images to improve the approach used here.| Table 6. Proportion of change when applying algorithms for simple differencing, a contrario differencing, a contrario fusion and a ground truth |
| | Method | Proportion of Change | | Simple differencing | 86.83% | | A contrario differencing | 57.34% | | A contrario fusion | 44.80% | | A ground truth | 54.98% |
|
|
References
| [1] | P. R. Coppin, I. Jonckheere and K. Nachaerts, “Digital change detection in ecosystem monitoring “ a review, Int. J. of Remote Sensing, vol. 24, pp. 1–33 (2003). |
| [2] | D. Lu, P. Mausel, E. Brondizio and E. Moran, 2004.”Change detection techniques”, Int. J. of Remote Sensing, vol. 25, no. 12, pp. 2365–2407 (2004). |
| [3] | Ola Hall , Geoffrey J. Hay, “A Multiscale Object-Specific Approch to Digital Change Detection”, Int. J of applied Earth Observation and Geoinformation, 2003. |
| [4] | A.Desolneux, « Evenements significatifs et applications à l'analyse d'images ». PhD thesis, Ecole Normale Superieure de Cachan, December 2000. |
| [5] | S.Le Hégarat-Mascle, « Classification d’images de télédétection pour l’estimation et le suivi de paramètres géophysiques » ; Habilitation à Diriger des Recherches Spécialité: Traitement des images et télédétection, Université de Versailles Saint Quentin, CETP IPSL, 2005. |
| [6] | I.Bloch et H.Maitre, « Les méthodes de raisonnement dans les images »; Brique VOIR- Module RASIM ; ENST, département TSI, 2004, 299 Pages. |
| [7] | http://perso.telecom-paristech.fr/~bloch/VOIR/poly_voir.pdf |
| [8] | M.S.Naceur, « Fusion de données satellitales pour la cartographie et l’occupation du sol en milieu aride » ; thèse université Nice-Sophia Antipolis, 1999 , 130 pages. |
| [9] | L.Wald, “Data fusion definitions and architectures”, Ecole de Mine de Paris, les presses, 198 pages 2002. |
| [10] | S. Hese and C. Schmullius,” Forest cover change detection in Siberia”, in Proc. of the High Resolution Mapping from Space Workshop, 2003. |
| [11] | F.Katlane, M.S.Naceur and M.A.Loghmari,”Multiscale Analysis and Change Detection Based on a Contrario Approach”, International Journal of Computer andInformation Engineering 4:1 2010.www.waset.org/journals/ijcie/v4/v4-1-1.pdf. |
 Abstract
 Reference
 Full-Text PDF
 Full-Text HTML