Ling Huang, Yilong Lu
School of Electrical and Electronic Engineering, Nanyang Technological University, 639798, Singapore
Correspondence to: Ling Huang, School of Electrical and Electronic Engineering, Nanyang Technological University, 639798, Singapore.
| Email: |  |
Copyright © 2012 Scientific & Academic Publishing. All Rights Reserved.
Abstract
This paper presents the investigation of performance of Direct Position Determination (DPD) method for emitter source positioning. Single and multiple emitter cases are studied with different system geometries, array configurations and different emitter locations. MUSIC and Maximum likelihood algorithm are used to process received data and find out possible regions where emitters are. A simple searching method is then applied to reduce errors and find out the final estimated positions. From the results, we can see that DPD performs quite well at high Signal-to-Noise ratio (SNR). However at low SNR, system geometries and antenna configurations will have apparent effect on the performance. In multiple emitter case, there is a minimum distance limit between emitters for DPD to clearly separate them. When emitter signal is hidden by other emitters, DPD performance degrades.
Keywords:
DPD, MUSIC, Antenna Array, Emitter Positioning
1. Introduction
Location based services are attracting more and more attention by service providers as well as by researchers. Such traditional location methods as Time of Arrival (TOA)[1], Angle of Arrival (AOA)[2-4] and their derivatives are widely used in emitter localization and vehicle navigations. These methods are two-step location methods measuring single time or angle parameter at each base station (BTS) separately and determining emitter locations using measured parameters in a data centre. However, a problem called “measurement-sources association problem” is always associated with these methods when multiple emitters are to be localized. Such problem is caused by separate determination of time or angle parameters at different base stations with no information to recognize which parameter comes from which emitter source. Recently, a new one-step location method, Direct Position Determination (DPD), has been proposed by Anthony J. Weiss in[5]. It is attractive for the high positioning accuracy and advantages over traditional location techniques. Most importantly, it is able to solve the association problem in traditional methods. DPD uses exactly the same data as traditional methods. It collects data at all base stations and processes them at the same time in data centre. By a 2-dimensional search, emitter positions are available on a 2-D plane. Weiss has studied theperformance of DPD for a single radio frequency signal bycomparing with traditional methods, and performance of DPD in locating multiple emitter sources via comparisons with traditional methods[5-8]. However, performance of DPD under other conditions is not evaluated. In this paper, impact of different base station geometries on performance of DPD in locating single emitter and performance of DPD on two different multiple emitter sources locations are investigated.In section 2, we describe system geometry and signal model in the positioning system. Section 3 gives a review of Weiss’s DPD method as well as a searching method. Section 4 presents performance analysis of DPD in figures and tables.
2. System Geometry and Signal Model
Assume there are L base stations and Q emitters in the system. Each base station is equipped with M antenna elements. For a rural environment, it is often assumed that no blockages between base stations and emitters. In this situation, signal propagation model is line-of-sight (LOS). Signal loss is due to distance variations as well as environment noise and interference.L base stations form an area inside which emitters are located randomly. Each base station is equipped with M-element uniform linear antenna array (ULA) centred at base station. Distance between antenna elements is set to be half of signal wavelength ( ). Antenna array alignments can be varied to different angles with respect to x-axis (axis pointing to the east). This leads to different receiving angles of received signal at different antenna arrays, hence varies accuracy of AOA information and accuracy of emitter positions. Position of qth emitter is labelled as
  . Position of centre of base station is labelled as
  . The transmitting signal used in the system is a radio frequency (RF) signal. Denote emitter signal as
  ,
,  is the starting transmitting time. The received signal at lth base station from Q emitters is the summation of individual signal from each emitter and is expressed as:
 | (1) |
where  is the array response of antenna array at lth base station to qth emitter source signal.
  is the distance between qth emitter and the mth antenna element at the lth base station.
 | (2) |
 represents attenuation coefficient of path from qth emitter to lth base station.
  is the signal propagation time from qth emitter to lth base station.
  | (3) |
 includes noise and interference during signal propagation from emitter to lth base station.In frequency domain, the above received signal is denoted as:
  | (4) |
 is a
is a  vector. k represents index of Fourier coefficients and Ns represents number of Fourier coefficients.
  ,
, and
and  are Fourier coefficients of respective signals.
3. Positioning Algorithm
3.1. Review of DPD Algorithm
The key idea of DPD algorithm is to find the minimum difference between received signal and the ideal response signal at all base stations. It results in the optimum received signal and hence the optimum positions corresponding to emitter signals in one step. In DPD, all antenna elements at all base stations pass the received signals to a data centre for processing. All the information is processed to form a data matrix containing both TOA and AOA information. After a data decomposition method, search dimension of signals is reduced and the eigenvalues of data matrix can be found. Eigenvalues are associated with signal space and hence space positions of emitters. Plotting of cost function will clearly show the most possible estimated emitter positions.Frequency domain received signal in matrix format is shown as following: | (5) |
where | (6) |
Written in this format, time delay information and angle information are both embedded inside one matrix term. The entire received signal at lth base station is a  vector and expressed as:
 | (7) |
Use matrix  to denote all the emitter positions. The difference between received signal and the idea signal response is minimized using a cost function:
 | (8) |
The cost function requires a multidimensional search to find the minimum value. To reduce the search complexity, Weiss proposed a new cost function based on MUSIC algorithm[8]: | (9) |
 contains all the
  term.
term.  is a matrix containing eigenvectors corresponding to the Q largest eigenvalues of received signal correlation matrix
  :
: | (10) |
In this case,  requires a
  dimensional search to obtain the maximum value corresponding to the most possible emitter position. In order to reduce the search dimension, Weiss proposed a new representation of the cost function[8].
 | (11) |
The norm of  is assumed to be unity to maintain a unique solution. Hence, maximizing eigenvalues of equation (12) will lead to the maximal of
  .
. | (12) |
Therefore,  reduces to:
 | (13) |
The search dimension is reduced to 2. For more than one emitter case, this approach will find out the most significant eigenvalues which corresponds to the most possible emitter positions.
3.2. Searching Method
We have used a searching method for multiple emitter case. In order to find the estimated values of corresponding emitter positions, we applied a grid and sub-grid searching method. The procedure is as follows:1) Coarse grid search: 100 m grid size.2) Divide grid into smaller square area and search inside each small area.3) Find out the peaks inside each small square area: set area radius to be R grids.4) Find out the Q largest peaks among all the peaks and find out the corresponding positions.5) Arrange the resulted estimated positions in order of increments in x, y coordinates and compare with the actual emitter positions to find out the error performance.6) Fine grid search: 10 m grid size.7) Repeat from step 2 to 5.
4. Performance Analysis
DPD performance on locating single and multiple signals has been evaluated by Weiss and some researcher. However, affect of different system geometries and special emitter positions on DPD performance have not been studied by any researchers yet. In this section, DPD performance with different antenna configurations and different emitter positions are evaluated. Two different antenna alignments are considered: antenna array parallel to x-axis and form 45°/135° with x-axis.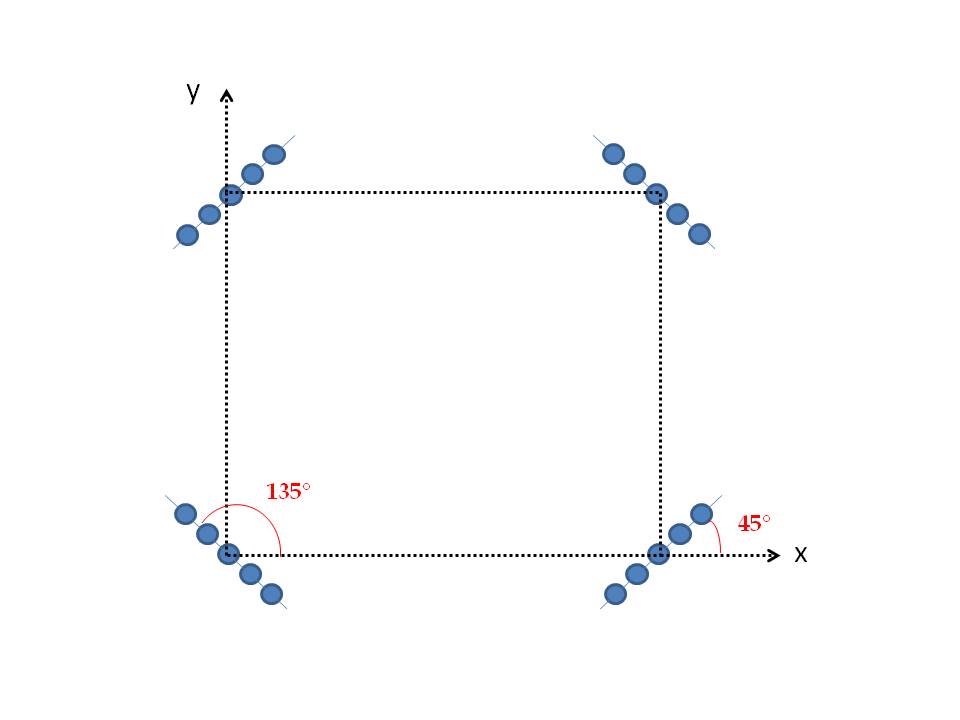 | Figure 1. 45°/135° alignment of antenna array |
In simulations, RF signal is assumed to be sent once only. The performance evaluation factor is the miss distance between true emitter position and estimated position.  | (14) |
Performance evaluation is based on mean and Root-Mean-Square (RMS) value of the miss distance.  represents number of simulation rounds.
 | (15) |
 | (16) |
Single-emitter case and multiple-emitters case are studied separately in following subsections. It is assumed that the investigation area is of 4 km by 4 km, and four base stations are located at the corners of the area. Emitters are located randomly inside the square area.
4.1. Single Emitter
The position of single emitter is randomly generated. By varying the alignment of antenna array at each base station and the number of antenna elements of each array, DPD performance can be obtained. In comparison results, RMS value and mean value of the miss distance are shown.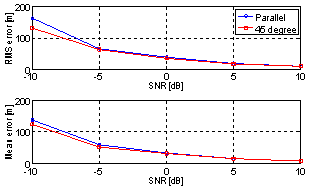 | Figure 2. Comparison of DPD performance with 5-element parallel antenna array and 45°/135° array |
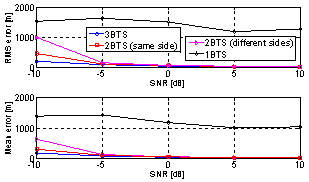 | Figure 3. Comparison of DPD performance with different BTS geometries |
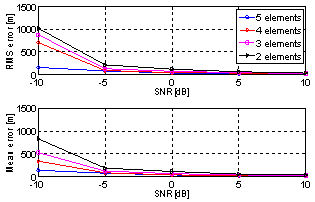 | Figure 4. Comparison of DPD performance with different number of antenna elements |
Figure 2 shows effect of different antenna array alignments on DPD performance. Each array has 5 antenna elements. When antenna array is forming 45°/135° with x-axis, the error is smaller than the parallel case at low SNR values. The reason is that when antenna array is facing the centre of the investigation area, most of the area is on the broadside of the array. While for parallel array, only the sides of investigation area are on its broadside. Hence angle information will be more accurate when arrays are facing the centre of investigation area. At high SNR values, performances are nearly the same. It is concluded that when channel condition is good, different alignments have slight effect on performance of location. However when channel condition is worse, performance of DPD depends largely on the alignments. Good alignments lead to accurate angle and delay information, while bad alignments lead to inaccurate information and larger positioning error. Figure 3 is the performance with different number of base stations. Each base station is equipped with 5 antenna elements. Starting from four base stations, DPD performance degrades with fewer base stations. This is obvious since fewer base stations result in less accurate angle and time delay information. As noted, there are two possible geometries for two base stations case. When two of them are on one side of the area, the performance is a little better at low SNR values than that when two of them are on different sides, meaning diagonal positions. The reason is that, in the latter case two base stations have very poor angular separation. They will obtain information only from diagonal direction, but no enough information from other directions. Hence angle information is greatly missed (as seen clearly from Figure 5, AOA fails when base stations are located at diagonal positions) and DPD cannot perform well.Figure 4 shows the DPD performance when number of antenna elements is varied. Starting from 5 elements, one element is reduced each time with whole antenna array always centred at base station. The plots indicate that when size of antenna array decreases, DPD performance degrades especially at low SNR values.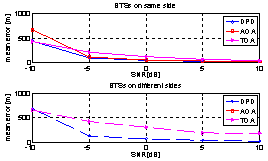 | Figure 5. Comparison of DPD with AOA and TOA when two base stations are used |
4.2. Multiple Emitters
When multiple emitters are presented, performance of DPD becomes more interesting. Weiss only focused on investigating DPD performance by comparing with traditional methods. Here we focus on investigating DPD itself in specific conditions for separating multiple emitters. Figure 6 shows two special locations of multiple emitter sources in the area with 45°/135° antenna array at base stations. Antenna array equipped at base station is 5-element uniform linear array. The investigation area is divided into four quadrants (separated by red dotted lines). S1, S2 are emitter source 1 and 2 respectively.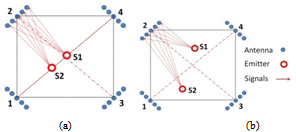 | Figure 6. System geometries: (a) two emitters located along diagonal line, (b) two emitters located in different quadrants |
When two emitters are on the same diagonal line, signals from them to base stations at diagonal positions will be hidden by each other. Hence some information will be lost. From Figure 7, we can see that when two emitters are far apart, DPD can separate them easily. However, when they are too close to each other, DPD will mix them together. It is expected that there should be a minimum distance between them so that they can just be separated. We tested the minimum separation distance by varying distance between two emitters along one diagonal line in each simulation. One location error is determined by RMS value of 10 simulated location errors. Distance increment step is set to be 100√2 m ― emitters are separated by one grid size in both x and y direction.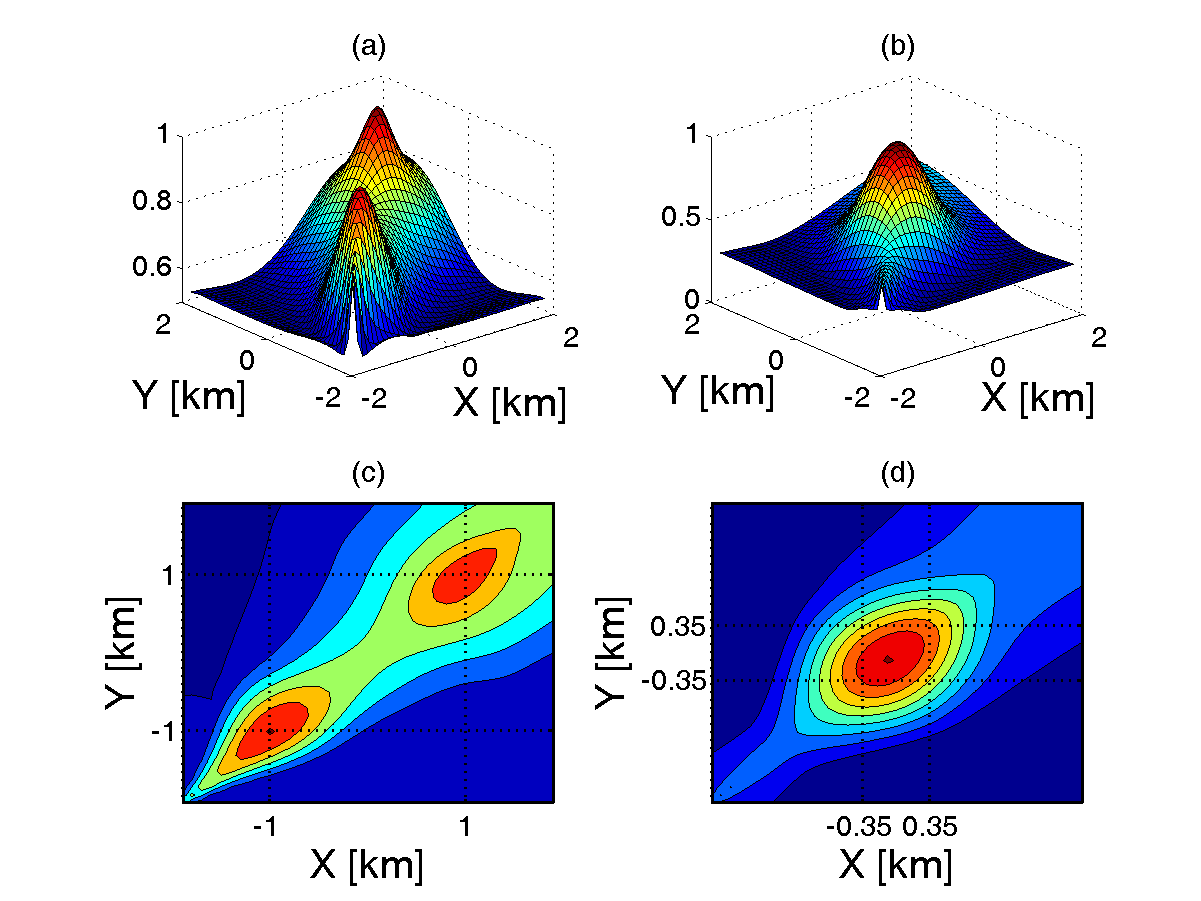 | Figure 7. Cost function at SNR = 30 dB: (a) emitters (–1, –1) km, (1, 1) km on the same diagonal line, separated by around 2.8 km, (b) emitters (–0.35, –0.35) km, (0.35, 0.35) km on the same diagonal line, separated by about 0.98 km, (c) 2-D contour plot of (a), (d) 2-D contour plot of (b) |
| Table 1. Positioning Errors of Diagonal Emitter Positions (SNR = 30 dB) |
| | 1st Emitter | 2nd Emitter | | Position (km) | Error (m) | Position (km) | Error (m) | | (–1, –1) | 24.04 | (1, 1) | 32.55 | | (–0.8, –0.8) | 21.21 | (0.8, 0.8) | 25.69 | | (–0.6, –0.6) | 22.62 | (0.6, 0.6) | 28.98 | | (–0.4, –0.4) | 52.32 | (0.4, 0.4) | 56.74 | | (–0.35, –0.35) | 1193.60 | (0.35, 0.35) | 1404.80 |
|
|
Shown in Table 1, positioning errors are increasing as separation distance decreases. When x, y separation between emitters decreases to about 800 m respectively, errors increase abruptly. Error performance is relatively flat when emitter separation distance is above 800√2 m.As mentioned above, diagonal base stations will miss some information of emitters on that diagonal line. While when emitters are in different quadrants, it is expected that all base stations are able to acquire more information without any hiding and shadowing. It is also expected that minimum separation distance between two emitters for this case will be smaller than previous case.Figure 8 shows cost function for two emitters locating in different quadrants (along y axis). The distance between two emitters is 700 m. From the cost function in 8(b) and 8(d), we are able to recognize two peaks corresponding to two estimated emitter positions. Hence in this situation, DPD can separate them, however, with a bit larger errors. Similarly from Table 2, errors are also increasing with decreasing distance when distance is above 800 m. When distance reaches 700 m, error is greatly increased.| Table 2. Positioning Errors of Non-diagonal Emitter Positions (SNR = 30 dB) |
| | 1st Emitter | 2nd Emitter | | Position (km) | RMS error (m) | Position (km) | RMS error (m) | | (0, –1) | 13.00 | (0, 1) | 16.43 | | (0, –0.8) | 20.00 | (0, 0.8) | 23.66 | | (0, –0.6) | 24.00 | (0, 0.6) | 25.38 | | (0, –0.4) | 10.00 | (0, 0.4) | 17.89 | | (0, –0.35) | 293.00 | (0, 0.35) | 363.44 |
|
|
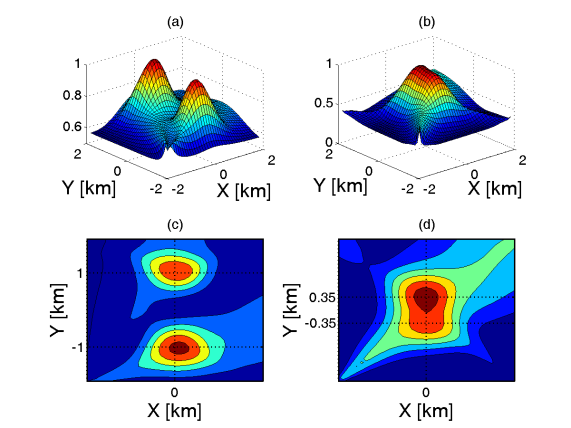 | Figure 8. Cost function at SNR = 30 dB: (a) emitters (0, –1) km, (0, 1) km inside different quadrants, separated by 2 km, (b) emitters (0, –0.35) km, (0, 0.35) km in different quadrants, separated by 0.7 km, (c) 2-D contour plot of (a), (d) 2-D contour plot of (b) |
5. Conclusions
DPD method generates very high positioning accuracy even at low SNR values. DPD performance degrades with decreasing SNR values. Antenna array alignments also have impact on DPD performance. Compared with the impact on AOA and TOA, it is much smaller. Antenna array with 45°/135° alignment with respect to x-axis generates higher positioning accuracy. Besides, the more base stations with good angle separation and more antenna elements we use, the better DPD performs in locating emitters. In multiple emitter sources case, DPD can distinguish easily different emitters from each other when they are far enough, but mix them together when they are quite near. The minimum distance between diagonal emitters is larger than that between non-diagonal emitters.
ACKNOWLEDGEMENTS
The authors wish to acknowledge the help from Professor Anthony J. Weiss at Tel Aviv University in Israel.
References
| [1] | M. I. Skolnik, Introduction to radar systems, McGraw-Hill, New York, NY, USA, 3rd edition, 2000. |
| [2] | R. G. Stansfield, “Statistical theory of DF fixing,” Journal IEE, vol. 94, Part 3A, no. 15, pp. 762-770, 1947. |
| [3] | D. J. Torrieri, “Statistical theory of passive location systems,” IEEE Trans. on Aerospace and Electronics Systems, vol. 20, no. 2, pp. 183-198, 1984. |
| [4] | O. S. Ralph, “Multiple emitter location and signal parameter estimation,” IEEE Trans. on Antennas and Propagation, vol. AP-34, No. 3, March 1986. |
| [5] | A. J. Weiss, “Direct position determination of narrowband radio frequency transmitters,” IEEE Signal Processing Letters, vol. 11, No. 5, pp. 513-516, May 2004. |
| [6] | A. Amar and A. J. Weiss, “Advances in direct position determination,” Proc. the 3rd IEEE Sensor Array Multichannel Signal Processing Workshop (SAM2004), Barcelona, Spain, July 2004. |
| [7] | A. J. Weiss and A. Amar, “Direct position determination in the presence of model errors - known waveforms,” Elsevier Journal on Digital Signal Processing, No. 16, pp.52-83, 2006. |
| [8] | A. J. Weiss and A. Amar, “Direct position determination of multiple radio signals,” EURASIP Journal on Applied Signal Processing 2005: 1, pp. 37-49, January 2005. |

 ). Antenna array alignments can be varied to different angles with respect to x-axis (axis pointing to the east). This leads to different receiving angles of received signal at different antenna arrays, hence varies accuracy of AOA information and accuracy of emitter positions. Position of qth emitter is labelled as
  . Position of centre of base station is labelled as
  . The transmitting signal used in the system is a radio frequency (RF) signal. Denote emitter signal as
  ,
,  is the starting transmitting time. The received signal at lth base station from Q emitters is the summation of individual signal from each emitter and is expressed as:
 is the array response of antenna array at lth base station to qth emitter source signal.
  is the distance between qth emitter and the mth antenna element at the lth base station.
 represents attenuation coefficient of path from qth emitter to lth base station.
  is the signal propagation time from qth emitter to lth base station.
 includes noise and interference during signal propagation from emitter to lth base station.In frequency domain, the above received signal is denoted as:
 is a
is a  vector. k represents index of Fourier coefficients and Ns represents number of Fourier coefficients.
  ,
, and
and  are Fourier coefficients of respective signals.

 vector and expressed as:
 to denote all the emitter positions. The difference between received signal and the idea signal response is minimized using a cost function:

 contains all the
  term.
term.  is a matrix containing eigenvectors corresponding to the Q largest eigenvalues of received signal correlation matrix
  :
:
 requires a
  dimensional search to obtain the maximum value corresponding to the most possible emitter position. In order to reduce the search dimension, Weiss proposed a new representation of the cost function[8].
 is assumed to be unity to maintain a unique solution. Hence, maximizing eigenvalues of equation (12) will lead to the maximal of
  .
.
 reduces to:


 represents number of simulation rounds.


 Abstract
 Reference
 Full-Text PDF
 Full-Text HTML