-
Paper Information
- Previous Paper
- Paper Submission
-
Journal Information
- About This Journal
- Editorial Board
- Current Issue
- Archive
- Author Guidelines
- Contact Us
American Journal of Signal Processing
p-ISSN: 2165-9354 e-ISSN: 2165-9362
2012; 2(2): 35-40
doi: 10.5923/j.ajsp.20120202.06
Transition Detection Using Hilbert Transform and Texture Features
 Abstract
 Reference
 Full-Text PDF
 Full-Text HTML
G. G. Lakshmi Priya , S. Domnic
Department of Computer Applications, National Institute of Technology, Tiruchirappalli, Tamilnadu, India
Correspondence to: G. G. Lakshmi Priya , Department of Computer Applications, National Institute of Technology, Tiruchirappalli, Tamilnadu, India.
| Email: |  |
Copyright © 2012 Scientific & Academic Publishing. All Rights Reserved.
In this paper, we propose a new method for detecting shot boundaries in video sequences by performing Hilbert transform and extracting feature vectors from Gray Level Co-occurrence Matrix (GLCM). The proposed method is capable of detecting both abrupt and gradual transitions such as dissolves, fades and wipes in the video sequences. The derived features on processing through Kernel k-means clustering procedure results in efficient detection of abrupt and gradual transitions, as tested on TRECVid video test set containing various types of shot transition with illumination effects, object and camera movement in the shots. The results show that the proposed method yields better result compared to that of the existing transition detection methods.
Keywords: Transition detection, Hilbert Transform, GLCM, Feature Vectors, Kernel k-means clustering, Performance Evaluation
Article Outline
1. Introduction
- Video shot boundary detection plays major role in digital video analysis, having applications in many important video analysis domains like video indexing, video compression, video content browsing, retrieval and others. The video shot represents the elementary unit of the video and refers to a continuous sequence of one frame captured uninterruptedly by one camera. Shots are assembled during the editing phases using varieties of techniques like fade, dissolve and wipe are referred as gradual shot transitions. A rapid transition from one shot to another is simply referred to as hard cuts or cuts (abrupt shot transition). A soft cut represents a gradual transition between two shots, which means a sequence of video frames that belong to both the first and the second video shot. The process of identifying the different shot transition within a video sequences is known as Video Shot Boundary Detection or Shot Based Video Segmentation or video partitioning[1]. Some difficulties are faced in finding the shot boundaries in the presence of camera and object motion, illumination variations and special effects. Two approaches that are broadly used for video shot boundary detection are pixel domain processing and compressed domain processing. Comparison of various shot detection methods has shown that the pixel domain methods are more accurate when compared to that of compressed domain methods[2-4]. On the other hand, compressed domain methods works faster. In order to improve the accuracy of the detection process in compressed domain, more important and confined features are to be extracted from the video data. The efficiency of the detection process lies on extracted features, metrics used to find relation between the consecutive frames and the transition identification process which categories shot boundary and not shot boundary.Initial way to check for visual content dissimilarity is to compare the pixel intensities between the two consecutive frames[3]. They are very sensitive to camera and scene object motion in the video sequences. Histograms[3] are the most common method used to detect shot boundary. It computes gray level or color histogram of two consecutive frames. This method has one major benefit that the spatial distribution of the information is disregarded. The drawback is that if two frames have quite same histogram while their contents are dissimilar extremely, they may result in miss detection. In papers[5] the authors have compared the content of two consecutive frames using the edge change ratio (ECR). The main disadvantage of this method is they produce relatively high number of false hits, especially in the video scenes in which they contain high speed motion. Yoo et.al[6] have used the inter-frame correlation between two consecutive frames k and k+1to detect abrupt transition and used localized edge block information for detecting gradual transitions. The major drawback of this method is that they are sensitive to illumination effect, camera and object movement.Yoshihiko kawai et. al. [7] have proposed a method that utilizes multiple features for shot boundary detection. In this paper each extracted feature difference value is compared with the predefined threshold at different stages. The main drawback of this method is the use of predefined threshold value for each stage of the detection process. As an improvement to the method[7], Lian in his work[8] has used multiple features (pixel wise differences, color histogram, motion) which detect transitions in serial manner using different threshold values. The number of thresholds used is comparatively less than the previous method[7]. Zhang et al. [9] have used the HSV histogram differences of the two consecutive frames as the feature for evaluating the color information between the frames. The main disadvantage of this method is that if two consecutive dissimilar frames have same histogram may result in missed hit. In paper[10] Color Layout Descriptor (CLD) is considered as feature and the difference between the consecutive frames are computed. This method works well for hard cuts but lacks its performance in the presence of long dissolve and fades regions in the video stream. Abdul Salam[11] in his paper has suggested that 1-D Hilbert transform can be utilized to handle image signals and video transmission. Author has also concluded that Hilbert transform is considered to be useful in manipulating images. In our previous paper[12] we have detected abrupt transitions using Hilbert transform and GLCM based features. As an extension, we have made changes in the features to be considered for detection process which works well for both abrupt and gradual transitions. Also our extended work is compared with the recent methods and the performance of the proposed work is discussed in section 3.In the proposed method, we have selected the texture information as the feature vector. To reduce the detection time, the features are extracted from the Hilbert transformed frames[11]. Then the proposed method uses kernel k-means clustering[13] to classify the video frames as shot or no shot. The rest of this paper is organized as follows. The proposed method is presented in section 2 along with the description and method for identifying transitions. Experimental results are discussed in section 3 and finally conclusion is derived in section 4.
2. Proposed Method
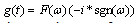
- In the proposed method, the video information is converted into Hilbert transformed signal and the Gray Level Co-occurrence Matrix (GLCM) of the transformed data have been used as the source to extract features for detecting shot boundaries in video sequences. Texture features are extracted from GLCM and the distance measure between the adjacent frames is calculated. Based on the similarity values between the consecutive frames, clustering of shot transition frames and non-transition frames are performed using Kernel k-means clustering. The block diagram of the proposed method is shown in figure 1. In the next subsections detailed explanation about Hilbert transforms, Gray level co-occurrence matrix, texture features extraction and kernel k-means clustering are discussed.
2.1. Hilbert Transform
- The Hilbert transform[14] of a function f(t) can also be represented as:
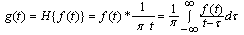 | (1) |
 ,
, | (2) |
 is the Fourier transform of the function
  ,
, is the odd signum function.
  is +1 for
  > 0, 0 for
  = 0 and -1 for
  < 0.The Hilbert transform is considered as a filter, which simply shifts phases of all frequency components of its input, by±π/2 radians. In general, video is a sequential collection of frames whose intensity values are represented as a set of real numbers R. More features like color, edge, texture etc., information can be extracted from each frame. Instead of using the whole frames’ intensity values as features, transformed information can also be considered, is the condensed representation of the original. In our work the transformed information is obtained by applying above discussed Hilbert transformation over the frames. To perform Hilbert transformation, the input video data is to be converted into 1-D signal f (t). The RGB frame shown in figure 2a is converted into gray scale image as shown in figure 2b and the Hilbert transformed image is shown in figure 2c. Based on this transformed information, GLCM features are extracted.
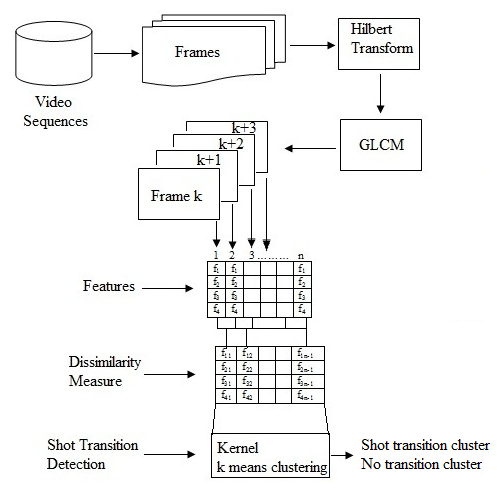 | Figure 1. Block diagram of the proposed method |
 | Figure 2. (a) Original frame (b) Gray scale frame (c) Hilbert transformed frame |
2.2. Gray Level co-occurrence Matrix (GLCM)
- The texture filter functions provide information about the texture of a frame but fail to provide information about shape. A statistical method that considers the spatial relationship of pixels is the Gray-Level Co-occurrence Matrix (GLCM) and also known as the gray-level spatial dependence matrix[15]. GLCM is calculated by finding the frequency of the gray level pixel intensity value i occurs in a specific spatial relationship to a pixel with the value j. Each element (i,j) in the resultant GLCM is the sum of the number of times that the pixel with value i occurred in the specified spatial relationship to a pixel with value j in the input frame. Here, the co-occurrence matrix is computed based on two parameters, which are the relative distance ‘d’ between the pixel pair (i,j) and their relative orientation
 . ‘d’ is measured in pixel number. Normally
  is quantized in four angles (0°, 45°, 90°, 135°). Let
  represents the GLCM for an image
  for distance d and direction
  can be defined as
 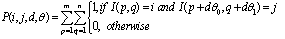 | (3) |
 . For each
  value, it’s
  and
and  values are (0, 1) for 0°, (-1,-1) for 45°, (1, 0) for 90°, (1,-1) for 135°.
2.2.1. Texture Features Extracted from GL CM
- Various texture features[11] can be extracted from GLCM and from that four features Contrast (f1), Correlation (f2), Energy (f3) and Homogeneity (f4) are considered. The contrast feature f1 measures the intensity contrast between a pixel and its neighbour over the whole image and is calculated using (4). The range of contrast depends on the size of the matrix. i.e. Range =[0, (size(GLCM,1)-1)^2]. The correlation feature f2 is a measure of gray tone linear dependency in the image. It measures how a pixel is correlated to its neighbour over the whole image and it is calculated using (5). Correlation is 1 or -1 for a perfectly positively or negatively correlated image. The energy feature f3 provides the sum of squared elements in the GLCM. It is also known as uniformity, uniformity of energy. Energy is calculated using (6). The homogeneity feature f4 measures the closeness of the distribution of elements in the GLCM to the GLCM diagonal. Homogeneity is 1 for a diagonal GLCM and calculated using (7).
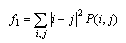 | (4) |
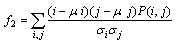 | (5) |
 | (6) |
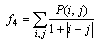 | (7) |
 is mean,
  is the standard deviation of GLCM
  . However, for a constant image the texture features are
  . The four features
  are the functions of distance and angle. For a chosen distance d, four angular GLCM are measured and hence a set of four values for each of the four features are obtained. On the whole 16 feature measures are generated. To reduce the number of features, the average of four angular GLCM is taken using (8) and then the four features are extracted as the Average GLCM (AGLCM).
 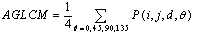 | (8) |
 from AGLCM is constructed which is feature representing each frame. In order to find the relationship between the consecutive frames, dissimilarity / similarity between these frames are to be carried out. The simplest method for shot detection is to compute absolute difference
  between the F of k and k+1th frame. Thus the relation between the consecutive frames is calculated using:
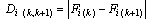 | (9) |
2.3. Shot Change Detection
- In order to detect the video shots, the set of difference vectors D are processed using clustering method. The frames are grouped into two clusters: “Shot transition” and “no transition” clusters. In general, k-means clustering[13] is one of the most popular clustering algorithms. The standard k-means clustering techniques separate the cluster by a hyper-plane; where squared Euclidean distance is used as the distortion measure. Given a set of data points
 , the k-means algorithm finds clusters
  that minimizes the objective function
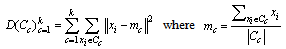 | (10) |
 [16] before clustering points. Then kernel k-means partitions the points by linear separators in the new space. The main objective of the kernel k-means can be written as a minimization of
 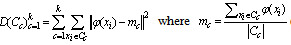 | (11) |
3. Experimental Results and Discussion
- The proposed method for detecting video shot boundary is tested on various TRECVid video datasets[16] and on few other publically available data[17]. The videos containing object/ camera motion and illumination effects inside single shots are selected. Video sequences, varies in duration, frame rate and resolution. To speed up the calculations the videos are downsampled with resolution 180 x 160 were used in our experiments. Description of the video sequences in the sample test set is depicted in table 1.A correctly detected shot transition is called a hit (H), a not detected shot is called a missed hit (M) and a falsely detected shot transition is called a false hit (F). For the evaluation of the proposed work, the precision, recall and combined measures are calculated using
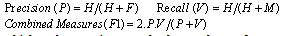 The higher these ratios are, the better the performance. Our proposed algorithm is implemented in Matlab 7.6, Table.2 shows the experimental results of the proposed method for detection of abrupt and gradual transition.
| ||||||||||||||||||||||||||||||||||||||||||||||||||||||||||||||||||||||||||||||||||||||||||||||||||||||||||||||||||||||||||||||||||||
|
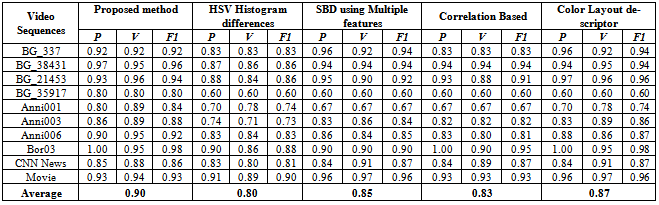
 | Figure 3. Results obtained for Anni001 video sequence |
4. Conclusions
- In this paper, a new shot boundary detection algorithm is proposed which extracts feature vectors from GLCM of the Hilbert transformed video. The derived feature vectors on processing through Kernel based k-means clustering procedure results in efficient detection of transitions. Experiments have been performed on TRECvid data sets and publically available data sets. As a conclusion, our proposed method’s performance is better when compared with that of the other existing methods.
References
| [1] | Tudor Barbu, “A novel automatic video cut detection techniques using Gabor filtering,” Computer and Electrical Engineering, vol.35, pp. 712-721, Sep. 2009. |
| [2] | U.Gargi, Kasturi, and S.H.Strayer, “Performance characterization of video shot change detection methods,” IEEE Trans. on Circuits and Systems for Video Technology, CSVT-10(1), pp.1-13, 2000. |
| [3] | Rainer Lienhart, “Comparison of automatic shot boundary detection algorithm,” Image and video processing VII, in Proc. SPIE, 3656-3659, 1999. |
| [4] | J. S. Boreczky and L. Rowe, “Comparison of video shot boundary detection techniques,” in Proc. IS&T/SPIE Storage and Retrieval for Still Image and Video Databases IV, vol. 2670, pp. 170–179,1996. |
| [5] | R. Zabih, J. Miller, and K. Mai, “A feature-based algorithm for detecting cuts and classifying scene breaks,” in Proc. ACM Multimedia ’95, San Francisco, CA, pp. 189–200, 1995. |
| [6] | Hun-Woo Yoo & Han-Jin Ryoo & Dong-Sik Jang, Gradual shot boundary detection using localized edge blocks, Multimedia tools appls. 28: 283-300, 2006. |
| [7] | Y. Kawai, H. Sumiyoshi, and N. Yagi. “Shot Boundary Detection at TRECVID 2007,” In TRECVID 2007 Workshop, Gaithersburg, 2007. |
| [8] | Shiguo Lian. Automatic video temporal segmentation based on multiple features. Soft Computing, Vol. 15, 469-482, 2011. |
| [9] | Weigang Zhang, et. al., “Video Shot Detection Using Hidden Markov Models with Complementary Features,” In Proceedings of the First International Conference on Innovative Computing, Information and Control.Vol.3.http://doi.ieeecomputersociety.org/10.1109/ICICIC.2006.549, 2006. |
| [10] | Damian Borth, Adrian Ulges, Christian Schulze, Thomas M. Breuel: Keyframe Extraction for Video Tagging & Summarization. In: Informatiktage pp. 45-48, 2003. |
| [11] | Ahmed O. Abdul Salam, “Hilbert transform in image processing” in Proc. ISIE, pp. 111-113, 1999. |
| [12] | Lakshmi Priya G.G., Domnic S., “ Video cut detection using Hilbert transform and GLCM”, in proc. of IEEE-International Conference on Recent Trends in Information Technology, 749-753, 2011. |
| [13] | Inderjit S. Dhillon, Yuqiang Guan, and Brian Kulis, Weighted Graph Cuts without Eigenvectors: A Multilevel Approach, IEEE Transactions On Pattern Analysis And Machine Intelligence, VOL. 29, NO. 11,1944- 1957, 2007. |
| [14] | Panchamkumar D Shukla, Complex wavelet transforms and their applications, Thesis of Master of Philosophy(M.Phil.), University of Strathclyde , United Kingdom, 2003. |
| [15] | Haralick, R.M., Shanmugam, K., Dinstein, I.: “Textural Features for Image Classification,” IEEE Trans. Systems Man Cybernet. SMC-3, 610 – 621, 1973. |
| [16] | B. Scholkopf, A. Smola, and K.-R. Muller, “Nonlinear Component Analysis as a Kernel Eigenvalue Problem,” Neural Computation, vol. 10, pp. 1299-1319, 1998. |
| [17] | TRECVID Dataset website: http://trecvid.nist.gov/. |
| [18] | Video Dataset: http://www.open-video.org. |