Puli Kishore Kumar , T. Kishore Kumar
Department of Electronics & Communication Engg, National Institute of Technology, Warangal, India
Correspondence to: Puli Kishore Kumar , Department of Electronics & Communication Engg, National Institute of Technology, Warangal, India.
| Email: |  |
Copyright © 2012 Scientific & Academic Publishing. All Rights Reserved.
Abstract
Through-the-wall imaging is an emerging area of research and development which is very much useful in urban warfare situations. UWB range radar is the best suitable for this application where this range of signals has the capability of penetrating through the materials but still can provide better resolution. The incorporation of signal processing techniques on the raw data will gives the better representation of the scanned scene. This paper uses impulse radar for (Through the Wall Imaging) TWI and back projection algorithm is used to retrieve the B-scan signal. A constant gain of factor 100 is used to increase the echo strength. Singular value decomposition is used to reduce the clutter from the B-scan signal and the PSNR is observed to be as -3.79dB.
Keywords:
Ultra-Wideband, Impulse Signal, Clutter, Through-The-Wall, Synthetic Aperture
1. Introduction
The advent of UWB technology gave a new direction of remote sensing in war field particularly in urban environment. Through-the-wall and through-the-building sensing are relatively new areas that address the desire to see inside structures to determine the layout of buildings, where occupants may be, and even identify materials within the building[1]. Through-wall sensing is highly desired by police, fire and rescue, emergency relief workers, and military operations. Accurate sensing and imaging can allow a police force to obtain an accurate description of a building in a hostage crisis, or allow fire fighters to locate people trapped inside a burning building. The goals of through-the-wall sensing technology are to provide vision into otherwise obscured areas. Clutter reduction is very important in identifying the objects in the B-scan image[2]. Particularly in TWI it is very much necessary to identify the objects because clutter dominates the signal. The major contribution of clutter is the direct reflection from the wall. The echo received directly from the wall is predominant and has to be removed. The other type of clutter includes the multiple reflections from the objects inside the room and many more. Electromagnetic simulation software is used to create the environment with different materials.This paper makes use of singular value decomposition SVD for the clutter removal. This paper in section II describes the measurement scenario used and specifications. Section III gives the importance of crosstalk removal and time varying gain, section IV gives an account on back projection algorithm and SVD and finally the results and conclusions were given in section V & VI respectively.
2. Measurement Scenario
A simplified top view of the measurement layout is shown in fig 1. The radar system was horizontally scanned parallel to the front brick wall at a distance of 43.75 cm from the wall as shown in figure. The wall is considered as the brick wall and the specifications are given in table 1.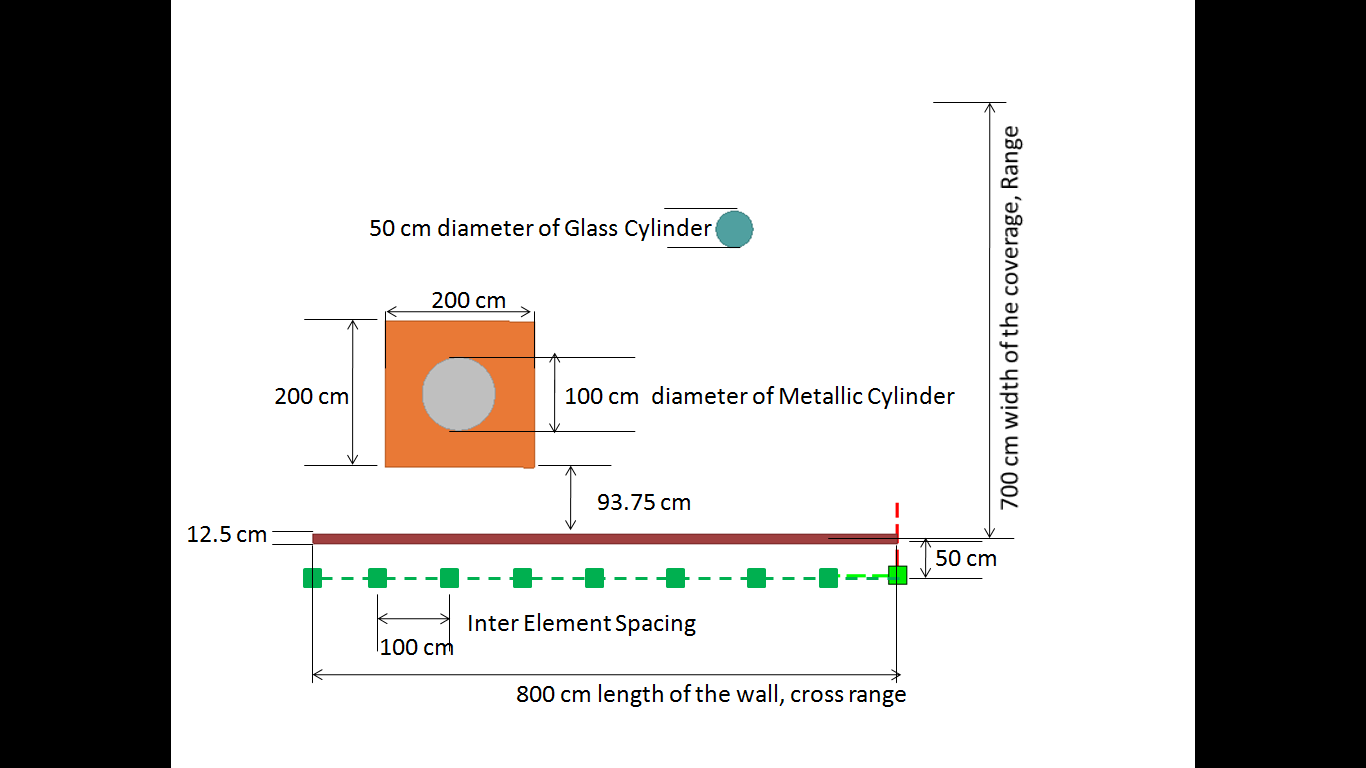 | Figure 1. Top view of the simulated measurement scenario |
| Table 1. Electrical Parameters of the brick wall |
| | Type of wall | Brick wall | | Relative Permittivity | 4.440 | | Conductivity | 0.001 S/m | | Thickness of the wall | 0.125 m |
|
|
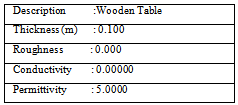
The area that is scanned behind the wall covers the volume of 800 cm×700 cm×500 cm indicates length, width and height respectively. The transmitting and the receiving antennas are placed at the same position, keeping in view to make use of the same antenna for both transmitting and receiving for further studies. The objects that were placed behind the wall consists a wooden table on which an iron cylinder is placed and at other position a glass cylinder is placed. The specifications of the wooden table, iron cylinder and glass cylinder are given in table 2.Table 2(a). Wooden table Properties
 |
| |
|
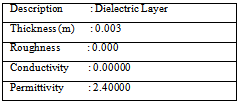
Table 2(b). Glass Cylinder Properties
 |
| |
|
 | Figure 2. Side view of the simulated measurement scenario |
One reason of selecting these materials (wood, metal and glass) is to check how the reflection of the signals takes place, and the second is these materials usually found in any rooms.Since Ultra-Wideband (UWB) signals has the better penetration properties and has the capability of obtaining high resolution images, we use an impulse signals particularly Gaussian derivative is used. The resolution is proportion to the bandwidth of the signal[3, 4] and is given by  | (1) |
Where ΔR : Range Resolutionτ: Pulse WidthB: Bandwidth and c = 3×10⁸ m/sec is the velocity of light in free space.The reason of selecting Gaussian doublet or the second derivative of the Gaussian pulse for transmitting is that it has only one peak which can be easily noticed in the time domain and also has the longest lobe in the frequency domain, creating the large bandwidth of the signal. Another pulse would not fit these requirements since it would not have both the large single pulse in the time domain and cover a large spectrum in the frequency domain[5-7].Since the signal transmitted by the antenna is the derivative of the input signal, to make use of Gaussian doublet Gaussian first derivative is given as input signal to the antenna. The expressions for Gaussian pulse and its derivatives (up to second order derivative) are given by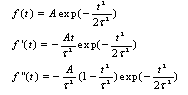 | (2) |
The signal that was used here has the pulse width of 0.5 nsec and the with centre frequency of 1.83 GHz and 3.3 GHz bandwidth. The plot of the Gaussian derivative and its spectrum is shown in figure 3. | Figure 3. (a) Gaussian Derivative (b) Its frequency Spectrum |
Horn antennas were used for transmission and reception. Selecting horn antenna enhances the gain in the direction of scanning and to not to considering the region behind the antenna which is of no use. The horn antenna specifications are shown in figure 5. | Figure 4. Specifications of horn antenna |
3. Crosstalk Removal and Time Varying Gain
Crosstalk is the part of the signal that travels directly between the transmitting and receiving antennas. It is the first and often the largest peak in the A-scan signal which affects the mean value of the signal. This signal constantly presents in all the measurements and contains no information of the scanned scene. Sometimes this largest peak signal may cross the maximum current rating of the receiver circuit over which the performance may be degraded [8]. Hence it is very important to remove the crosstalk. The crosstalk can be obtained by measuring with radar in the free space, or with absorbers around (anechoic chamber).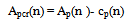 | (3) |
Where Ap(n) and cp(n) are the A-scan signal and crosstalk at pth position of an antenna respectively and Apcr(n) represents the A-scan signal at pth position with crosstalk removed.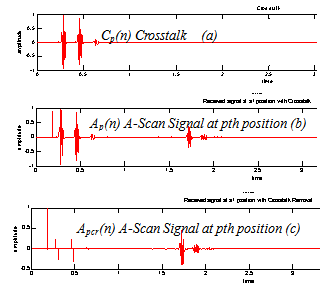 | Figure 5. (a) Crosstalk Measurement, (b) Received A-scan signal (c) A-scan signal after removing the crosstalk |
Time varying gain is the concept that was introduced in sonar system where the signal gets attenuated as it gets delayed to reach the receiving antenna. This has a great advantage of increasing the dynamic range and even to detect the targets which gives small strength echoes. The detection of the target with and without time varying gain is clearly demonstrated in the results. Generally speaking as the signal gets delayed to reach the receiver antenna the strength of the signal also reduces. Keeping this in view the gain of the received signal also is made increased based on the delay. In[9] it was given the gain is proportional to the square of the elapsed time measured.In this paper a constant gain of factor 100 is used. This constant gain is applied to the received signal after the delay of 6nano seconds. The signal before the delay represents the strong clutter from the wall. Figure 7(a) &(b) shows the A-scan signal without and with constant gain factor | Figure 6. (a) A-scan signal without constant gain factor |
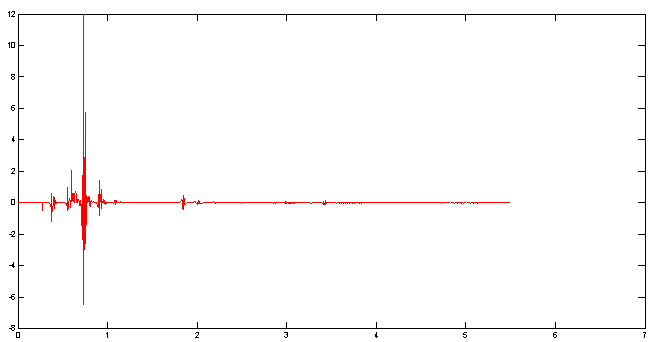 | Figure 6. (b) A-scan signal with constant gain factor |
4. Back Projection Algorithm and SVD
This algorithm retrieves the image of the scanned area by making use of the A-scan signals at different receiver positions. Since the image is of 2D and is represented by an M×N matrix, the aim is obtain the corresponding numerical values to fill the matrix, such that the formed image should represent the scanned scene. Each numerical value in the M×N matrix represents a pixel value of an image. This image or 2D signal is also called as B-scan signal11.The numerical value at any pixel position should be the contribution of the A-scan signals at all receiver positions. Since the range is fixed to 700 cm and the number of pixels in the range direction is N (M represents cross range and N represents the range), the range bins are selected such that the maximum range should not cross the prescribed value.The A-scan signal received at each receiver position assuming P targets in the region is represented as[10, 11].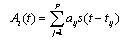 | (4) |
Where Ai(t) is the A-scan signal at ith receiver position, aij is the reflection coefficient of the jth tatget and tij is the delay of the signal from ith transmitter position to jth tatget position and to ith receiver position and is given by | (5) |
where Rij is the distance from ith transmitter position to the jth target position.A weight factor also should be there in eq (4) representing the attenuation of the signal. Similarly a term should be added in eq (5) representing the reduction of velocity inside the wall. Since the intention is to obtain the image, these terms are given little importance in this paper. The point spread response (PSR) which represents the spreading of signal energy in two dimensional space of a given A-scan signal is given by | (6) |
where i= 0,1,2,3…..Mj=0,1,2,3……Nand  is the focusing delay[12] in the image space. The PSR at pth receiver position is shown in figure 8.
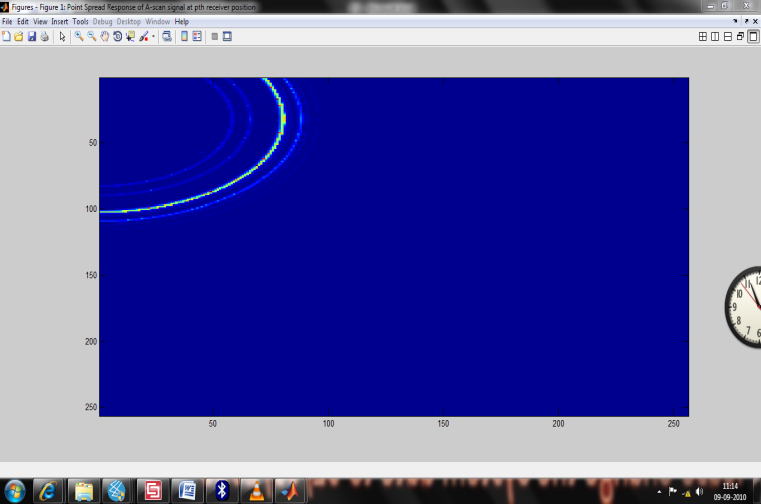 | Figure 7. Point Spread Response |
But the final image should have the contribution of all A-scan signals and hence all the PSR should be added. The expression is given by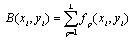 | (7) |
Singular Value Decomposition is used to split the data matrix into complimentary subspaces called signal and noise subspaces in order to increase SNR which is useful for clutter reduction. For clutter reduction the image matrix X is decomposed as  | (8) |
Where B is of order M×N, U and V are order of M ×M, N×N respectively and S = diag(s1,s2,s3…….sr) with s1≥s2≥s3≥…sr.The image matrix B can be written as  | (9) |
B=B1+B2+B3+……BNWhere Bi are matrices of the same dimensions of B and called as modes and B=Bsignal+Bclutter | (10) |
The peak signal to noise ratio PSNR is given by Where
Where | (11) |
5. Results
The figure shown in figure 8 is obtained using the back projection algorithm. It is very clear from the figure that the signal gets attenuated as it travels more distance from the wall and hence the cylinder target is not visible. Applying the gain factor to the received A-scan signal the back projected algorithm gives the image as shown in figure 9. It is clear from the figure that the target cylinder is identified and there is a huge intersections point at the metallic cylinder. This indicates that the reflected signal is more because of the metallic cylinder.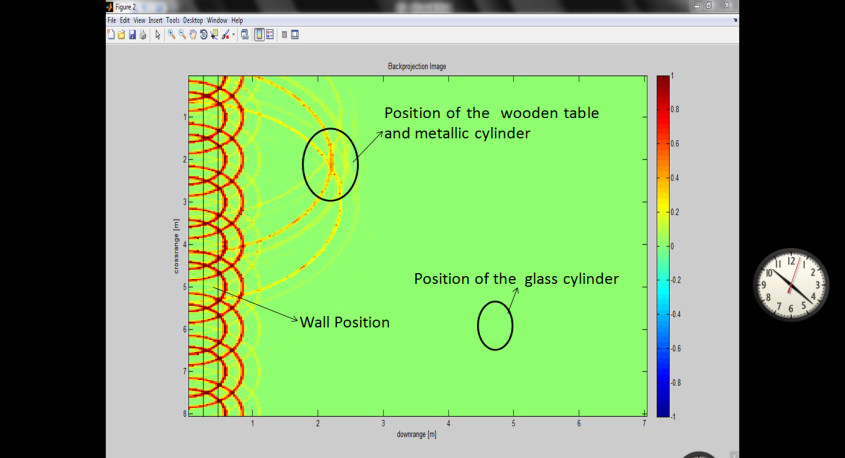 | Figure 8. B-scan image of the scene with wall and without gain factor |
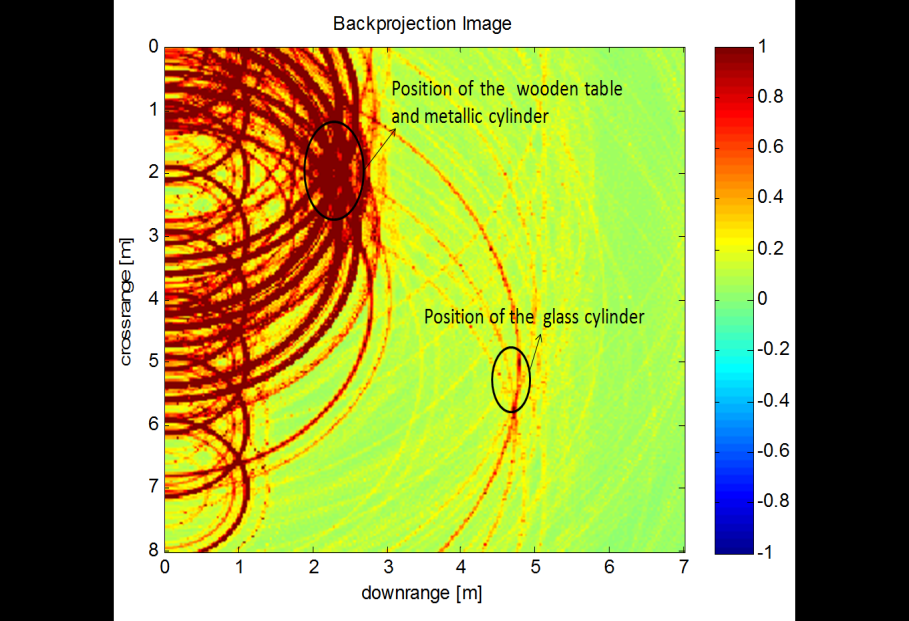 | Figure 9. B-scan image of the scene with wall and with gain factor |
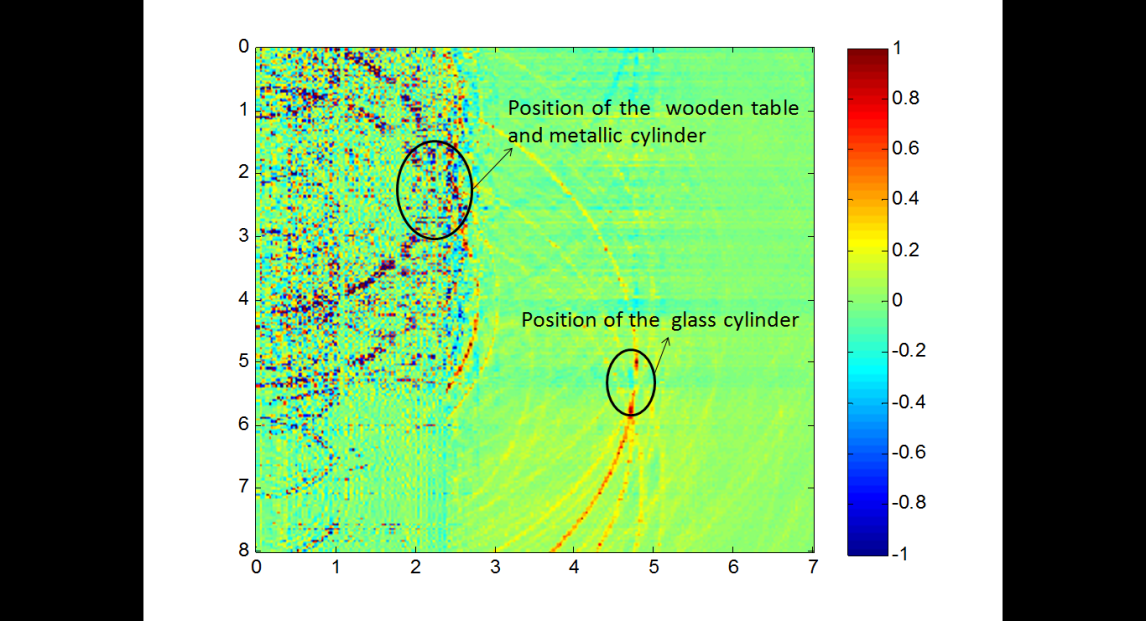 | Figure 10. B-scan image of the scene with wall and with gain factor |
The image shown in figure10 is obtained by reduction of the clutter using singular value decomposition method. The modes in the range of 50 to 150 were considered to obtain the image. This clearly demonstrates the reduction in the clutter and the peak signal to noise ratio is obtained as -3.79 dB.
6. Conclusions
This paper presented a novel approach of reducing the clutter from a B-scan image by making use of an singular value decomposition technique. Impulse based signals are used for through the wall imaging. Electromagnetic simulation software is used to model the wall and objects inside the room. Three different materials were selected. The need for removing crosstalk and the necessasity of time varying gain is also explained. The results shows the reduction in the clutter and the peak signal to noise ratio PSNR is obtained as -3.79dB
References
| [1] | Giorgio Franceschetti, Riccardo Lanari, Synthetic Aperture Radar Processing, CRC Press, 1999. |
| [2] | A. C. Kak, M. Slaney, Principles of Computrized Tomographic Imaging, IEEE Press, New York, 1988. |
| [3] | James D. Taylor, “Ultra-Wide Band Radar Technology” ,CRC Press, 2001 |
| [4] | Taylor, J. D,: Introduction to Ultra-wideband radar systems. CRC Press, Boca Raton, FL |
| [5] | M. Ambors, “Ultra-Wideband Radar “seeing” Through Walls”, May 2007 |
| [6] | Ahmad Safaai-Jazi, Sedki M. Riad, Ali Muqaibel, and Ahmet Bayram, “Ultra-wideband Propagation Measurements and Channel Modeling” DARPA NETEX Program Report, November 18, 2002. |
| [7] | Sylvain Gauthier and Walid Chamma, “Through–The–Wall Surveillance” Technical Memorandum, DRDC Ottawa, October 2002. |
| [8] | Michal Aftanas “Through the wall imaging using M-sequence UWB radar system” a doctoral thesis, Slovak. Republic. December 2007. |
| [9] | United Ststes Patents No: 4,198,702 by clifford April 15, 1980. |
| [10] | Greg Barrie, “Ultra-wideband Synthetic Aperture” Data and image processing Technical Memorandum, DRDC Ottawa, January 2003. |
| [11] | N.T. Thanh, L. van Kempen, T.G. Savelyev, X. Zhuge, M. Aftanas, E. Zaikov, M. Drutarovsky, H. Sahli, “Comparision of Basic Inversion Techniques for Through-Wall Imaging Using UWB Radar”, Proceedings of 5th European Radar Conference, October 2008. |
| [12] | Fauzia Ahmad, Moeness G. Amin, Saleem & A. Kassam, “Synthetic Aperture Beamformer for Imaging Through a Dielectric Wall”, IEEE Transactions on Aerospace and Electronic Systems, Vol 41 No 1, 2005, 271-282. |
 Abstract
 Reference
 Full-Text PDF
 Full-Text HTML