-
Paper Information
- Next Paper
- Previous Paper
- Paper Submission
-
Journal Information
- About This Journal
- Editorial Board
- Current Issue
- Archive
- Author Guidelines
- Contact Us
American Journal of Signal Processing
p-ISSN: 2165-9354 e-ISSN: 2165-9362
2012; 2(2): 23-29
doi: 10.5923/j.ajsp.20120202.04
Human Identification Using the Main Loop of the Vectorcardiogram
 Abstract
 Reference
 Full-Text PDF
 Full-Text HTML
M. M. T. Abdelraheem , Hany Selim , Tarik Kamal Abdelhamid
Electrical Engineering, Assiut University, Assiut, Egypt
Correspondence to: M. M. T. Abdelraheem , Electrical Engineering, Assiut University, Assiut, Egypt.
| Email: |  |
Copyright © 2012 Scientific & Academic Publishing. All Rights Reserved.
In this paper a new approach in human identification is introduced, in which the use of the Vectorcardiogram (VCG) main loop as a biometric feature is investigated. The advantage of using VCG over the Electrocardiogram (ECG) is that the shape of the VCG is independent of the heart rate. A test set of 550 VCG’s recorded from 22 healthy individuals measured at different times and with a wide range of heart rate values is used to validate the system. The proposed system uses only the main loop of the VCG for identification. Two different algorithms are used. In the first one, coefficients from specially developed descriptor (the Equal Distance descriptor) are used for identification, and in the second, selected Fourier Descriptor coefficients of the main loop of the VCG are used as biometric data. In both methods Feed Forward Neural Networks are used as classifiers giving identification rates of 99.454% and 95% respectively.
Keywords: Biometrics, Electrocardiogram (ECG), Feature Extraction, Human Identification, VCG, Neural Networks
Article Outline
1. Introduction
- Biometrics provides the way to identify humans based on unique physiological or behavioural characteristics of the individual person. For many years external physiological biometrics like fingerprint, iris recognition and face recognition were used (Jain et al.[1] and Reid,[2]). The problem with such biometrics is that they are considered external physiological biometrics which is easy to mimic and face by fake finger, iris and face photos. This raised the need for an internal physiological biometrics. The electrocardiogram (ECG) signals reflect the electrical activity of the heart and thus reflect the way the heart functions, and reveals its geometry. They are believed to be unique for each individual. For the classification of the individuals, researchers extracted the features either in the time domain or in the transform domain. Many time domain algorithms were proposed; Kyoso et al.[3] extracted their feature parameters from the second order derivative of the electrocardiographic waves, and used discriminant analysis for the identification. They claimed that the system can discriminate between registered ECG’s with an acceptable level of accuracy.Also Biel et al.[4] used a diagnostic ECG device, that automatically extracts the medical features, both chest and limbs-leads were used where 30 features were automatically collected from each of the 12 leads rest ECG for 20 subjects, the number of features were reduced till the best results were obtained by using 10 features from lead I with identification rate of 100% using Multivariate analysis for the identification task. In their paper Shen et al.,[5] and in the doctor Dissertation Shen,[6]ECG signals from 20 normal individuals were used, taken from the MIT-BIH database. In this research two methods were used for the classification process. The first one is template matching and the second one is Decision Based Neural Network (DBNN) whose input is a group of temporal and amplitude features. The results show that template matching gives an identification rate of 95% and the DBNN algorithm gives an identification rate of 80%. Combining the previous two methods first by template matching then by analyzing only the candidate beats by using DBNN an identification rate of 100% was achieved. Again Shen et al.,[7]used template matching and distance classification methods for the same purpose, the identification rate ranged from 95.3% to 100% depending on the size of the tested group. In 2005 Israel et al.,[8] showed the uniqueness of an individual’s ECG by investigating temporal features. 15 temporal features were extracted from neck and chest electrodes; some features were considered constant with the change of the heart rate others were normalized by dividing them by the distance from the start of the P wave to the end of the T wave. This system was tested on a database of 29 subjects at different anxiety conditions with around 81% recognition rate. Kim et al.,[9] measured the R-T, Q-T, and QRS intervals in rest and in physical active mode. The beat-by-beat based discriminatory analysis was performed by applying Malalanobis distance between these intervals. On the other hand, the transform domain attracted the interest of many researchers; some used the multi-resolution wavelet transform as for example Mahmoodabadi et al.[10] with which they detected the QRS complex of the ECG signal. Also Fatemian et al.[11] attained heartbeat delineation using Wavelets. Experimental results for healthy subjects from the PTB and MIT ECG databases indicated an identification rate of 99.61%. Also Discrete Cosine Transform (DCT) was proposed to be used by Wang et al., 2008 in conjunction with autocorrelation. The best results achieved were subject recognition rate of 100%. Also Platantinos et al.[12] suggested a classification based on the coefficients from the DCT of the Autocorrelation sequence of ECG data segments. Normalized Euclidean distance and normalized Gaussian likelihood were applied for classification and achieved recognition rates of between 93% and 100%. Cepstrum analysis was also used by Ming Li et al.[13] where fusion of both temporal and cepstral system outcomes at the score level were used to improve the overall performance of recognition. The proposed hybrid approach achieved 98.3% accuracy. Wahab et al.[14] extracted the feature parameters from the ECG data using Mel-Cepstral Frequency coefficients (MFCC) and Gaussian Mixture Model algorithm. The best identification results were above 91%. Loong et al.[15] used spectral coefficients computed through linear predictive coding (LPC) for the classification. The subject recognition rate reached 100% Tawfik et al.[16] used time normalized QT signal and QRS with DCT for identification giving best results of 99%Apart from this, most of the data was gained from resting subjects where the variability of heart beat was totally ignored. By this kind of data, high rates of recognition were attained reaching almost 100%. Only three exceptions of the above mentioned papers were detected, namely Israel et al.[8], where data was collected from 12 repeat sessions and in each individual session a set of seven two-minute tasks were recorded. The tasks were designed to stimulate different states of anxiety, and the result of classifications was between 82% and 98%. Fatemian et al.[11] reached 99.61% identification through finding a heartbeat template of each subject; representing his/her unique repetitive heartbeat morphology using the median of aligned heartbeats. Yet the ECG data used by Fatemian was taken from the PTB and MIT databases, which are known to show limited variability of heartbeats. Wahab et al.,[14]recorded the ECG data for 5 times on each subject to introduce heart beat variability to a certain extent (as mentioned). Their best identification result was above 91%.In this paper stress is made on human identification under wide range of heart beat variability. The main loop of the Vectorcardiogram (VCG) is used as a biometric feature. VCG contour is produced by combing the corresponding samples of two ECG lead signals perpendicular to each other (figure 1), which are recorded at the same time. The VCG contour consists of three loops one produced from the P wave, one from the T wave and the main loop from the QRS complex, which contains the most important features. The use of the VCG main loop as a biometric feature is found to allow the independence of identification of the heart beat value. Thus the main advantage of using VCG over the ECG is that the shape of the VCG is independent of the heart rate. The remainder of this paper is organized as follows: In section 2 the collection of ECG data is described with the stress on heart rate variability. Section 3 describes the preprocessing of the ECG signal; this includes filtering, averaging over many complete ECG signals, and adjusting spacing between points on the VCG main loop. The details of the descriptors used, namely the Equal Distance Descriptor and the Fourier Descriptor, are detailed in sections 4 and 5. The neural networks used for each of the chosen descriptors are detailed in section 6. Results and comparison between the proposed methods and related work are presented in section 7. Section 8 concludes the paper.
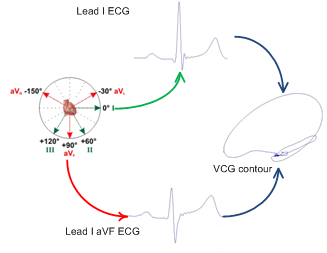 | Figure 1. VCG construction from lead I and lead aVF |
2. ECG Data Collection
- Most of the research done for the classification of persons based on their ECG signals uses one of two standard databases or both, namely the PTB database and the MIT-BIH Normal Sinus Rhythm Database. As these databases were intended for the diagnostic of heart diseases, they include records for both healthy and mainly for diseased subjects. Researchers used to select records of a number of healthy subjects. Although these databases are standard and can allow comparison between different research results, yet they have the major drawback of having limited or no variability of heart rate. In real life situations, a subject to be recognized may be in an anxiety state, correspondingly having a heart beat, that is different from the one he/she had as the database was built, thus, it is vital for an identification system to be heart rate independent. For this reason, the data used for this investigation was self collected from 22 healthy people, 20 males and 2 females between the age of 22 and 61 years. They are all either students or employees. The equipment used for collecting the data is the “Philips Pagewriter Trim II” with 500 Hz sampling rate and 24 bit A/D conversion providing 5μV resolution. The aim of the measurement sessions was to build a VCG database that is convenient to validate the ability of using the VCG for the purpose of human identification. This was done by recording the VCG’s with a relatively wide range of heart rates for each subject at the different test sessions to simulate different conditions occurring in the real life. The ECG records of each subject were collected at separated times and under different conditions. Only two leads were used lead I and lead aVF which were sufficient to produce the required VCG contour (see figure 1), where the subject was asked to place 2 electrodes on his hands and 2 electrodes on his legs, these electrodes enabled to record the limb and the augmented leads. To reduce the noise due to the movement of the subject he/she was asked to sit down while recording the signal. This was done in a normal daylight illuminated room. The recording started immediately after the subject sat down to preserve the heart rate caused by his/her previous activity, whether it was walking, climbing the stairs speaking loudly ...etc.Each subject has 25 ten-second Lead I and aVF records collected within a four months period. The ten-second duration was dictated by the maximum recording duration of the data collecting device; the “Philips Pagewriter Trim II”. Yet, it was found that this duration was sufficient to obtain an average full ECG signal. To cover the 25 sessions/subject, and to have biweekly sessions for each one, a three month period would have been needed. This however, was extended to four months as some subjects failed to show in the appointed time. In the light of the literature review it is found that the most critical problem associated with using ECG as a biometric data is the heart rate variability. Figure 2 demonstrates the heart rate variability of the 22 subjects, showing the recorded maximum and minimum heart rates during the 25 sessions.
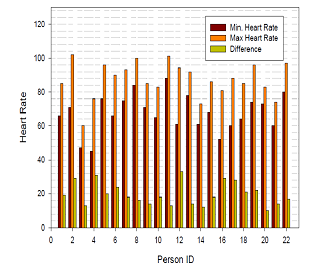 | Figure 2. The change of Heart Rate for each subject |
3. ECG Signal Preprocessing
- The ECG and likewise the VCG signal contain high and low frequency noise components. It is known that the ECG signal contains three sources of noise1) The low frequency noise: Baseline wondering due to perspiration, respiration, body movements, and poor electrode contact. This source of noise has a spectral content usually below 1 Hz.2) Power line interference (50 Hz) due to poor grounding of the ECG equipment. 3) High frequency noise that appears within individual Heart Beats. To remove these noise components the recorded ECG signal is filtered by using a Butterworth bandpass filter with cutoff frequencies of 1Hz and 40Hz resulting in a signal containing the useful spectrum of the ECG signal (Sörnmo et al.[17]). After filtering, individual complete ECG signals are extracted from each record. As the QRS wave shows great stability with the change of the Heart Rate on the contrary to both the T and P waves, the end of the T wave point and the boundaries of the QRS complex are delineated by using minimum radius of curvature method suggested by Isreal et al.[8]. The signals are then aligned by the R waves and averaged to produce one complete ECG signal representing each record. The amplitude of the signal is then normalized by dividing it by the value of the peak of the R wave. For the identification process the two small loops of the VCG are discarded due to their relative small effect on identification and only the main loop representing the QRS complex is used. The main loop of the VCG is constructed by plotting Lead I QRS signal on the x-axis against lead aVF signal on the y-axis giving the projection of the VCG main loop in the vertical plane. The shape of the VCG is heart rate independent but the location of the points on the contour carry the time information from the ECG signal and thus has unequal distances. To prepare the contour to be processed by the proposed descriptors the contour is reproduced but with 100 equally spaced points while preserving its original shape as shown in figure 3 and described by Tawfik[19].
4. Equal Distance Descriptor
- A Special descriptor was developed for the use of the VCG as a biometric feature. Depending on the previous step of reproducing the contour to be equally spaced, this descriptor is represented by the distances of different points on the contour from a certain point called the ‘eye point’ and normalized by dividing it by the length of the contour. The location of the eye point was at first chosen to be at the centroid of the contour, however, this choice caused a high error sensitivity when the centroid was very near to the boundary of the contour (inside or outside). In such cases, and for the same subject, a small change in the position of the centroid across the boundary of the contour resulted in a completely different set of descriptor data. It was therefore decided to locate the eye point at the lower right corner of the contour to avoid such problem (see figure 4). Also the Starting point was chosen to be corresponding to the first recorded point in time.
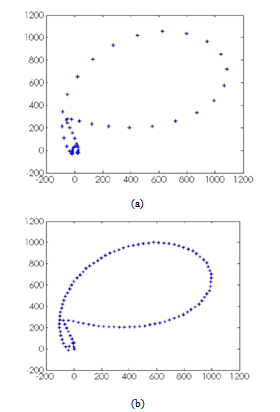 | Figure 3. VCG contour before reallocating (a), and after reallocating points (b) |
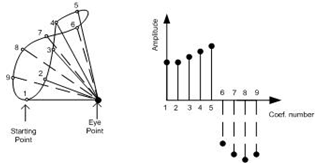 | Figure 4. VCG complex contour and the corresponding equal distance descriptor coefficients |
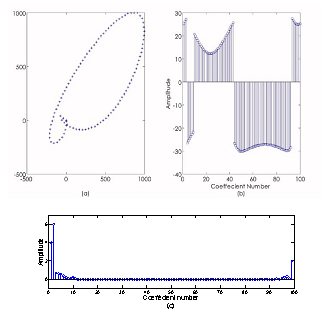 | Figure 5. (a)VCG main loop contour (b) The corresponding equal distance Descriptor (c) The corresponding Fourier Descriptor |
5. Fourier Descriptor
- Representing the VCG points as complex numbers
 | (1) |
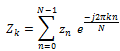 | (2) |
6. Neural Network Classifier
- Artificial neural networks (ANN’s) are based on the present understanding of biological nervous system. ANN’s have been trained to perform complex functions in various fields of application including pattern recognition, identification, and classification. The neural network system consists of many layers: one input layer, one or more hidden layers and one output layer. The input layer represents the set of features to be classified. The hidden layers consist of many interconnected artificial neurons working in parallel to model the relationship between the input layer and the output layer. The output layer has a number of output terminals equal to the number of subjects to be classified. For each of the above descriptors a corresponding neural network is used having a number of inputs ‘ni’ in the input layer equal to the number of selected descriptor coefficients, one hidden layer and one output layer having a number ‘no’ of nodes equal to the number of candidates. For the Equal Distance Descriptor, each fourth coefficient out of the available 100 coefficients is taken, so that only 25 coefficients are used. Thus the computed coefficients are introduced to a Neural Network classifier with 25 nodes in its input layer. The number of nodes of the hidden layer was optimized for the best classification, so that 40 nodes were used in this layer. As the number of subjects was 22 the output layer has 22 nodes.For the Fourier Descriptor, after discarding the first coefficient to achieve translation invariance, and dropping the second coefficient as it is always equal to 1 to achieve scaling invariance as described previously, the first 8 coefficients and the last 8 coefficients are introduced to the neural network classifier, which thus has a number of input nodes ni of 16. The number of nodes of the hidden layer was optimized for the best classification, so that 30 nodes were used in this layer. Again the number of nodes of the output layer is 22 to indicate the 22 candidates.The Neural Networks are trained using the back propagation learning algorithm. Each neural network is trained to accept the candidate’s coefficients vector and to clamp his/her output node at one and to reject other candidates’ coefficient vectors by clamping there output nodes to zero. The Neural Networks are trained by 15 data sets per subject chosen randomly, and 10 data sets are used for testing. If the output clamping is not used, the output with the maximum value would represent the accepted subject. In this case a new subject not in the database will, depending on the allowed error, either give a false acceptance or will be rejected. Both ANN’s were simulated using Matlab 2007 software.
7. Results and Discussion
- Figure 6 depicts for each of the 22 candidates ten recorded main loops of the VCG’s plotted on each other, just to show the similarity of VCG contours/subject.It is clearly seen that each subject has his/her characteristic VCG contour differing from all other subjects’ contours. The VCG main loop of a subject to be identified is constructed from the preprocessed QRS complex from Lead aVF against that of lead I, where both of them are recorded at the same time. The resulting contour is reshaped to get equal distances between its adjacent points, and then processed by one of the two proposed descriptors. The resulting descriptor coefficients are introduced to the corresponding feed forward Neural Network classifier described above. The output of the ANN indicates the identified candidate.For the Equal Distance Descriptor, the correct identification was found to be 209 out of the 220 VCG test records, giving an identification rate of 95%.By the Fourier Descriptor, on the other hand, the correct identification was found to be 219 out of 220 giving an identification rate of 99.454%.
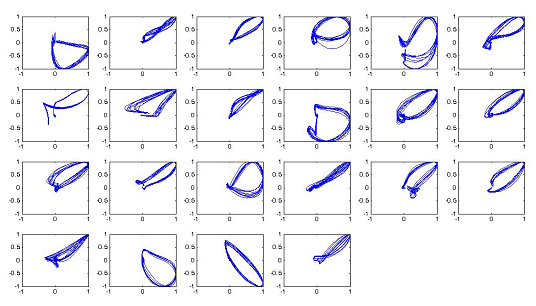 | Figure 6. VCG contours for each subject plotted on each other for the all 22 subjects |
- Table 1 below shows a comparison summery between the proposed methods and related work. Although some previous work shows better results achieving up to 100 % identification rate but it should be taken into consideration that these results were validated using resting ECG signals that don’t face the challenge of heart rate change which is considered the most critical problem facing the use of ECG as a biometric feature.
8. Conclusions
- In this paper novel ECG biometric algorithms in the time domain are presented and evaluated. A database consisting of 22 healthy individuals was constructed containing a wide range of heart rate values. The algorithms perform the subject recognition through the following stages: ECG preprocessing, constructing the main loop of the VCG contour, reproducing the contour with equally spaced points, building the descriptor (either the Equal Distance or Fourier descriptor), then classifying using the appropriate ANN, where the system identifies the subject using its trained Neural Network.The identification rate attained was 99.454% for Fourier descriptor and 95% for equal distance descriptor.As The main limitation of ECG and correspondingly of VCG would be for excessive heart rates. The Effect of excessive heart rates, heart diseases and long term stability need to be investigated. Future work would include a detailed study of heart diseases and their effects on the ability of using the developed algorithms for human identification. Also an interesting topic is to study the ability of the algorithm to discriminate between twins.
ACKNOWLEDGEMENTS
- This research was sponsored by Information Technology Industrial Developing agency “ITIDA” through the Information Technology Academic Collaboration Initiative “ITAC”.
References
| [1] | Jain, A., Bolle, R., and Pankanti, S. ‘Biometrics: Personal Identification in Networked Society’, New York, USA: Kluwer Academic Publishers, 1st Ed, 2002 |
| [2] | Reid, P.: ‘Biometrics for network security’, Upper Saddle River, N.J.: Prentice Hall PTR. 252 p, 2004. |
| [3] | Kyoso, M. and Uchiyama, A.: ’Development of an ECG identification system’. In Proceedings of the 23rd Annual International Conference of the IEEE Engineering in Medicine and Biology Society, volume 4, pages 3721 – 3723, Istanbul, Turkey, 2001. |
| [4] | Biel, L., Pettersson, O., Philipson, L. and Wide, P. ‘ECG analysis: a new approach in human identification’. IEEE Transactions on Instrumentation and Measurement, 50(3): p. 808-812, 2001. |
| [5] | Shen, T., Tompkins, W., and Hu, Y.: ‘One-lead ECG for identity verification’, Conference and the Annual Fall Meeting of the Biomedical Engineering Society] EMBS/BMES Conference, 2002. Proceedings of the Second Joint, Vol. 1 (2002), pp. 62-63 vol.1-62-63 vol.1. , 2002. |
| [6] | Shen, T.W. ’Biometric Identity Verification Based on Electrocardiogram (ECG)’, Dissertation Doctor of Philosophy (Biomedical Engineering) at the University of Wisconson – Madison, 2005 |
| [7] | Shen, T.W., Tompkins, W.J., and Hu, Y.H.: ‘Implementation of a one-lead ECG human identification system on a normal population’, Journal of Engineering and Computer Innovations Vol. 2(1), pp. 12-21, January,2011 |
| [8] | Israel, S. A., Irvineb, J. M., Chengb, A., D.Wiederholdc, M., and Wiederholdd, B.K.: ‘ECG to identify individuals’, Pattern Recognition Society, 38(1): p. 133-142, 2005. |
| [9] | Kim, K.S., Yoon, T.-H., Lee, J.-W., Kim, D.-J., and Koo, H.-S.A.: ‘A Robust Human Identification by Normalized Time Domain Features of Electrocardiogram’ in Engineering in Medicine and Biology 27th Annual Conference. 2005. Shanghai, China, September 1-4, IEEE, 2005. |
| [10] | Mahmoodabadi, S. Z., Ahmadian, A., Abolhasani, M. D. ’ECG feature extraction using Daubechies wavelets’, Proceedings of the fifth IASTED International Conference Visualization, Imaging and Image Processing, September 7-9, 2005, Benidorm Spain, pp.343-348,2005. |
| [11] | Fatemian, S.Z. Hatzinakos, D. ‘A new ECG feature extractor for biometric recognition’, 16th International Conference on Digital Signal Processing, 2009, Santorini-Hellas, July 2009, pp. 1 – 6, 2009. |
| [12] | Plataniotis, K., Hatzinakos, D., and Lee, J.: ‘ECG biometric recognition without fiducial detection’. In Biometrics Symposium: Special Session on Research at the Biometric Consortium Conference, pages 1 – 6, Baltimore, MD, 2006. |
| [13] | Li, M., Narayanan, S. ‘Robust ECG Biometrics by Fusing Temporal and Cepstral Information’, Signal Analysis and Interpretation Laboratory, University of Southern California. 2011http://wwwscf.usc.edu/~mingli/paper/ICPR10_Poster_mli.pdf (visited 2011) |
| [14] | Wahab, A., and Zhengning, W. ‘ECG biometric system’, Center for Computational Intelligent, School of Computer Engineering Nanyang Technological University, Blk N4 #2A-36, Nanyang Avenue, Singapore 639798, 2011 http://nguyendangbinh.org/Proceedings/IPCV08/Papers/ICA3334.pdf (visited 2011) |
| [15] | Loong, J.L.C., Subari, K.S., Besar, R. and Abdullah, M.K. ‘A New Approach to ECG Biometric Systems: A Comparitive Study between LPC and WPD Systems’, World Academy of Science, Engineering and Technology 68 2010, PP.759-764, 2010. |
| [16] | Tawfik, Mohamed M., Selim, Hany, and Kamal, Tarek ‘Human Identification using time normalized QT signal and the QRS complex of the ECG’, 7th CSNDSP 21-23 July 2010 University of Northumberia at Newcastle U.K., SIP-4 pp.831-835,2010 |
| [17] | Sörnmo, L., and Laguna, P. ‘Bioelectrical signal processing in cardiac and neurological applications’, Amsterdam; Boston: Elsevier Academic Press. xiii, 668 p. 2005. |
| [18] | Wang, Yongjin, Agrafioti, F., Hatzinakos, F., and Plataniotis, K. N. ‘Analysis of human electrocardiogram for biometric recognition’ EURASIP Journal on Advances in Signal Processing Volume 2008, Article ID 148658, 11 pages 2008 |
| [19] | Tawfik, Mohamed M. ‘Human Identification using ECG signal’, MSc. thesis, Assiut University, Egypt. 2010 |
| [20] | Gonzalez, Rafael C. and Woods, Richard E.: ‘Digital Image Processing’, Second edition, Prentice-Hall, Inc. Upper Saddle River, New Jersey 07458, 2002 |