-
Paper Information
- Next Paper
- Previous Paper
- Paper Submission
-
Journal Information
- About This Journal
- Editorial Board
- Current Issue
- Archive
- Author Guidelines
- Contact Us
American Journal of Signal Processing
p-ISSN: 2165-9354 e-ISSN: 2165-9362
2012; 2(2): 10-14
doi: 10.5923/j.ajsp.20120202.02
Using Statistical Histogram Based EM Algorithm for Apple Defect Detection
Ghobad Moradi 1, Mousa Shamsi 2, Mohammad H. Sedaaghi 2, Setareh Moradi 3
1Department of Electrical Engineering, Faculty of Engineering,Ravansar Branch,Islamic Azad University, Kermanshah, Iran
2Department of Electrical Engineering, Faculty of Electrical Engineering Sahand University of Technology Tabriz, Iran
3Department of Electrical Engineering, Ravansar Branch, Islamic Azad University, Kermanshah, Iran
Correspondence to: Ghobad Moradi , Department of Electrical Engineering, Faculty of Engineering,Ravansar Branch,Islamic Azad University, Kermanshah, Iran.
| Email: |  |
Copyright © 2012 Scientific & Academic Publishing. All Rights Reserved.
Segmentation of an image into its components plays an important role in most of the image processing applications. In this article an important application of image processing in determination of apple quality is studied, and an automatic algorithm is proposed in order to determine apples skin color defects. First, this image is converted from RGB to color space L*a*b*. Then fruit shape is extracted by ACM algorithm. Finally, the image has segmented using SHEM algorithm. Experimental results on the acquired images show that both EM and SHEM spend the same iterations to accomplish the segmentation process and get the same results. However, the proposed SHEM algorithm consumes less time than the standard EM algorithm.Accuracy of the proposed algorithm on the acquired images is 91.72% and 94.86% for healthy pixels and defected ones, respectively.In this paper, the proposed method has only been evaluated on green and yellow apples.
Keywords: Image Segmentation, Apple Defects, Color Space, Statistical Histogram, Expectation Maximization Algorithm, Active Counter Model
Article Outline
1. Introduction
- Increasing customer knowledge about product quality leads to competitive fruits and vegetable trade. High quality is the main reason for survival of fruits commerce. Always, producing high quality products and using image processing in investigation of its quality are important[1,2]. In traditional reliable quality method, human operators are used. It is boring and time consuming[3,4]. For example most of the food products are clustered by seasonal workers. Work shift is sometimes long and working condition is hard and mostly there is time limitation for reliability of products freshness. Clustering is a repetitive and boring affair needs to long term periods[5]. So, it may effects the products quality performance. Thus, machine vision is used for quality evaluation and sorting of fruits like apple based on quality. Since it will increase speed and also decrease human error in sorting procedure.In[6], a Gaussian and Bayesian model has been presented for segmentation of ‘Golden Delicious’ and ‘Jonagold’ apples. Also, a hierarchical grading method and k-means clustering for a real-time grading system by which he reached 73% correct classification. Nakano used neural networks for color grading of ‘San Fuji’ apples from color images. Rennick et al. used a controlled acquisition system and different classifiers for ‘Granny Smith’ apples. Miller etal. used spectral reflectance properties of apples, whereas Yang and Marchant used snakes and a flooding algorithm to detect blemishes. Wen and Tao built a rule-based, near- infrared, automated vegetable sorting system and reached rates of more than 80%, but misclassified stem and calyx regions as defected. Pla etal. built automated apple sorting system with weight sensors, infrared, color and ultra-violet images[6]. In[7], Fourier analysis on apples was used for study of quality. Also, in our previous works,[8,9], we have analysed pomegranate internal structures using MR images.In presence of several and complex features, human error is increased in product clustering. In[10] an algorithm was proposed for detection and removing of shadow in fruits color images in HSV color space by using homomorphic filter, that employing intensity component in HSV color space relative to gray images and red component in RGB color space indicates the best results in omitting images shadow.This article is organized as follows: In section 2, the data set is described. The proposed algorithm is discussed in Section 3. Finally, in Section 4 the experimental results are demonstrated. Section 5 concludes the paper.
2. Proposed Algorithm
- Figure 1 shows flowchart of the proposed algorithm. For color image segmentation converted from RGB to color space L*a*b*. Because with survey of color histogram in each different color spaces, it is observed that the color space L*a*b* provides better feature space for segmentation of color images than other color spaces. Then, the shape of apple image is extracted by active counter model (ACM) algorithm, and finally, the statistical histogram based expectation maximization (SHEM) algorithm is presented to segment healthy and defected areas of the apple.
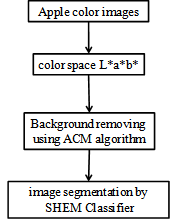 | Figure 1. Proposed algorithm |
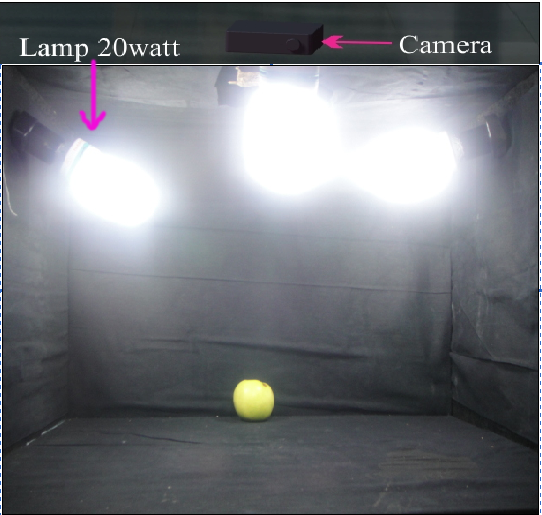 | Figure 2. Illumination chamber |
2.1. Image acquisition
- Apple is an important export cultivar in Iran, were harvested from the apples orchard in research station of Kermanshah. The fruits consist of various types of external defects in different sizes. The images were taken by a 3-CCD matrix type camera (DSC-T900, Sony) from one-view. The camera was placed at about 400 mm from the top of the fruit and was able to take 640×480 pixels images, with a color resolution of 3×8 bits per pixel. The illumination chamber was designed in order to provide diffuse illumination over the fruit surfaces, with the aim of avoiding highlights and light reflections (Figure 2).
2.2. Space ColorL*a*b*
- In this section, the effect of different color space, as a tool to define feature space is reviewed. Each of these color spaces form a three-dimensional vector, which is used as a feature space.By investigating color histogram in different color spaces, it is observed that the color space L*a*b* provide better feature space for segmentation of color images than other color spaces.TheL*a*b*color system is one of the uniform color spaces recommended by CIE in 1976 as a way of more closely representing perceived color and color difference. This system, L* is the lightness factor; a* and b* are the chromaticity co-ordinates[11]:L* (lightness) axis– 0 is black; 100 is white.a* (red-green) axis– positive values are red; negative values are green; 0 is neutral.b* (yellow-blue) axis – positive values are yellow; negative values are blue; 0 is neutral. The lightness factor L* and chromaticity coordinates a* and b* are defined as follows:
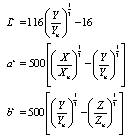 | (1) |
2.3. Apple shape extraction using ACM algorithm
- Model-based approaches towards image interpretation named deformable models have proven very successful. Among the earliest and most well-known deformable models is the ACM known as snakes proposed by Kass[12]. We have used ACM for removing the background, because the precision of ACM outperforms simple thresholding methods especially when defects exist near the edges on apple image. Simple threshold classifies the pixels belonging to apple (foreground) when the intensity of the pixels for apple is equal to the intensity of the background. However, such error approaches to zero in ACM. We have utilized a primary contour whose size is similar to that of apple. It will speed up ACM thus leading to few iterations and high conversion rates. A snake is an energy minimizing parametric contour that deforms over a series of time steps. Each element along the contour u depends on two parameters, where the space parameter s is taken to vary between 0 and N–1, and t is time (iteration):
 | (2) |
 of the model is calculated by the sum of the energy for the individual snake elements:
 | (3) |
 | (4) |
 ) regulates the constraints arranged on the model tension and stiffness. The external energy (
 ) is represented by external constraints imposed by high-level sources such as human operators or automatic initialization procedures.The image (potential) energy,(
  ), drives the model towards the significant features, usually attributed by light and dark lines, edges or terminations[13].The internal energy of a snake element is defined as:
 | (5) |
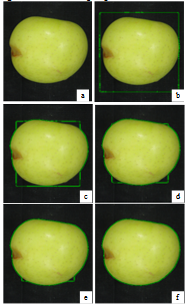 | Figure 3. Energy minimization in ACM algorithm |
 | (6) |
2.4. Statistical Histogram Based EM Algorithm
- As proposed in the publications (e.g.,[14,15]), we assume here the image intensity corresponding to a class can be well modeled as a multivariate Gaussian distribution.
 | (7) |
 is the vector of parameter associate with each type of class k,
  is the mean vector, and
  is the covariance (positive definite symmetric) matrix associate with class k,
  where C is the number of classes, M is the number of channels or spectra in the image, and T denotes matrix transpose. In this paper, we consider only a single-channel image (i.e., M=1). The model of (7) can then take the form as follows:
 | (8) |
 is the standard deviation of class k. As the image is the mixture of different classes, and the classes are assumed class-independent. With these assumptions, the likelihood of the image data can be written as:
 | (9) |
 for k=1, 2, … C, n is the total number of the image pixels and
 is the proportion of each class component, where
  . The log-likelihood can then be expressed by:
 | (10) |
 as gray level, where
  is the minimum gray level,
  is the maximum gray level, so the gray scale is
  . For image size
  , at point
 is the gray level with
  . Use His(g) to denote the number of pixels having gray level
 . The statistical histogram function is as follows[18]:
 | (11) |
 and
and .Let i be the intensity of the pixel with
  , and all pixels of the kth class cluster have a mean intensity
  , variance
  , and proportional ratio
  . The C mixed Gaussian distribution can be written as[18]:
 | (12) |
 and
and | (13) |
 | (14) |
 is the posterior probability that intensity i belongs to class k.B. The M-step:The second step updates the unknown parameters with the statistical histogram His (i).
 | (15) |
 | (16) |
 | (17) |
 | (18) |
3. Experimental Result
- Accuracy of segmentation can be evaluated by different ways, depending on the level of evaluation[19,20]. At lowest level, individual pixels are analysed, while more application-specific approaches are used at higher levels (like analysing particular group of pixels). Low-level pixel-based measures can be formulated for defect segmentation problem (pixels can be healthy or defected) by:True positives (TP): number of defected pixels correctly detected.False positives (FP): number of healthy pixels incorrectly detected as defect.True negatives (TN): number of healthy pixels correctly detected.False negatives (FN): number of defected pixels incorrectly detected as healthy.In order to evaluate segmentation performance, following four measures are used, where they are low-level pixel-based ones[21].
 : It depicts recognition error by comparing experimental result with the theoretical one pixel-by-pixel.
 | (19) |
 : Recognition error assumes that classes are equally represented, which is not true for our case where defect sizes highly vary within the database. Hence, calculating class-specific recognition errors (
 ) and averaging them instead can be more enlightening. If a class does not exist (e.g. no defected skin, i.e. fruit in perfect quality), then the error is computed using the other class only.
 | (20) |
 : Sensitivity. It represents the proportion of correctly detected pixels from defected class. Hence, it focuses on defected skin.
 | (21) |
 : It indicates the proportion of correctly detected pixels from healthy class; therefore, it concentrates on healthy skin.
 | (22) |
 ,
, , and high values of
  and
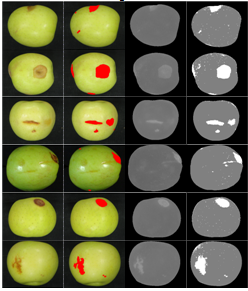
and  . Furthermore, these measures are calculated for each test image, whereas evaluation of a test is estimated, as the average of measures of all test images.As shown in Table 1, an algorithm with minimum errors of E1, E2 has been proposed, Accuracy of the algorithm for detection of healthy pixels and defected ones are 91.72% and 94.86%, respectively. The segmentation algorithm results are shown in figure 3. Original images are shown in first column. Second column shows the manually segmented images and third column shows converted RGB image to L*a*b*color space. It should be mentioned that, in this case, component a*, is used as feature space. Finally, the segmented images of the fruit by the proposed SHEM algorithm are shown in fourth column. Visually, it can be seen that the selected color space L*a*b* is the better color space feature vector for extraction of defects. It is also mentioned our vast experimental results show that SHEM consumes less time than the standard EM algorithm. So, in this paper, an algorithm with high accuracy and speed is proposed for segmentation of apple’s images.
|
4.Conclusions
- In this paper, an important application of image processing in determination of apple quality is mentioned and an automatic algorithm is presented in order to determine apples skin color defects. The algorithm consists of three stages: First of all, the image was converted from RGB to color space L*a*b*. Secondly, fruit shape was extracted using ACM algorithm. At last, in the third stage, the image is segmented by using SHEM algorithm. Experimental results on the apple’s data set indicate that both EM and SHEM spend same iterations to accomplish the segmentation process and obtain the same results. But the proposed SHEM algorithm consumes less time than the standard EM algorithm. Accuracy of the proposed algorithm on the acquired images was 91.72% and 94.86% for healthy pixels and defected ones, respectively.The methods mentioned in introduction are of type supervised and have been applied on datasets which we do nothave access to. Moreover, our proposed method is of type unsupervised. We have compared the proposed method with EM-based ones leading to similar results. However the proposed method (SHEM) outperforms the EM-based algorithms from the speed point of view (it is roughly 60 times faster).
Appendix
- The apple images segmentation result: First column: the original images, Second column: the manually segmented image, Third column: a* components of the color images, Fourth column: the SHEM algorithm results.
|
 Abstract
 Reference
 Full-Text PDF
 Full-Text HTML
