Dominic Mathew 1, V.P. Devassia 2, Tessamma Thomas 3
1Department of Applied Electronics & Instrumentation, Rajagiri School of Engineering & Technology, M.G. University
2Kakkanad, Cochin, Kerala, Pin , 682039, India
3College of Engineering, Cochin University, Chengannur, Kerala, Pin , 689121, India
Correspondence to: Dominic Mathew , Department of Applied Electronics & Instrumentation, Rajagiri School of Engineering & Technology, M.G. University.
| Email: |  |
Copyright © 2012 Scientific & Academic Publishing. All Rights Reserved.
Abstract
An improved method to compress of pseudo-periodic 1-dimensional signals like voiced speech, music, ECG etc is suggested. The pitch synchronous property of such signals is utilized to increase the efficiency of compression, to minimize losses and thus to enhance the quality of the reconstruction. Results show higher signal to noise ratio, higher compression ratio and lower percentage distortion with the new method of 2-D compression as compared to 1-D compression. A new method employing the k-means clustering algorithm is used to determine the periodicity of signals.
Keywords:
Pitch-synchronous, 2-D Wavelet Transform, K- means Clustering, Compression
Cite this paper:
Dominic Mathew , V.P. Devassia , Tessamma Thomas , "Compression of Pseudo-periodic Signals Using 2D Wavelet Transform", American Journal of Signal Processing, Vol. 1 No. 2, 2011, pp. 46-50. doi: 10.5923/j.ajsp.20110102.08.
1. Introduction
Generally for any signal compression method larger compression ratios result in higher signal losses, leading to poorer quality of the reconstructed signal. Signals like voiced speech, music ECG etc, exhibit oscillatory nature[1]. These signals though not perfectly periodic, can be classified as pseudo-periodic. Once its periodicity is known the signal can be represented in a 2-D form and decomposed using two-dimensional wavelets. Wavelet transform methods have proved to be very powerful techniques for signal compression. The signal represented in 2-D form and transformed into the time-frequency domain is well suited for detection and removal of redundancies. In this paper a new algorithm is proposed to minimize losses and to improve compression efficiency using 2-D wavelet transform. The study was conducted on speech, music and ECG signals. A novel and fast method employing the k-means clustering algorithm is used for extracting the periodicity of signals.
2. The Proposed Method
The proposed method consists of the following steps 1) Pre-processing, 2) Pitch-synchronous representation, 3) 2D wavelet decomposition, 4) Reduction of the total number of wavelet coefficients.这里因为没有使用正确的样式漏掉了,样式名称为 SAP10-Paragraph
2.1. Pre-processing
A sampling frequency of 8 KHz is used for the signals. It is then filtered using a 2nd order butter-worth filter to remove the high frequency hum and noise. It is then amplitude normalized to eliminate the effects in signal characteristics recorded under various conditions The pitch peaks are detected using the k-means clustering algorithm[3]. The statistical approach of clustering eliminates the discrepancies of pitch period measurements due to pseudo-periodicity of the signals. Thus it helps to filter out the dominant peaks in the signal samples and eliminates the non-relevant ones. The squared Euclidean distance method is used as the criterion for clustering since it is the simplest and fastest. The Euclidean distance measure is given by the following equation 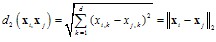 | (1) |
where x is a single data vector used for clustering, i and j are the ith and jth data vectors (patterns) and d is the dimensionality of the data vector[4].The dominant peaks in the signal determine the pitch periods. The number of signal samples between the peaks denotes the pitch period length.
2.2. Pitch -synchronous Representation
Once the period between the peaks are known, a pseudo- periodic signal s(n) with N samples can be assumed to be a sequence of P(k) pitch periods [1]. Each period length is stored in a vector v(k) = [v0(k), v1(k), ….vP(k) – 1(k)]T. The vector components vq (k) can be expressed in terms of the signal s(n) as follows  | (2) |
这里因为没有使用正确的样式漏掉了,样式名称为 SAP10-Paragraph
2.3. Two-Dimensional Wavelet Decomposition
The 2D discrete wavelet decomposition of the PS form can be represented as sum of coarse resolution (level J) approximation coefficients and a sum of fine to coarse resolution (levels 1 to J) detail coefficients[5]. There are 3 types of detail coefficients and basis functions: vertical, horizontal and diagonal details. The transform coefficients are given approximately by the integrals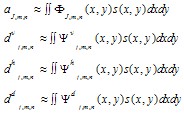 | (3) |
where aJ,m,n represents the approximation coefficients at level J and dvj,m,n, dhj,m,n, ddj,m,n are the vertical, horizontal and diagonal detail coefficients respectively. The 2D basis functions are generated from the father wavelet Φ and mother wavelets Ψv, Ψh and Ψd by scaling and translation as follows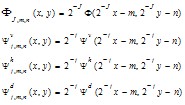 | (4) |
The 2D wavelet analysis of PS representation of the 1D signal can be considered a multi-resolutional image analysis[6]. Multi-resolutional analysis is a simultaneous representation on different threshold levels. This can be considered the output of successive convolution operations on an input sequence with high-pass and low-pass filters[7]. The impulse response of these high and low pass filters are represented separately.The 2-D data matrix is decomposed into four separable bands. This results in four transform components consisting of approximation (low-low), horizontal details (low-high), vertical details (high-low) and diagonal details (high-high) for each resolution level. The decomposition operations are repeated on the low-low band in each level to compute the wavelet transform at the subsequent level. Due to the dyadic nature of discrete wavelet transforms the output is down-sampled by two in each stage.
2.4. Reduction of Transform Coefficients
The wavelet transform coefficients are represented in 2-D matrix. For any level of decomposition the number of column vectors in each sub-band is represented by J, ds(i) represents the vector coefficient with index i and I represents the length of each vector. Reduction in the number of transform coefficients is achieved using the following algorithm: For J column vectors of approximate and detailed coefficients, the energy of the vector is compared with a threshold ET. If the vector energy is less than ET then all coefficients in that vector is set to zero.for j = 1 to J,if for i = 1 to I; ds(i) = 0;end; end; end;This is justified since the contribution of low energy trans- form vectors in reconstructing the original signal is insignificant.At every level of decomposition the first (j = 1) column vector in each sub-band is retained. The Euclidean distance between any two vectors of equal length is a measure of the similarity/dissimilarity between them. Thereforefor j = 1 to J; for m = 2 to J & m j; if
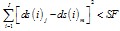 for i = 1 to I;
 =
= ;end; end; end; end;where SF is a similarity factor. The values of j and m are stored for transmission. During reconstruction the integers j and m are used to restore the mth vector with the coefficients of jth vector.If the absolute vector coefficients values are less than a magnitude threshold TH, then it is set to zerofor j = 1 to J;for i = 1 to I ;if
 ,
,  = 0; end; end; end;
3. Evaluation of Reconstructed Signal
The quality of the reconstructed signal is evaluated using standard measures viz. the signal to noise ratio (SNR) and percentage root mean square difference (PRD) as well as the mean opinion score (MOS). The measure of compression is obtained from the compression ratio (CR), is defined as the ratio of the number of the retained coefficients after applying the threshold algorithm to number of the coefficients in the original signal.
3.1. Signal to Noise Ratio
Signal to noise ratio (SNR) is given by the equation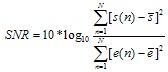 | (5) |
where s(n) is nth sample of the original signal, is the mean of the N signal samples, N is the length of signal, e(n) is the error between the original signal and reconstructed signal, given by s(n) – sr(n), and is the mean of the error signal over N samples.
3.2. Percentage Root Mean Square Difference
Percentage root mean square difference (PRD) is defined by the following equation, 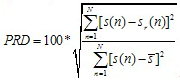 | (6) |
where sr(n) is the nth sample of the reconstructed signal.
3.3. Mean Opinion Score
The mean opinion score (MOS) is calculated by taking the arithmetic mean of the perceived listening quality expressed in terms of scores ranging from 5,4,3,2 and 1 for excellent, good, fair, poor and unsatisfactory respectively. Despite the significant advances in modern measuring and evaluation technology the human ear alone is able to judge the aesthetic or artistic quality of sound[8,9].
4. Results and Conclusions
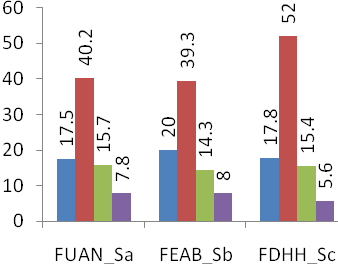
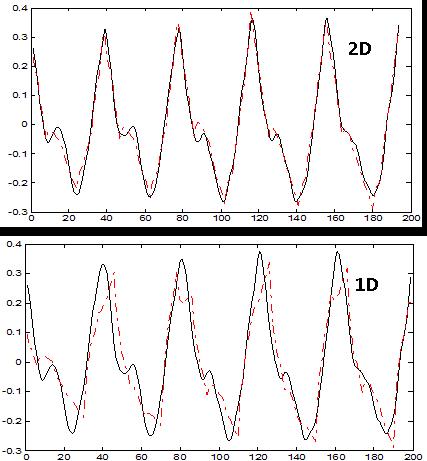
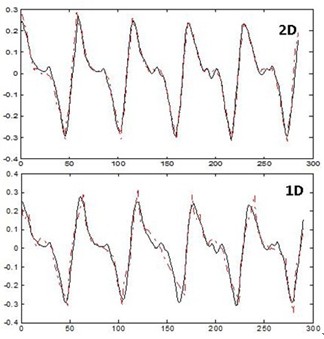
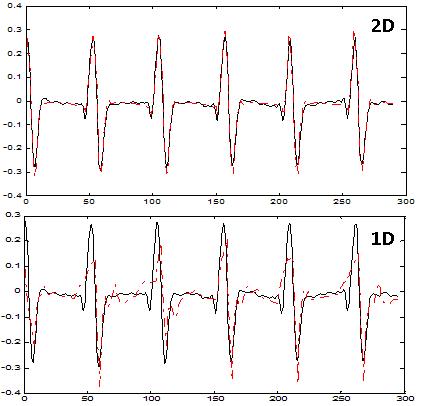
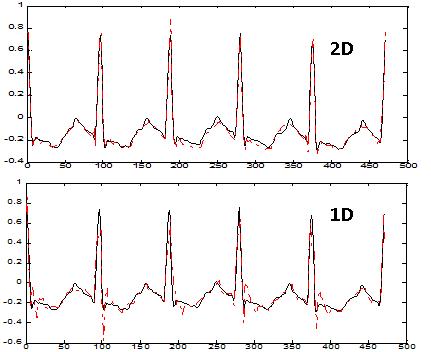
The proposed method was tested on various voiced signal segments selected from speech databases ELSDSR and TIMIT, ECG signals from database MIT-BIH and musical instrument signals like Guitar and Flute. Figures 1 up to 4 show the values of PRD and SNR values obtained on various signal segments with a compression ratio equal to 12. Fig-1 & 2 shows the results of the study done on segments of Male and Female speech signals respectively from the ELSDSR database. It compares the performance of the proposed 2-D compression algorithm, with that of 1-D wavelet decomposition method. ELSDSR Corpus is provided by the Department of Informatics and Mathematical Modelling, Technical University of Denmark. Fig-3 shows results obtained for Female (F1 & F2) and Male (M1 & M2) speech signals from TIMIT. The TIMIT Speech Corpus is provided by DARPA. Fig-4 shows the results for ECG signal - Record 12247-01 from the Massachusetts Institute of Technology and the Beth Israel Hospital (MIT_BIH) compression database and also on typical recorded notes of Guitar and Flute. Fig 5 & 6 shows the variation of PRD and SNR values for different values of CR on speech segment F2 of TIMIT. It clearly shows that the rate of change of PRD and SNR with respect to CR is much lower for the 2D algorithm as compared to 1D algorithm. Figure-7 shows the variation of average MOS values for different values of CR for both 2D and 1D algorithms. The CR values of 5, 10 and 15 were selected so that the differences in quality of the audio signal can be easily perceived. Figs-8 up to 11 show typical segments of the reconstructed signals along with the original signals for various signals with compression ratio of 12:1 for both the 2-D and 1-D compression methods. The original signal is plotted in solid dark line. The reconstructed signal is plotted in dashed red line. Results indicate that the performance of the proposed 2D compression algorithm is more efficient compared to that of compression using 1-D method. For similar PRD and SNR values the 2D method gives higher compression ratios. The proposed 2-D compression method also offers better quality of reconstruction for the same compression ratios over 1-D method. Similarly it is seen that the new method offers better compression ratios if the quality of reconstructed signal is maintained the same as that of 1-D method.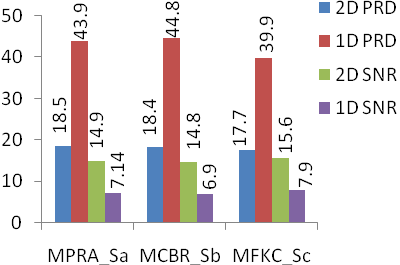 | Figure 1. ELSDSR: Male voice |
 | Figure 2. ELSDSR: Female voice |
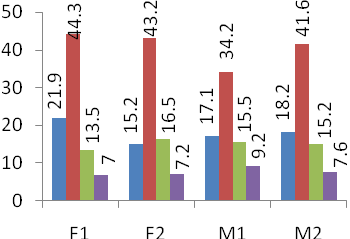 | Figure 3. TIMIT: F1,F2 – Female, M1,M2 – Male |
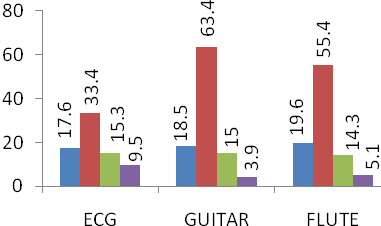 | Figure 4. ECG & Musical Instruments |
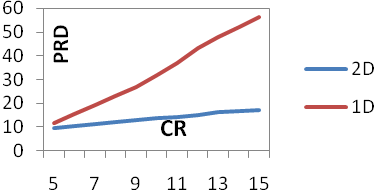 | Figure 5. PRD vs. CR TIMIT (F2) |
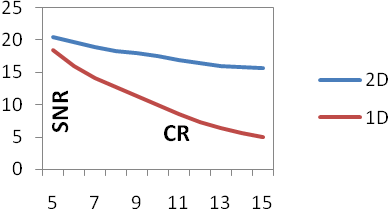 | Figure 6. SNR vs. CR TIMIT (F2) |
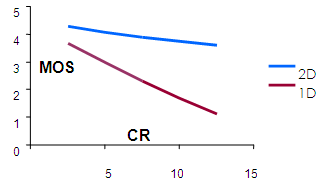 | Figure 7. MOS vs CR |
 | Figure 8. FEAB_Sb |
 | Figure 9. TIMIT (M-1) |
 | Figure 10. GUITAR |
 | Figure 11. ECG - 1224701 (MIT-BIH) |
这里因为没有使用正确的样式漏掉了,样式名称为 SAP27-ReferenceItem
References
| [1] | Gianopaolo Evangelista, “Pitch-Synchronous Wavelet Representations of Speech and Music Signals”, IEEE Trans On Signal Processing”, vol.-41, No.12, December 1993, 3313-3330 |
| [2] | J.I. Agbinya, “Discrete Wavelet Transform Techniques in Speech processing”, IEEE Tencon Digital Signal Processing Applications Proceedings, , 1996, 514-519 |
| [3] | Dominic Mathew, V.P. Devassia, Tessamma Thomas, “A k-means Clustering Algorithm for Pitch Frequency Estimation and Classification of Speech Signals”, Proceedings of the IEEE ICSIP, vol. 1, Macmillan India Ltd, Hubli, 7-9 December 2006, 967-972 |
| [4] | A.K. Jain, M.N. Murthy, P.J. Flynn, “Data Clustering: A Review”, ACM Computing Surveys, vol. 31, No.3, September 1999, 264-323 |
| [5] | Andres Bruce and Hong-Ye Gao, Applied Wavelet Analysis with S-PLUS, , 1996 |
| [6] | S.G. Mallat, “A Theory of Multiresolutional Signal decomposition: The wavelet representation”, IEEE Trans of Patt. Analysis and Mach. Intell, vol. 11, July 1989, 674-693 |
| [7] | S.G. Mallat, “Multifrequency channel decomposition of images and wavelet models”, IEEE Trans of Acoust, Speech, Signal Processing, vol. 37, Dec 1989, 2091 - 2110 |
| [8] | W. Hoeg (Deutsch Telekom Berkom), L. Christensen (Danmarks Radio) R. Walker (BBC), “Subjective assessment of audio quality – the means and methods within EBU”, EBU Technical Review, Winter 1997 |
 Abstract
 Reference
 Full-Text PDF
 Full-Text HTML