Feruza Jamshidovna Khojieva1, Mukhtar Rakhmatovich Amonov2
1Lecturer, Bukhara University of Innovative Education and Medicine, Bukhara, Uzbekistan
2Professor, Bukhara State University, Bukhara, Uzbekistan
Copyright © 2025 The Author(s). Published by Scientific & Academic Publishing.
This work is licensed under the Creative Commons Attribution International License (CC BY).
http://creativecommons.org/licenses/by/4.0/

Abstract
The thermal properties of the composites were studied using TGA (Thermogravimetric Analysis) and DTA (Differential Thermal Analysis) methods. According to the analysis of the composite thermogram, the thermal decomposition of the composite sample due to increasing temperature was characterized by a gradual decrease in the sample mass, occurring at different rates. The influence of electrolyte content on the starch gelatinization process in the polymer composition was determined. The composition of the composite and its microscopic (surface) structure were examined using scanning electron microscopy, and the elemental composition of the components was identified through the analysis of C, O, N, Na, K, and P elements. The effects of temperature and time on the weight loss of sizing polymers were investigated. The derivative thermogram of sizing polymers was studied.
Keywords:
Polymer composition, Final processing, Cotton yarn, Cotton sliver base, Physicochemical methods, Starch, Concentration, Viscosity, X–ray diffraction, IR and NMR spectroscopy, Thermogravimetric Analysis (TGA), Differential Thermal Analysis (DTA), Composite thermogram, Thermal decomposition, Composite sample
Cite this paper: Feruza Jamshidovna Khojieva, Mukhtar Rakhmatovich Amonov, Study of the Polymer Composition Used in the Final Processing of Cotton Yarn on a Cotton Sliver Base Using Physicochemical Methods, American Journal of Polymer Science, Vol. 14 No. 1, 2025, pp. 1-6. doi: 10.5923/j.ajps.20251401.01.
1. Introduction
The rapid increase in the world’s population has led to a growing demand for fabrics made from natural fibers. At the same time, the rapid development of the textile industry has resulted in a year–on–year increase in demand for manufactured products. In particular, the production of sizing compositions based on water–soluble polymers and the application of sizing processes to yarns help improve the physical and mechanical properties of sized yarns. Enhancing the quality and competitiveness of semi–finished and finished materials based on cotton fiber is one of the most critical challenges facing textile industry enterprises. One of the solutions to this issue is the development of efficient, resource–saving technologies aimed at reducing the consumption of imported food–grade starch and chemical reagents used in the sizing process in our country.In recent years, global research and new technological developments in the production of water–soluble polymer compositions have focused on completely replacing or significantly reducing the use of starch, which is classified as a food product. Special attention is being given to scientific research aimed at obtaining effective and high–quality sizing polymer ingredients.
2. Results
In this regard, efforts are being made to develop highly efficient sizing compositions for yarn sizing in textile enterprises. Research focuses on producing sizing agents that form a thin, strong, and elastic film on the yarn surface, determining the adhesion of the obtained sizing compositions to fibers, and assessing their resistance to mechanical impacts. Additionally, particular attention is being given to reducing starch consumption in the sizing process, developing energy– and resource–efficient sizing agents that can replace imported sizing compositions.Various polymer compositions for sizing, based on natural and water–soluble synthetic polymers, have been developed. This article examines the composition and structure of sizing compositions made from different components using physical and chemical research methods.IR spectroscopic analysis of degrading polymers: These sizing polymers consist of a mixture of five different components: starch, Na–CMC, Na–PAA, K–PFC, and K–4, combined in various quantitative (%) ratios. The presence of individual components in the composition has been studied and confirmed using IR and H, S NMR spectroscopy, as well as X–ray fluorescence analysis (XRF) methods.The composition of the composite and its microscopic (surface) structure was studied using scanning electron microscopy (SEM), and the elemental composition of the components was determined through C, O, N, Na, K, and P element analysis (Figure 1).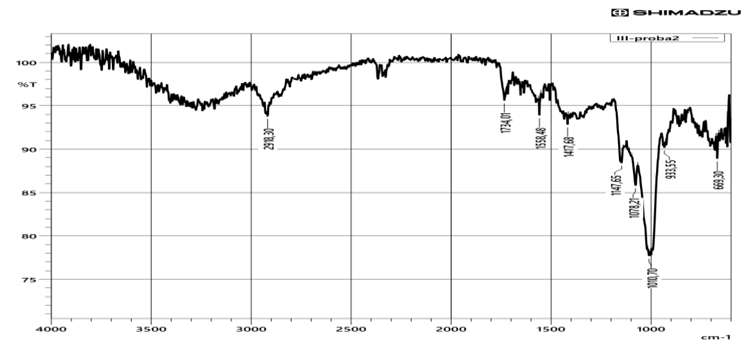 | Figure 1. IR spectrum of sizing polymers based on starch–Na–CMC–Na–PAA–K–PFC–K–4 |
In the polymer composition, intermolecular hydrogen bonds were formed between–ON groups, which exhibited stretching vibrations in the 3295–3273 cm⁻¹ range with moderate intensity. The deformation vibrations of this group were observed at 669 cm⁻¹.Additionally, asymmetric stretching vibrations of –OH groups from starch and Na–CMC (sodium carboxymethyl cellulose), along with the –NH₂ groups from acrylamide molecules, were detected in the 3326–3307 cm⁻¹ range.In the obtained composite’s IR spectrum, asymmetric stretching vibrations of the –CH bond groups in starch, acrylonitrile, and acrylamide molecules were observed at 2918 cm⁻¹, with deformation vibrations of moderate intensity appearing in the 1147–1078 cm⁻¹ range. Asymmetric stretching absorption of –CH₂ groups in the composite was present at 2869–2851 cm⁻¹. The intense stretching vibration of the –CN nitrile group, characteristic of acrylonitrile, was observed at 2259 cm⁻¹. The stretching absorption band of the simple ether –CH–O–CH– groups was found at 1230 cm⁻¹, while its deformation vibration absorption was detected at 933 cm⁻¹. The asymmetric stretching absorption band of the >C=O group appeared at 1734 cm⁻¹, and the stretching vibration bands of –C=C– bonds in acrylonitrile, methyl acrylate, and acrylamide molecules were observed at 1640 cm⁻¹.Thus, the above absorption areas confirm the component composition of the composition, which consists of starch, CMC–Na, methylacrylic ether, acrylonitrile and acrylamide.NMR spectral analysis of degrading polymers: When analyzing the NMR spectrum of the composition, proton signals (600 MHz, Chloroform–CDCl₃ as the solvent, J/Hz) were observed in the starch molecule where the protons at position 1 showed signals at 5.35–5.30 ppm and 4.99–4.96 ppm, the external –CH₂–OH oxymethylene group protons in the starch molecule appeared at 3.94–3.51 ppm, the protons at position 3 in the molecule were observed at 3.88–3.65 ppm and 3.31–3.30 ppm, the protons at position 4 in the molecule appeared at 3.62–3.54 ppm, the protons at position 5 in the molecule showed signals at 4.15–3.75 ppm and 3.26–3.25 ppm, the protons at position 6 in the molecule were observed at 3.36 ppm, 3.16 ppm, and 3.06–3.05 ppm. The protons corresponding to the internal –OH groups in the starch molecule were seen at 4.15 ppm, 3.75 ppm, and 3.19 ppm, while the protons corresponding to the external –OH groups in the molecule showed signals in the 4.52 ppm, 4.10 ppm, 3.90 ppm, 3.69 ppm, and 3.54 ppm ranges.The proton signals in the acrylamide molecule within the sizing polymers were observed as follows: the protons in the =CH₂ group showed signals at 5.90–5.71 ppm, the protons in the =CH– group appeared at 6.41 ppm, and the protons in the –NH₂ groups were detected at 7.31 ppm. Additionally, the carbon atoms in the =CH₂ group of the acrylamide molecule showed signals at 127.30 ppm, the carbon atoms in the =CH– group were observed at 126.85 ppm, and the carbon atoms in the carbonyl (>C=O) group appeared at 170.12 ppm.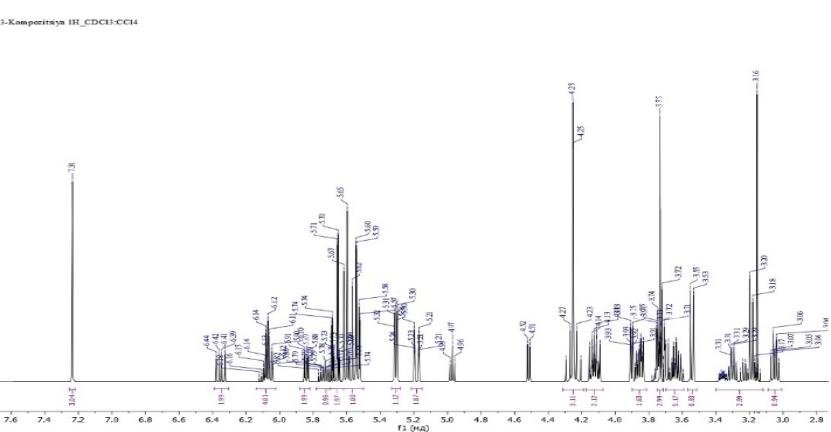 | Figure 2. ¹H NMR spectrum of sizing polymers based on starch–Na–CMC–Na–PAA–K–PFC–K–4 |
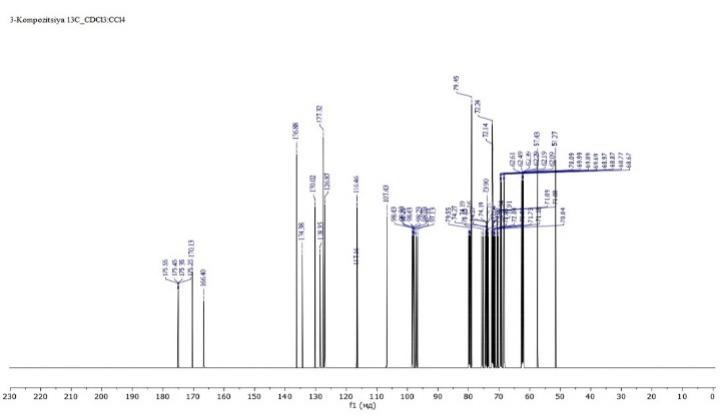 | Figure 3. ¹³C NMR spectrum of sizing polymers based on starch–Na–CMC–Na-PAA–K–PFC–K–4 |
In the composite, the proton signals in the Na–CMC molecule were observed as follows: the protons of the exo–cyclic –CH₂–O–CH₂– ether group appeared at 4.70–4.67 ppm and 3.94–3.51 ppm, the protons at position 3 in the molecule were detected at 3.88–3.65 ppm and 3.31–3.30 ppm, the protons at position 4 in the molecule were observed at 3.62–3.54 ppm, the protons at position 5 in the molecule showed signals at 4.15–3.75 ppm and 3.26–3.25 ppm, the protons at position 6 in the molecule were found at 3.36 ppm, 3.16 ppm, and 3.06–3.05 ppm. The protons corresponding to the internal –OH groups in the Na–CMC molecule appeared at 4.15 ppm, 3.75 ppm, and 3.19 ppm, while the protons corresponding to the external –OH groups were observed at 4.52 ppm, 4.10 ppm, 3.90 ppm, 3.69 ppm, and 3.54 ppm. The analysis of the obtained spectra confirms the composition of the components in the composite.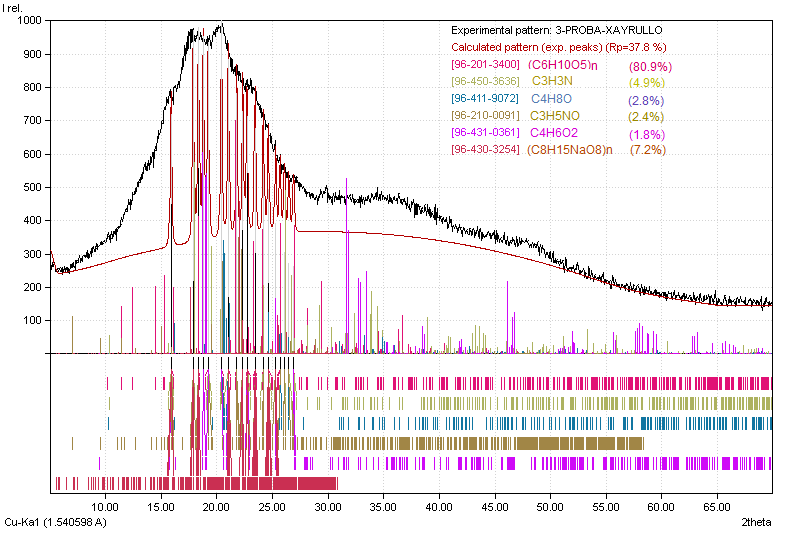 | Figure 4. X–ray analysis of sizing polymers based on starch–Na-CMC–Na–PAA–K–PFC–K–4 |
In the above X–ray diffraction pattern, it is clearly shown that the regions bonded with starch, acryl resin (acrylonitrile, acrylate ester, acrylamide), and sodium carboxymethylcellulose are distinctly represented. Their respective proportions were 80.9%, 4.9%, 2.8%, 2.4%, 1.8%, and 7.2%.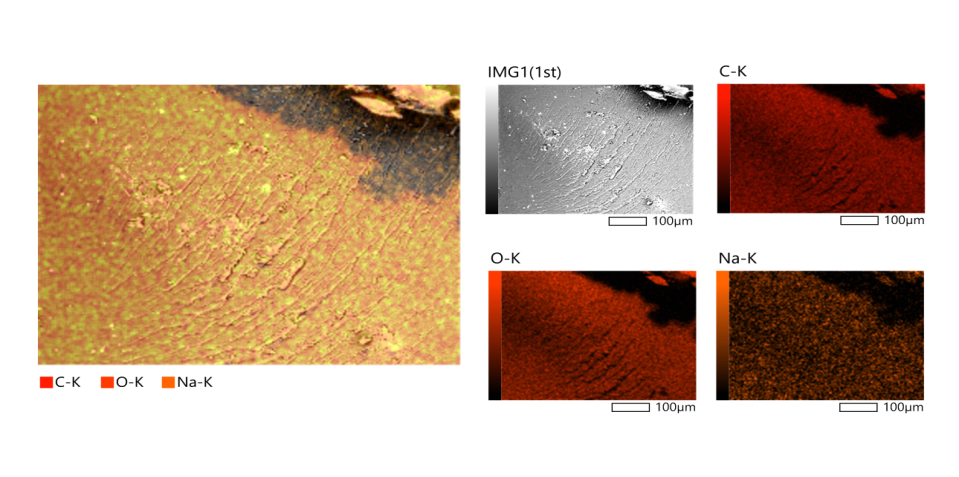 | Figure 5. Scanning electron microscope images of sizing polymers based on starch–Na–CMC–Na–PAA–K–PFC–K–4 |
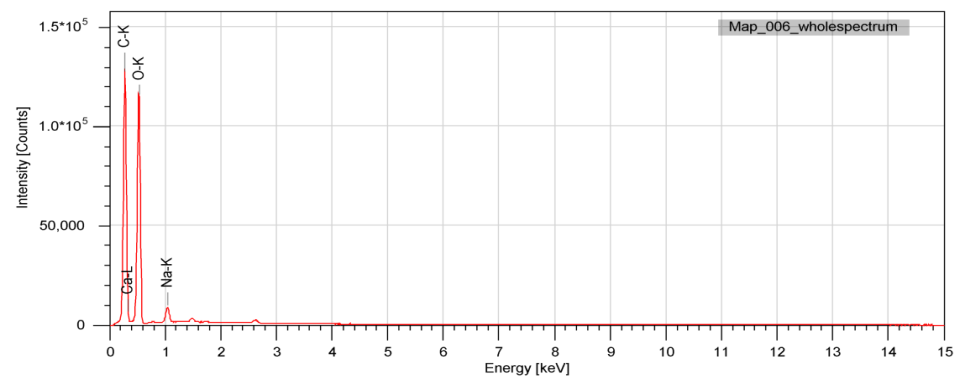 | Figure 6. Elemental analysis of sizing polymers based on starch–Na–CMC–Na-PAA–K–PFC–K–4 obtained from scanning electron microscopy |
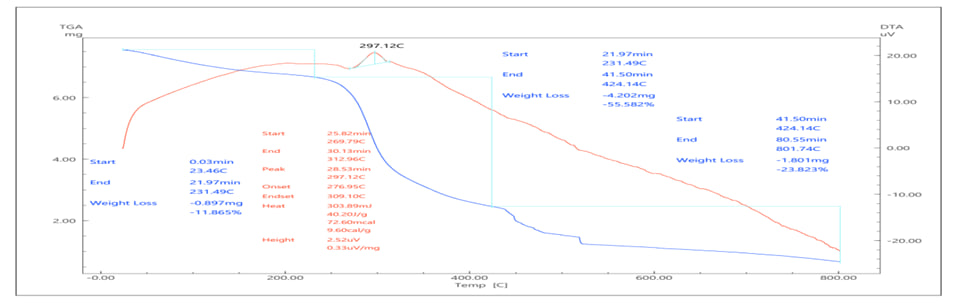 | Figure 7. Derivative thermogram of sizing polymers containing starch–Na–CMC–Na–PAA–K–PFC–K–4. 1–Thermogravimetric analysis curve (TGA), 2–Differential thermal analysis curve (DTA) |
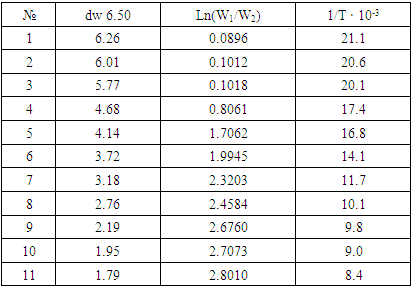
The thermal stability of curing polymers was studied. The thermal properties of the obtained composites were investigated using TGA and DTA methods. According to the analysis of the composite’s thermogram, as the temperature increased, the thermal degradation of the composite sample was characterized by a decrease in sample mass, and this three–stage process was found to occur at different speeds. The first stage mainly leads to the conclusion that the decomposition is related to the release of water molecules. The second thermal change is quantitatively much higher and takes place in a relatively short period, between 193°C, at a rate of 19.53 thousand at 353×10^-3 mg/sec. In total, 55.58% of the composite decomposed in this time range, primarily changing the organic composition of the composite, resulting in more thermally stable residual products. This is because the duration of the third stage is almost twice as long, and the decrease in the mass of the residue sample between 377°C occurs at a rate of 7.6×10^-4 mg/sec, amounting to 23.82%, which provides a basis for this conclusion. The initial thermal change occurred in the range of 208°C, with a rate of 6.81×10^-4 mg/sec.The 7th figure presented above shows the derivative thermogram of the composite prepared based on starch, CMC–Na, Na–PAA, K–PFC, and K–4. It consists of two curves. The thermogravimetric analysis curve (TGA) (1st curve) analysis reveals that the TGA curve primarily exhibits three intensive decomposition temperature ranges. The first decomposition range corresponds to the temperature range of 23.46–231.49°C, the second decomposition range corresponds to 231.49–424.14°C, and the third decomposition range corresponds to 424.14–801.74°C. The analysis shows that the second decomposition range undergoes an intensive decomposition process. In this range, 55.58% of the decomposition occurs (7th figure). Based on the results of the DTA and TGA analyses, kinetic parameters for different temperature ranges of the process were determined. Its advantage is that a range of measurements and the kinetic characteristics of reactions were calculated for the entire temperature range from a single sample.The research results show that the main mass loss occurs in three stages. The first decomposition occurs in the temperature range of 23.46–231.49°C, during which 11.865% of the main mass is lost. The second decomposition occurs in the range of 231.49–424.14°C, with a loss of 55.582% of the main mass. The third decomposition occurs between 424.14–801.74°C, with a mass loss of 23.823%. After 80°C, no significant changes are observed, and the mass remains unchanged. Thus, based on the experimental data obtained for the kinetics of processes in the temperature range from 23°C to 80°C, the thermal–oxidative degradation characteristics of the composite containing CMC–Na, Na–PAA, K–PFC, and K–4 were studied.A detailed analysis of the thermogravimetric analysis curve and the differential thermal analysis curve is presented in the table below (Table 1).Table 1. Effect of temperature and time on the weight loss of curing polymers containing starch–Na–CMC–Na–PAA–K–PFC–K–4
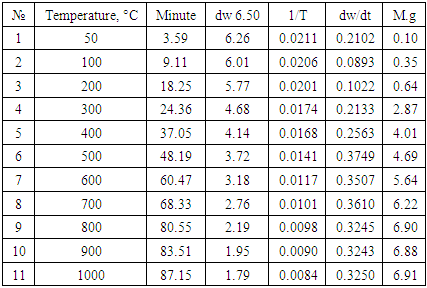 |
| |
|
During the wefting process, there is a significant change in the physical and mechanical properties of the main yarn, which greatly affects the breakage of the yarns on the weaving machine. To reduce the number of breakages in the weaving process, the wefting process must be carried out effectively.
3. Discussion
As is known, the main filler for cotton–based yarns is natural polymer starch (potato, corn, rice). In order for the starch molecule to penetrate deep into the yarn, components that increase adhesion are added to it: caustic soda, sulfuric acid, and other compounds.It should be noted that the use of starch in the textile industry is very large, which has a significant impact on the yield and cost of the product being produced.The composition of the filler must meet a number of basic requirements: it penetrates into the yarn and, after drying, forms a smooth, durable elastic film that smoothes the surface of the yarn and increases its adhesion strength, increasing the strength of the yarn. A detailed analysis of the thermogravimetric analysis curve and the differential thermal analysis curve is presented in Table 2 below. It contains the activation energy values of this process for starch–Na–CMC–Na–PAA–K–PFC–K–4.Table 2. Differential thermal analysis curve analysis
 |
| |
|
4. Conclusions
From the above, it follows that one of the main factors affecting the viscosity of the solution is the concentration and viscosity of the components in the solution.Therefore, the results of the development of a technology for obtaining new highly efficient resource and energy–saving thickeners based on water–soluble natural and synthetic polymers in order to reduce the consumption of starch, which is a food product, and optimize the process are presented.Preliminary experiments have shown that at concentrations of the selected components above 1.2–1.3% (based on the weight of dry starch), even with a low starch content in the slurry, the sizing process occurs, hardening and causing the starch to shed under the influence of mechanical forces. In this regard, the components starch, Na–CMC, Na–PAA, K–PFC and K–4 were added in the proportions of 4.5:0.2:0.3:0.05:0.2%, respectively.
References
| [1] | R.A. Ismatova, F.B. Ibragimova, M.R. Amonov, K.A. Ravshanov “Physical and mechanical properties of Yarn Coated with polymer compositions” European Journal of Molecular & Clinical Medicine ISSN 2515–8260 Scopus Volume 07, Issue 03, 2020. – p. 3671–3678. |
| [2] | R.A. Ismatova,. F.B. Ibragimova,. M.R. Amonov,. K.A. Ravshanov. “Physical and mechanical properties of Yarn Coated with polymer compositions” International Journal of Advanced Research in Engineering and Technology (IJARET) Volume 11, Issue 12, December 2020, Article ID: IJARET_11_12_201 DOI: 10.34218/IJARET.1 1.12.2020.201 © IAEME Publication Scopus Indexed pp. 2114–2121. |
| [3] | R.A. Ismatova, M.R. Amonov. “Structure formation in aqueous solutions of polysaccharides and polyacrylates and creation of composite sizing materials based on them”. Monograph. Bukhara, UDC. 67: 623. ISBN 978–9943–6988–0–2. 2021, p. 109. |
| [4] | R.A. Ismatova, M.M. Amonova, M.R. Amonov. “Physicochemical substantiation of sizing of cotton yarn with new compositions”. Scientific Bulletin. Fergana State University. ISSN 2181–1571 UDC: 541.677.023. No. 1., 2021. pp. 51–56. |
| [5] | R.A. Ismatova, M.R. Amonov, L. Rajabova. “Viscosity characteristics of starch polymer composites” Journal. Composite materials. ISSN 2091–5527, No. 1, 2021, pp. 28–33. |
| [6] | R.A. Ismatova, M.M. Amonova, K.A. Ravshanov, M.R. Amonov. “Physicochemical aspects of obtaining and using a polymer composition for sizing cotton yarn”. Journal. Scientific Bulletin of NamSU ISSN: 2181–0427 ISSN: 2181–1458 UDC: 541.64:677.023 No. 5, 2021, pp. 118–124. |
| [7] | R.A. Ismatova,. M.R. Amonov. “Physical and mechanical Indicators of yam sized with water–soluble polymer compositions” Journal of Pharmaceutical Negative results. E–ISSN 2229–7723/ ISSN 0976–9234, Scopus, Volume 13, Special Issue 9, 2022, pages 212–216. |
| [8] | R.A. Ismatova, A.S. Kazakov, M.R. Amonov. “Application of synthetic polymers PVA and Hipan to improve the efficiency of cotton yarn sizing” Journal Universum: Technical sciences. Issue: 8 (125). August 2024 Part 3. Moscow 2024. – p. 29–33. |
| [9] | R.A. Ismatova., M.M. Amonova,. A.S. Kazakov. “Technological indicators of yarn of slimmed polymer composition” Journal: Universum: Technical Sciences. Issue: 9 (126). September 2024, Part 5. Moscow, 2024. – p. 65–68. |
| [10] | R.A. Ismatova., A.S. Kazakov., M.M. Amonova. “Structural development of compositions consisting of polysaccharide and polyacrylates in aqueous solutions and their basis of creation of original ingredients” International Journal of Material and Chemistry, December, 2024. |
| [11] | R.A. Ismatova., A.S. Kazakov., M.M. Amonova. “Study of the influence of the composition of the sizing on the properties of the sizing yarn” American Journal of Polymer Science, December, 2024. |
| [12] | Amonov M.R., Shadiyeva Sh.Sh., Ismatova R.A., G‘aniyev B. Viscosity characteristics compositions based on PAA, PVS and NA–CMS // E3S Web of Conferences 389, 01021 (2023). |
| [13] | Shadieva Sh.Sh., Amonov M.R. Physicochemical principles of obtaining sizing compositions based on water–soluble polymers // Universum: Technical Sciences. – Moscow, – №11 (116). – 2023. – p. 27–30. |

 Abstract
 Reference
 Full-Text PDF
 Full-text HTML