-
Paper Information
- Paper Submission
-
Journal Information
- About This Journal
- Editorial Board
- Current Issue
- Archive
- Author Guidelines
- Contact Us
American Journal of Polymer Science
p-ISSN: 2163-1344 e-ISSN: 2163-1352
2022; 11(1): 1-6
doi:10.5923/j.ajps.20221101.01
Received: Mar. 20, 2022; Accepted: Apr. 8, 2022; Published: Apr. 15, 2022

The Extraction and Characterization of Chitosan from Apis Mellifera
 Abstract
 Reference
 Full-Text PDF
 Full-text HTML
Khabibullaeva Nozima1, Makhkamova Nazokat1, Karimov Sherali2, Khaitbaev Alisher1
1Department of Organic Synthesis and Applied Chemistry, National University of Uzbekistan Named after Mirzo Ulugbek, Tashkent, Uzbekistan
2Department of Chemistry, Fergana State University, Fergana, Uzbekistan
Correspondence to: Khabibullaeva Nozima, Department of Organic Synthesis and Applied Chemistry, National University of Uzbekistan Named after Mirzo Ulugbek, Tashkent, Uzbekistan.
| Email: |  |
Copyright © 2022 The Author(s). Published by Scientific & Academic Publishing.
This work is licensed under the Creative Commons Attribution International License (CC BY).
http://creativecommons.org/licenses/by/4.0/

Currently, numerous studies are being done to identify and use new sources of chitin. For this purpose, in our research, we aimed to obtain chitosan-based and local raw material Apis mellifera and analyze its structure through FTIR, NMR, and XRD methods. In our study, we initially isolated α chitin and chitosan with an amorphous crystallinity of 31.65%.
Keywords: Chitin, Chitosan, α–chitin, Crystalline index, FTIR spectroscopy, 1H and 13C NMR, XRD (X-ray Diffraction)
Cite this paper: Khabibullaeva Nozima, Makhkamova Nazokat, Karimov Sherali, Khaitbaev Alisher, The Extraction and Characterization of Chitosan from Apis Mellifera, American Journal of Polymer Science, Vol. 11 No. 1, 2022, pp. 1-6. doi: 10.5923/j.ajps.20221101.01.
Article Outline
1. Introduction
- Recently, the demand for products made from natural polysaccharides (polymers) is growing. They have many application fields, due to their biodegradable, biocompatible, anticancer, antibacterial, antifungal activities, etc. Not only are natural polysaccharides but also their biosynthetic polymers are biodegradable and eco-friendly. These types of polysaccharides include alginate, carrageenan, agarose, glucomannan, galactomannan, pectin, chitin and chitosan, hyaluronic acid derivatives, and others. The various biological functions of natural polysaccharides are their most important properties [1]. Interest in chitin and chitosan polyaminosaccharides is growing since their non-toxic, biocompatible, biodegradable, possession of many therapeutic properties (antioxidant, antimicrobial, antifungal, high activity against tumor and cancer cells, analgesic, hemostatic, etc.) for use in the biomedicine, pharmacy, cosmetology, and food industry [2,3]. In nature, chitin occurs in a variety of organisms, including infusoria, amoebae, chrysophytes, some algae, fungi, crustaceans, worms, insects, mollusks, and in the cell walls of fungi and microorganisms (bacteria) [4,5], while chitosan is found in zygomycetes and mucosa, as well as in some fungi such as Absidia coerulea [6]. Globally, chitin and chitosan are mainly isolated from crustaceans, and many studies have recently been carried out to obtain them from insect cuticles [7]. While the use of these types of raw materials on an industrial scale has some disadvantages, some types of insects can be used to extract large amounts of chitin. These are insects that can be reared artificially (honeybees, silkworms, and synanthropic flies). The chitin substance found in insect cuticles is covalently bound to melanin and sclerotin-like proteins [8], which can cause some problems in the process of chitin extraction. The wide development of beekeeping in our country, allows us to use bees (Apis mellifera) as a source of chitin. For this purpose, we obtained chitosan from Apis mellifera first by extracting chitin and then by deacetylation of chitin and used physical research methods (FTIR, 1H and 13C NMR, XRD) to study its structure. We analyzed the structure using spectroscopy methods and crystal structure through the X-ray diffraction method.
2. Materials and Methods
2.1. Extraction of Chitin from Apis mellifera
- A certain amount of dried and crushed Apis mellifera was weighed and to remove impurities, heated with distilled water at 70-80°C while 1 hour. After that resulting material is filtered and dried in an oven at 60°C for 24 hours. This dried material was refluxed with an aqueous solution of 0.1 N HCl at 70-80°C for 1 hour. The demineralization process was completed by washing in a neutral medium with deionized distilled water. Then dried in an oven at 60°C for 24 hours. To achieve the deproteinization process resulting dried material was refluxed with an aqueous solution of 0.1 N NaOH at 70-80°C for 4 hours and filtered, washed to a neutral medium, and dried. For the decoloration and bleaching process, the resulting material was stored in a 30% H2O2 solution for 24 hours. Then extracted chitin plates were washed and dried in an oven at 60°C for 24 hours.
2.2. Deacetylation of Chitin
- Extracted chitin was refluxed with a 40% aqueous solution of NaOH at 70-80°C for 10 hours. Then obtained chitosan (deacetylated chitin) is filtered and washed until neutral medium and dried in an oven at 60°C for 24 hours. The general process of chitosan extraction is depicted in the following Fig. 1:
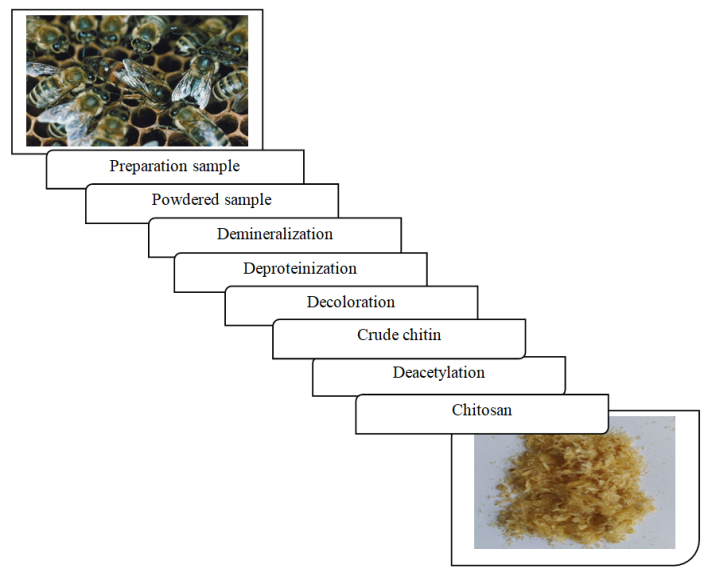 | Figure 1. The general process for chitosan extraction |
2.3. Fourier Transform Infrared Spectroscopy (FTIR)
- Chitin and chitosan obtained from Apis mellifera were characterized from 4000-650 cm-1 by a Perkin-Elmer FTIR spectrophotometer.X-ray Diffraction (XRD)XRD patterns were measured with a Shimadzu X-ray diffractometer (XRD-6100) with CuKα1 – α2 (Kα1 α2 ratio 50%) radiation (γ= 0.15406 nm, 40 kV, 30 mA, scan range 10° - 80°, scanning rate 2°/min and step length 0.05°. The crystalline index (CrI) was calculated by the following equation [12]:
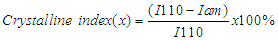 | (1) |
3. Results and Discussion
- In our study, first chitin and then chitosan were isolated based on Apis mellifera, and the obtained substances were analyzed by FTIR spectroscopy, 1H, and 13C NMR, and the X-ray diffraction methods. The following are the results obtained through these methods.
3.1. FTIR Analysis
- The IR spectrum of chitin obtained from Apis mellifera is shown in Fig. 2. According to the literature survey, the amide I band of α chitin consists of two peaks [8]. The fact that the extracted chitin amide I band consists of two peaks at 1652 and 1620.61 cm-1 indicates that the extracted chitin is in the α form.
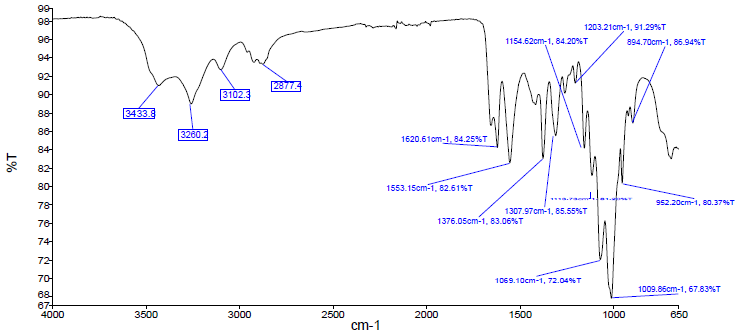 | Figure 2. FTIR spectra of extracted chitin |
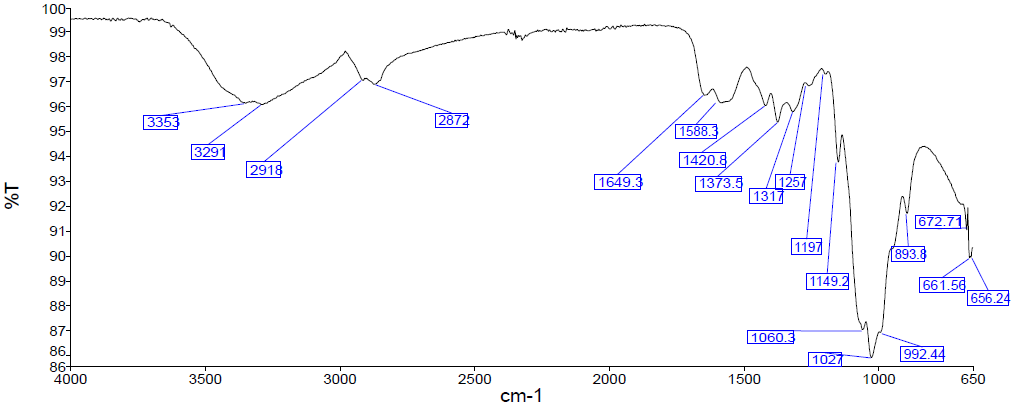 | Figure 3. FTIR spectra of extracted chitosan |
3.2. XRD Analysis
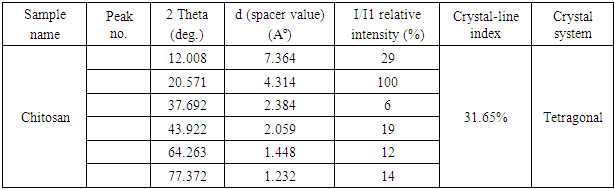
- The XRD method was used to study the crystalline structure (crystallinity index and crystalline lattice) of chitosan obtained based on Apis mellifera (Fig. 4).At 2θ = 10° and 20°, semi-crystalline chitosan forms broad diffraction peaks that are characteristic fingerprint areas [12], which peaks observed at 12° and 20.57° in the Apis mellifera chitosan. Characteristic peaks in this area indicate free amino groups of chitosan form intermolecular and intramolecular hydrogen bonds [13]. However, the broad diffraction peaks of chitosan extracted from Apis mellifera relative to standard chitosan are related to its amorphous nature [14]. The formation of different characteristic peaks may also vary depending on the type of chitin source [15]. The XRD results of chitosan obtained based on Apis mellifera are given in Table 1 below. As can be seen from Table 1 above, the crystalline index of extracted chitosan based on Apis mellifera is 31.65% and the crystalline lattice has a tetragonal structure.
|
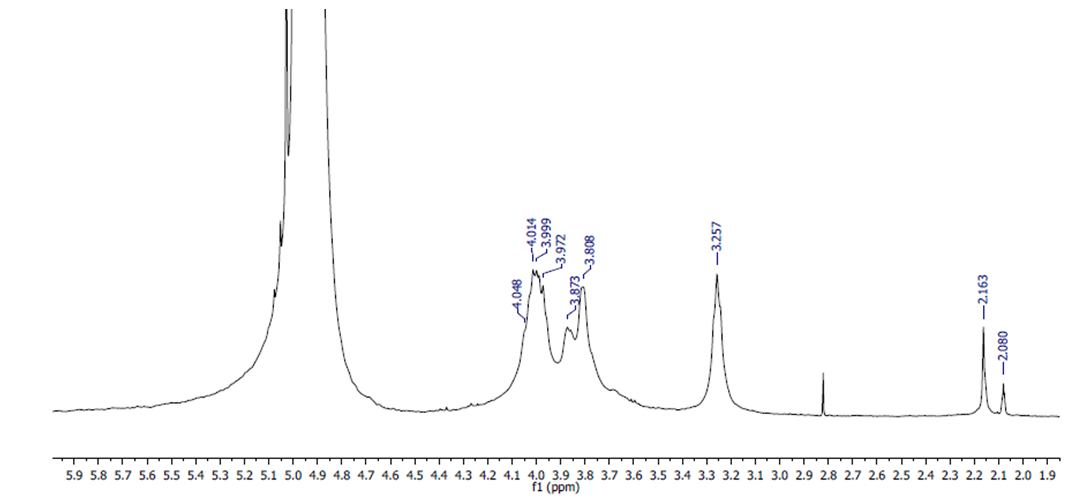
3.3. 1H NMR Analysis
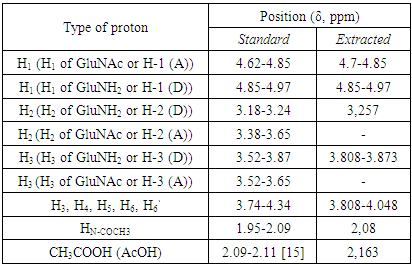
- The structure (Fig. 4.) and the 1H NMR spectrum of the extracted chitosan are depicted in Fig. 5. The signal at 2.0-2.1 ppm represents the three protons of N-acetyl glucosamine (GlcNAc) and the signal at 3.1-3.2 ppm represents the H-2 protons in the glucosamine (GlcN) residue. The non-anomeric protons bound to C3 – C6 in the glucopyranose ring have the same chemical shift values because they have the same electron densities. Because the non-anomeric protons in the spectrum of the molecule are partially overlapped, the signals between the spectra are in the expanded state, and all signals are observed between 3.5 and 4 ppm.
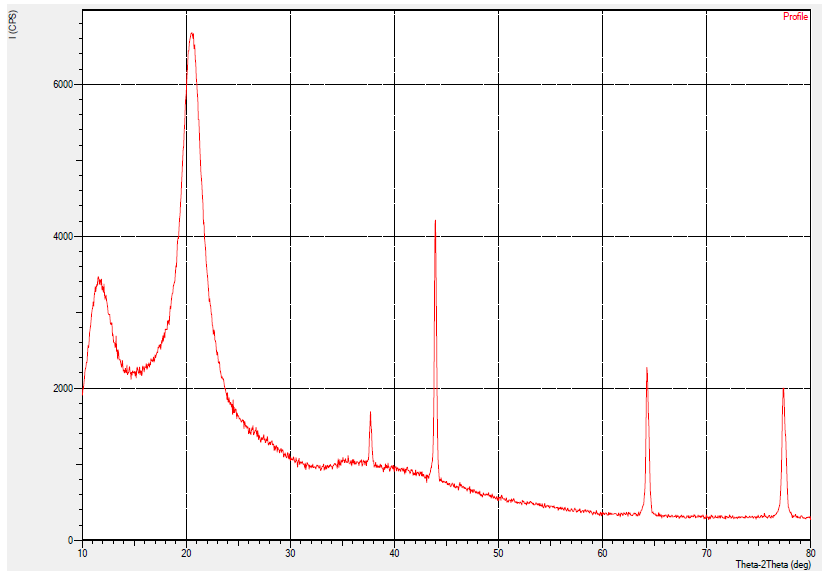 | Figure 4. Label XRD peak of extracted chitosan |
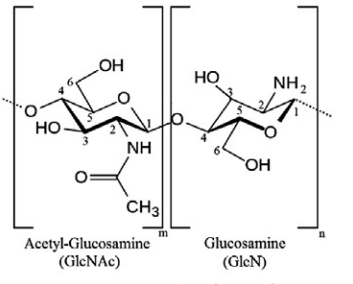 | Figure 5. Structure of chitosan |
|
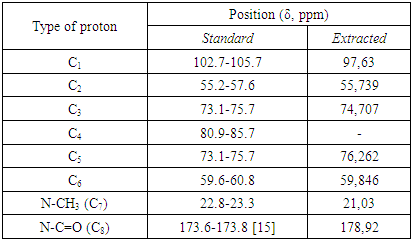
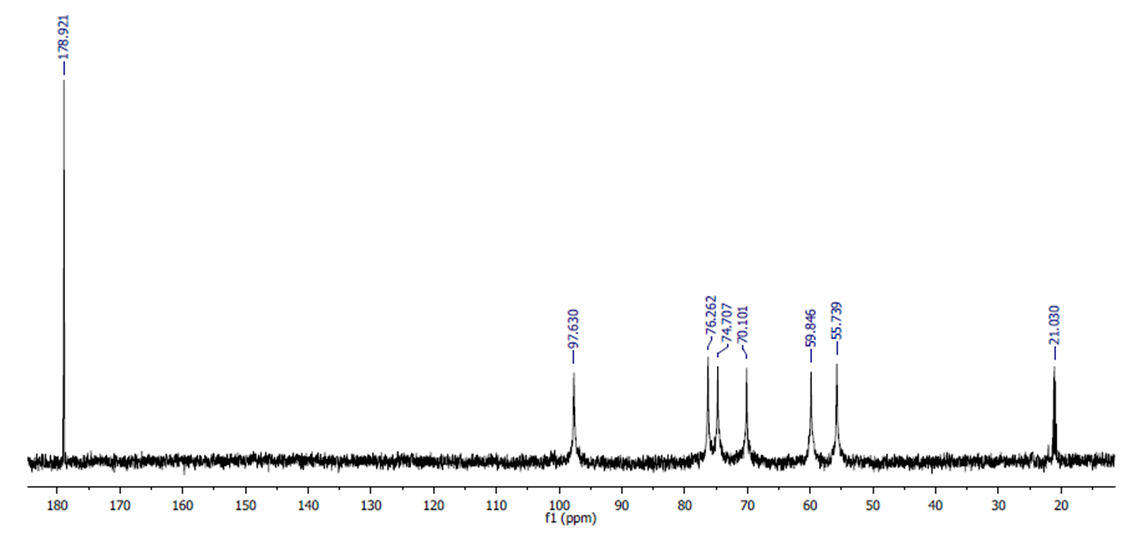
3.4. 13C NMR Analysis
- The 13C NMR spectrum of chitosan is shown in Figure 6, which contains 8 main signals. These signals are attributed to 8 carbon atoms in N-acetyl glucosamine residues (Table-3). Each carbon signal gives a singlet signal, except C2 and C = O, a doublet signal. This is because of the influence of the quadrupole 14N nucleus of the acetamide group [17,18]. In low acetylated chitosan, a doublet signal for C4 is observed at about 86 ppm. As a result of the formation of N-acetyl groups during N-oxidation, the chemical shift values of carbon atoms change at 13C NMR spectroscopy. The C1 atoms of chitin and chitosan signal at about 100 ppm, while other carbon atoms resonate between 60 and 80 ppm. The carbon atom of the -CH2OH (C-6) group is visible at around 60 ppm. When the chitin/chitosan sample is dissolved in D2O, anomeric carbon and methyl carbon atoms are observed between 95 and 100 ppm and 15-25 ppm [16].
|
 | Figure 6. 1H-NMR spectra of extracted chitosan |
 | Figure 7. 13C-NMR spectra of extracted chitosan |
4. Conclusions
- - The structures of chitin and extracted chitosan-based on Apis mellifera were analyzed with FTIR spectroscopy, and it was found that the results were almost identical to the data presented in the literature;- X-ray diffraction method of the crystal structure of chitosan obtained revealed that the crystalline lattice has a tetragonal structure and a crystalline index of 31.65%. From this, we can conclude that the chitosan extracted during our research has an amorphous structure.- The structure of the extracted chitosan was analyzed using 1H and 13C NMR spectroscopy and found that the protons and carbon-related signals in chitosan were similar to the data in the literature.
ACKNOWLEDGEMENTS
- We would like to express our gratitude to Bobakulov Khayrulla, Department of Physical Research Methods of the Institute of the Chemistry of Plant Substances AS RUz who closely assisted in the analysis of the chitosan sample by means of NMR spectroscopy. Also, thank Khushnud Eshchanov for his contribution to XRD data analysis.Conflict of Interest: The authors report no conflicts of interest. The Source of funding is nil.