Keane J. Dye1, Victor R. Townsend Jr.2, Kevin W. Kittredge1
1Department of Chemistry, Virginia Wesleyan University, 5817 Wesleyan Dr, Virginia Beach, VA
2Department of Biology, Virginia Wesleyan University, 5817 Wesleyan Dr, Virginia Beach, VA
Correspondence to: Kevin W. Kittredge, Department of Chemistry, Virginia Wesleyan University, 5817 Wesleyan Dr, Virginia Beach, VA.
| Email: |  |
Copyright © 2019 The Author(s). Published by Scientific & Academic Publishing.
This work is licensed under the Creative Commons Attribution International License (CC BY).
http://creativecommons.org/licenses/by/4.0/

Abstract
We are reporting in-bulk structural changes in the polymer electrolyte membrane (PEM) Nafion determined by Fourier Transform Infrared Spectroscopy (FTIR) in transmission mode. Due to the thickness of commercially available perfluorinated films, thin samples are needed for their inbulk analysis. We have developed a novel method for the preparation and embedding of Nafion samples in LR White resin for thin-film analysis. Microsampling techniques were used to analyze both exterior and interior Nafion samples. Additionally, light microscopy and scanning electron microscopy (SEM) showed that no observable in-bulk morphological changes for both treated and untreated Nafion. The FTIR spectra showed that non-protonated sulfonate groups were protonated throughout the membrane by HCl but little or no protonation by H2O was observed.
Keywords:
Nafion, FTIR in transmission, Morphology, SEM
Cite this paper: Keane J. Dye, Victor R. Townsend Jr., Kevin W. Kittredge, Morphological Studies on Polymer Electrolyte Membranes Used in Fuel Cells. The Effects of Environmental Conditions on Structural Changes as Determined by Transmission FTIR Spectroscopy, American Journal of Polymer Science, Vol. 9 No. 1, 2019, pp. 16-24. doi: 10.5923/j.ajps.20190901.03.
1. Introduction
The creation of a clean and safe source of renewable energy is one of the greatest challenges facing science and engineering in the 21st century. Fuel cells are considered a promising energy conversion technology of the future owing to inherent advantages of electrochemical conversion over thermal combustion processes. In recent years, portable polymer electrolyte membrane fuel cells (PEMFC) have been one of the primary focuses of research in materials analysis and development. Although PEMFC technology has matured substantially over the past two decades, technological barriers, such as insufficient durability, performance at high temperatures, and high cost still delay commercialization of PEMFC in many applications. [1]Nafion consists of a polytetrafluoroethylene (PTFE) backbone and pendent fluorodiether side chains with sulfonic acid end groups (Figure 1). Nafion numbers identify equivalent weight of polymer per equivalent of sulphonate group and a thickness. For example, the 117 of Nafion-117 denotes 1100 g equivalent weight of polymer per equivalent of sulphonate group and a membrane thickness of 0.007 inches. Despite several shortcomings, Nafion is still considered the benchmark of studies in the development of new PEMs. [2,3]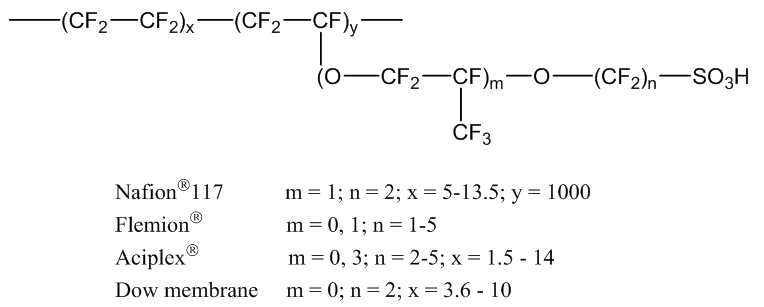 | Figure 1. Commercially available perfluorinated membranes: Nafion (DuPont), Flemion (Asahi Glass Co), Aciplex-S (Asahi Chemical), and Dow membrane (Dow Chemical) |
It is generally agreed upon by the scientific community that a greater understanding of fundamental structure-property relationships of PEMs is necessary in order to make significant technological breakthroughs. [2] Vibrational spectroscopy is known to be a very powerful tool in determining the relationship between a molecular structure of a polymer and its mechanical properties. [1] SEM analysis is another technique that can provide information about surface morphology. [3-7] It may also reveal the approximate diameter of channels used by the solvent and ions for transportation through the membrane. [7-14] Nafion is an ideal model since it has long been viewed as the benchmark standard of PEMs. [1-6] This method may be applied to aid in the development of higher quality PEMFCs for commercial use as the need to realize more efficient renewable energy sources increases.
2. Experimental Section
Materials. Nafion 117 perfluorinated membrane was purchased from Aldrich Chemical, LR White medium grade resin was purchased from Ted Pella, Inc. Hydrogen peroxide (3%) and concentrated sulfuric acid were purchased from Acros Chemical. All reagents were used as received. Sample Preparation. 1.0 cm x 1.0 cm sections of Nafion 117 perfluorinated membrane were used as received (chemically untreated but oven dried) or treated by the following procedure. Treated samples were prepared by being sequentially immersed in 3% hydrogen peroxide, concentrated sulfuric acid, and finally DI water for 45 min at 70°C. The samples were then immersed in water at ~5°C for 45 min and placed in an oven at 75°C for 8 hours. Both treated and untreated samples were placed in either DI water at ~20°C or concentrated hydrochloric acid and stirred for 72 h.The Nafion samples were then placed in 15 x 15 x 5 mm disposable plastic base molds followed by the addition of LR White medium grade resin. The accelerant (100 μL) was added to initiate the polymerization of the resin. Samples were polymerized for 1 h, after which all excess liquid from the resin blocks was removed by blotting with a Kimwipe. Samples were adhered to cassettes using epoxy prior to sectioning.Microtome Sectioning. Sectioning was performed using a Leica RM 2255 microtome with a tungsten knife. The blocks were trimmed to a flat surface using 5 μm slices to remove excess resin prior to slicing Nafion section. Samples (1 μm slices) were collected and the edges cut with a razor to remove any LR White resin before being analyzed. After sectioning and trimming, the slices of Nafion were observed using a Nikon Eclipse E400 microscope. Any morphological differences between the treated and control samples were noted. Pictures of the samples were obtained using a Nikon microscope mounted camera at a magnification of 10.5X. A Hitachi S3400N SEM was used to view the morphological changes of the samples. Only the outermost and innermost Nafion sections were viewed by SEM. FTIR. A Thermo Nicolet IR 200 spectrometer FTIR in transmission mode was used in all experiments. Samples were placed between two NaCl plates and 256 scans at a resolution of 4 cm1 were taken for each sample. The ratio of the absorptions at 1200 cm-1 (SO3H) and 1057 cm-1 (SO3) (15) were used in determine the relative extent of hydration of the sulfonate group.
3. Results and Discussion
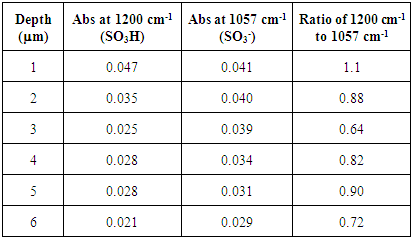
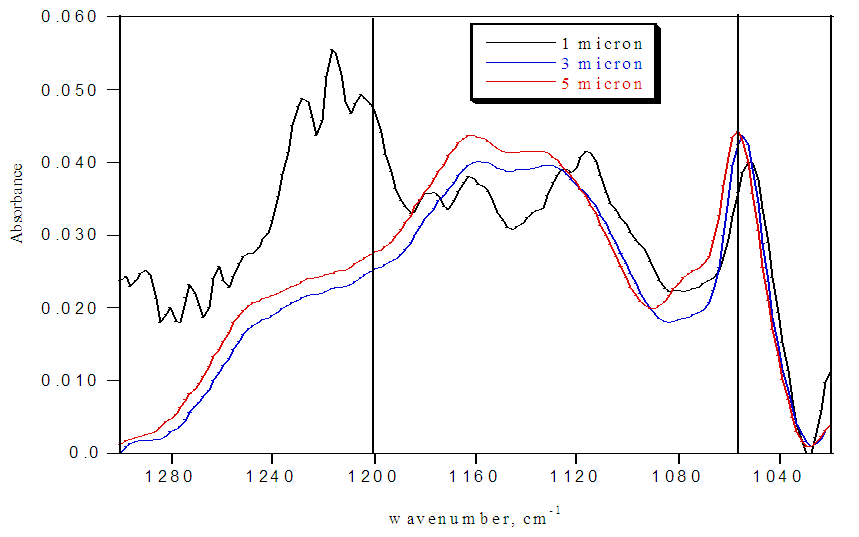
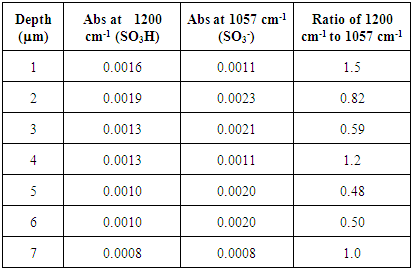
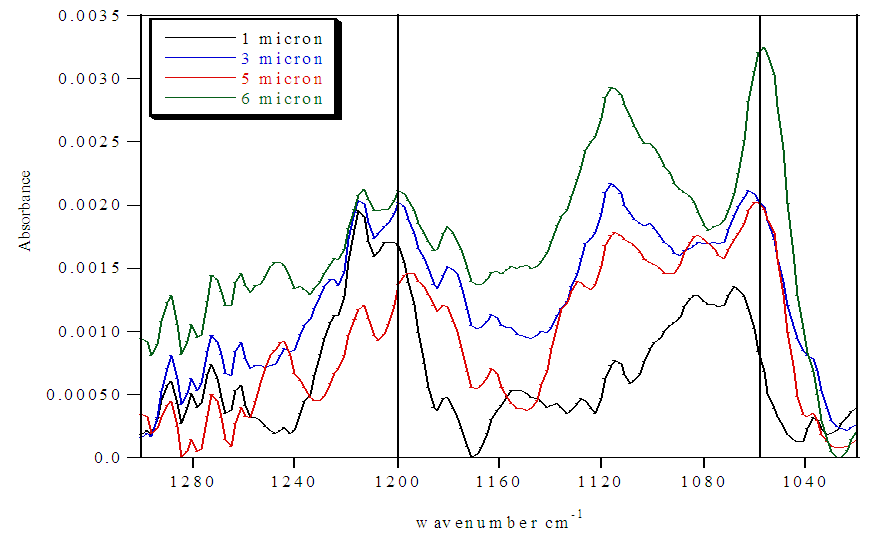
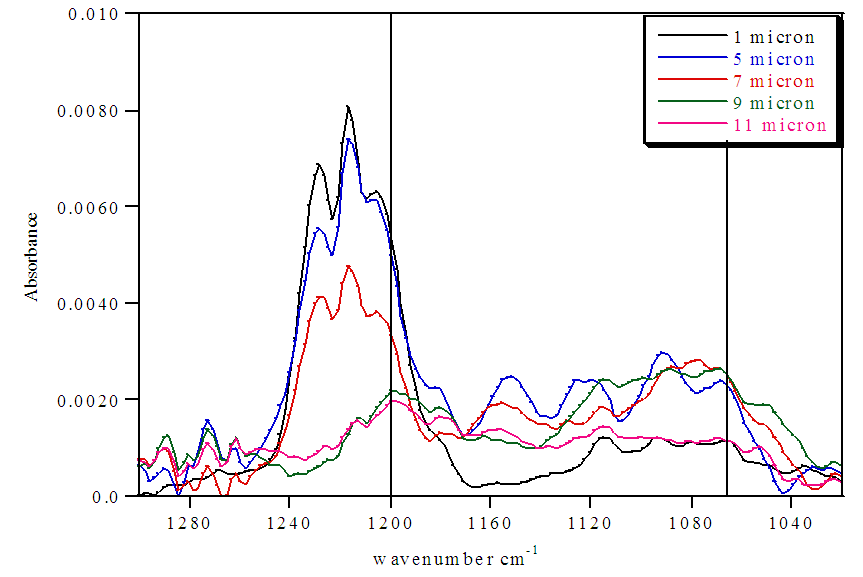
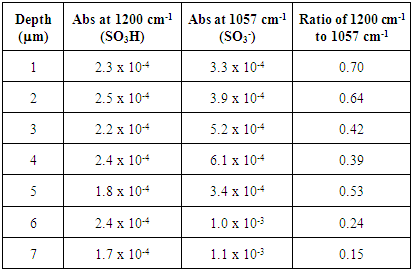
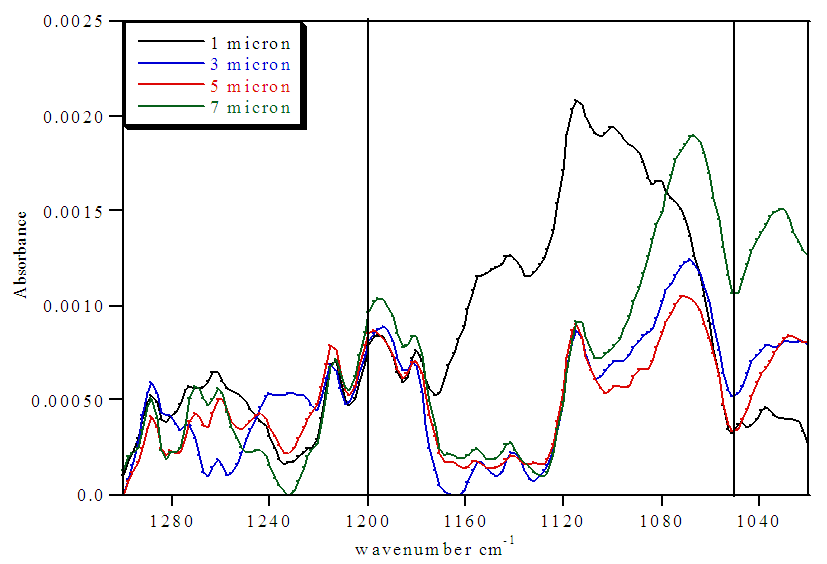
FTIR spectra for pristine Nafion are shown in Figure 2. Except for the outermost section, the spectra have strong absorbances at 1057 cm1 and no significant absorbances at 1200 cm-1, indicating that the sulfonate groups exist almost exclusively in their unprotonated form for the interior of the membrane (Table 1). Only the first section displays a small SO3H absorbance at 1200 cm-1. These protonated sulfonate groups are on the surface of the membrane and most likely exist from protonation by atmospheric water. The low ratio of the absorptions at 1200 cm-1 to 1057 cm-1 indicates that atmospheric humidity alone is not capable of hydrating the interior and that its effects are limited to only the surface of the membrane. The FTIR spectrum of only LR white resin is shown in Figure 3. This spectrum lacks any discernable absorptions at 1200 cm-1 and 1057 cm-1. Therefore, we can conclude that all changes in the FTIR at 1200 cm-1 and 1057 cm-1 for the embedded samples is from changes to either the SO3H or the SO3- groups of Nafion.Table 1. FTIR absorbance data for pristine Nafion
 |
| |
|
 | Figure 2. FTIR spectrum of pristine Nafion sections |
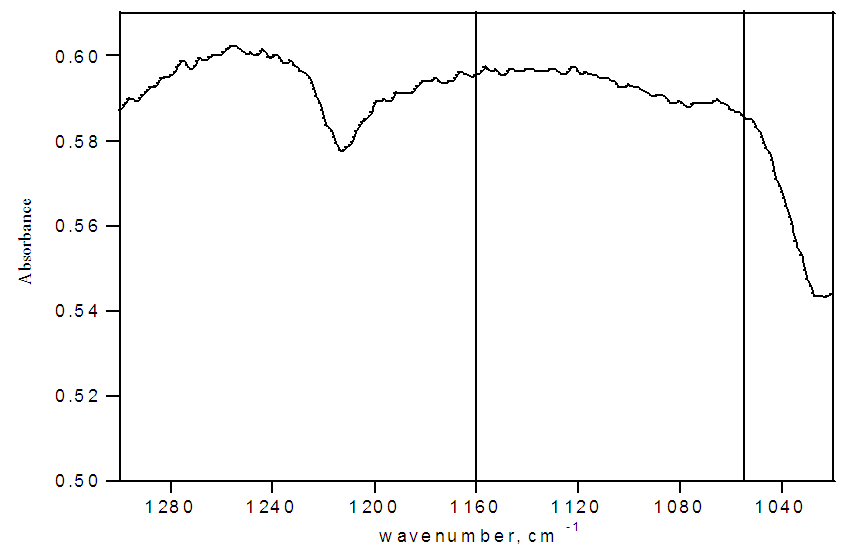 | Figure 3. FTIR spectrum of LR White embedding medium |
Untreated Nafion immersed in HCl and H2O. The SO3H:SO3- ratios from the FTIR spectra for untreated samples that were immersed in either H2O (Figure 4 and Table 2) or HCl (Figure 5 and Table 4) showed that hydration was significantly greater for the samples immersed in acid than for those immersed in only water. The untreated H2O immersed samples showed that hydration was limited to the exterior of the sample, with a SO3H:SO3- ratio of 1.5. The degree of hydration for the internal membrane sections varied with the depth of the sample. Pockets showing high amounts of hydration (SO3H:SO3- ratios >1) were present within the sample, but also sections showing moderate amounts of hydration (SO3H:SO3- ratios ~0.50). These results show that water was able to penetrate into Nafion and protonate sulfonate groups located within the interior of the membrane, but did not do so consistently. Table 2. FTIR absorbance data for untreated Nafion immersed in H2O and stirred 72 h
 |
| |
|
Table 3. FTIR absorbance data for untreated Nafion immersed in HCl and stirred 72 h
 |
| |
|
Table 4. FTIR absorbance data for treated Nafion immersed in H2O and stirred 72 h
 |
| |
|
 | Figure 4. FTIR spectra of untreated Nafion immersed in H2O and stirred 72 h |
 | Figure 5. FTIR spectra of untreated Nafion immersed in HCl and stirred 72 h |
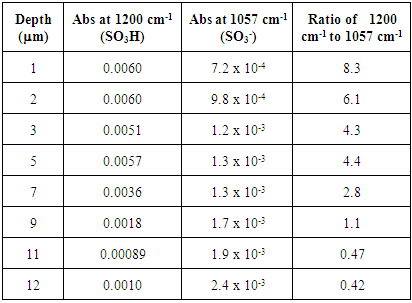
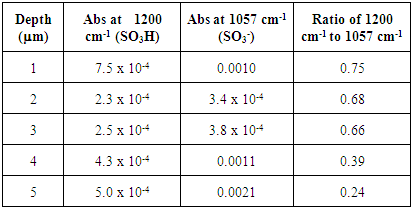
The untreated HCl 72 hour immersed Nafion samples showed the highest levels of hydration. All of the sections lacked significant absorbances for SO3- at 1057 cm-1, indicating nearly all of the sulfonate groups were protonated within the membrane until approximately 10 microns. Also, the extent of hydration decreases from the surface to the interior sections. The stirring of the immersed samples appears to be necessary for hydration. Samples that were immersed in H2O were significantly more hydrated than Nafion samples that were not immersed in H2O (Tables 1 and 2). Stirring the immersed samples seems to increase the concentration of H2O through the membrane and thereby protonating at least some of the SO3- groups and resulting in a greater amount of protonation.Treated Nafion immersed in HCl and H2O. The treated Nafion, immersed in either H2O (Figure 6 and Table 4) or HCl (Figure 7 and Table 5), showed similar results to those for the untreated samples. Again, the treated HCl sections were more protonated throughout the membrane than treated H2O samples. The treated H2O internal sections had lower SO3H:SO3- ratios than for the untreated H2O internal sections. The highest ratio for the treated section was 0.70, which is a little less than half for untreated Nafion (1.5). This indicates that hydration and thus subsequent protonation can greatly vary within the membrane. In general, the extent of protonation in treated Nafion immersed in H2O was significantly less than untreated Nafion immersed in H2O. This indicates that treatment of the membrane prior to immersion in unnecessary, and in fact may limit the amount of water present within the membrane. The SO3H:SO3- ratios for untreated and treated HCl immersed Nafion showed that the treatment process had little effect on the extent of protonation throughout the sections (Tables 3 and 5). In the FTIR spectra for the interior regions of both untreated and treated Nafion small absorbances at 1057 cm-1 were found. This shows that the interior of the membrane is protonated and that the membrane was significantly hydrated. Table 5. FTIR absorbance data for treated Nafion immersed in HCl and stirred 72 h
 |
| |
|
 | Figure 6. FTIR spectra of treated Nafion immersed in H2O and stirred 72 h |
 | Figure 7. FTIR spectra of treated Nafion immersed in HCl and stirred 72 h |
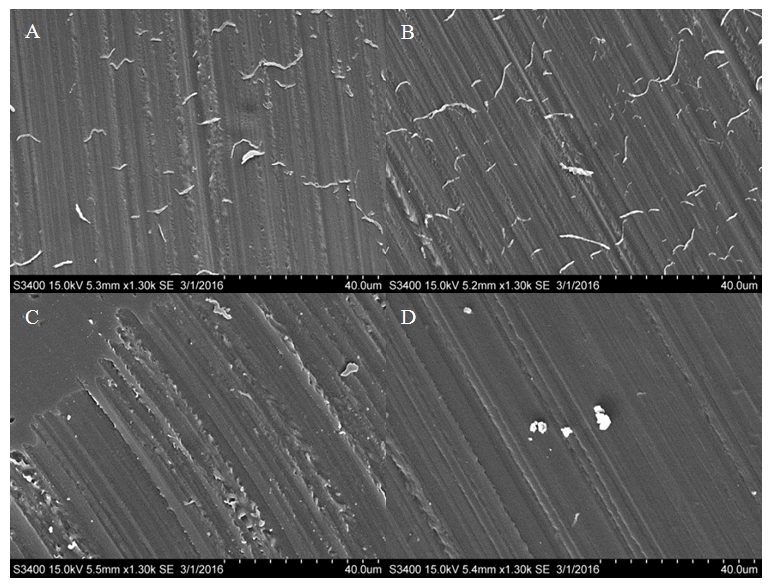
These results indicate that the treatment process is not required. The treatment did not increase hydration in HCl immersed Nafion and in H2O immersed Nafion the treatment process decreased hydration throughout the membrane. These results suggest that the treatment process alters the membrane in some way as to decrease the potential for the sulfonate groups to become protonated. Any chemical treatment of the membrane may degrade it and alter its structure. The structure of the polymer is crucial for hydration and treatment of the membrane may be deteriorating the mechanical properties of the membrane. Altering the sulfonate cluster-network could impede hydration and thus decrease protonation of the interior sulfonate groups. Morphological comparisons of pretreated and un-treated Nafion samples. Light microscopy and Scanning Electron Microscopy were used to identify any morphological changes caused by the treatment process on the Nafion membrane. By examining both the exterior and the inner-most section of the membrane, any morphological differences could be observed. Light microscopy showed that they were no observable morphological distinctions between the samples (Figures 8-10). All of the samples appeared uniform in structure with no distinctive visible degradation of the samples observed. SEM images also showed that the membrane was fairly uniform. For both the treated and untreated membrane, no distinguishing morphological features were present (Figures 11-13). All of the samples showed relatively smooth, uniform surfaces, with no indication of the presence of channels needed for water migration. The ridges and grooves that are seen in Figures 11-13 are a result sectioning the samples with a microtome. As the knife was dragged across the surface of the sample it left a grooved indentation. Despite the morphological artifacts created by the sectioning method employed, there was no indication that treatment of the membrane had any significant impact on its morphological structure. 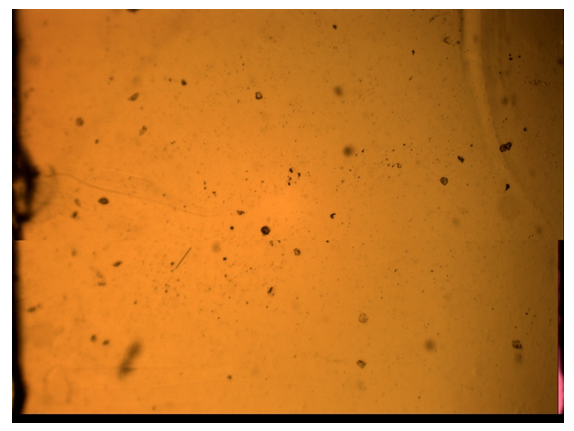 | Figure 8. Light microscopy images of pristine Nafion. Magnification at 10.5x |
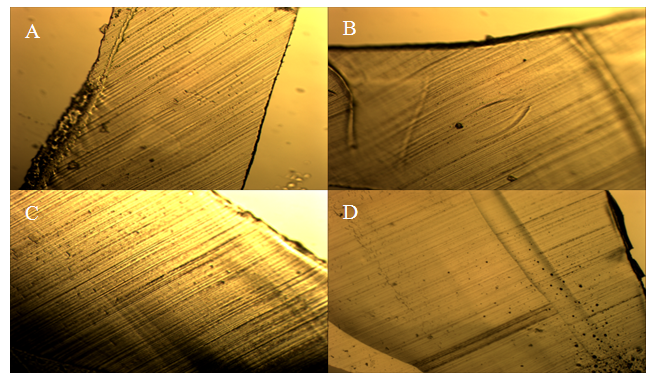 | Figure 9. Light microscopy images of treated and untreated Nafion immersed in H2O. A) Treated surface. B) Treated interior. C) Untreated surface. D) Untreated interior. Magnification at 10.5x |
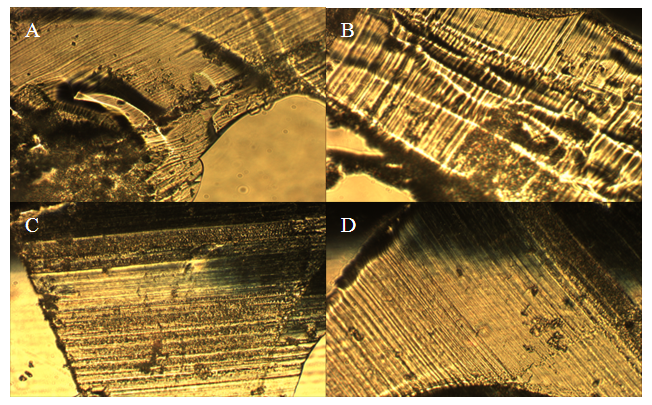 | Figure 10. Light microscopy images of treated and untreated Nafion immersed in HCl. A) Treated surface. B) Treated interior. C) Untreated surface. D) Untreated interior. Magnification at 10.5x |
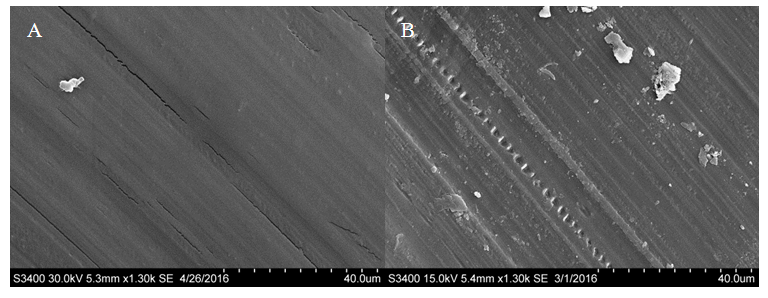 | Figure 11. SEM images of pristine Nafion. A) Surface. B) Interior |
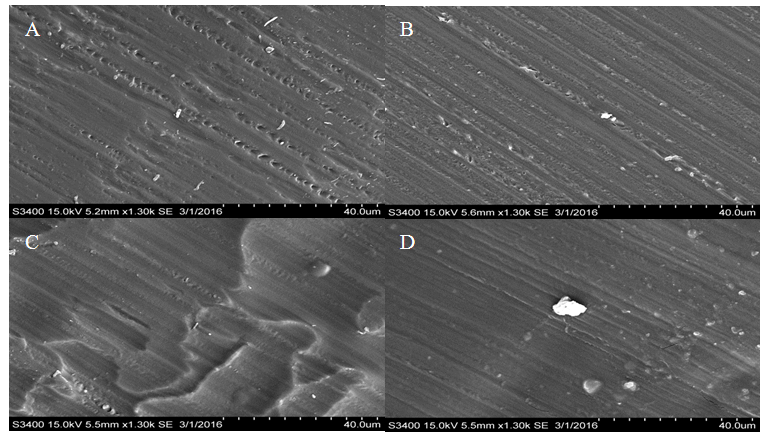 | Figure 12. SEM images of treated and untreated Nafion immersed in H2O. A) Treated surface. B) Treated interior. C) Untreated surface. D) Untreated interior |
 | Figure 13. SEM images of treated and untreated Nafion immersed in HCl. A) Treated surface. B) Treated interior. C) Untreated surface. D) Untreated interior |
ACKNOWLEDGEMENTS
KJD was supported by a fellowship from the Virginia Federation of Independent Colleges. KWK was supported by funding from Virginia Wesleyan University Faculty Summer Development Grant.
References
| [1] | K. Kreuer. "Fuel Cells" in Encyclopedia of Sustainability Science and Technology, K.-D. Kreuer, Ed., Springer, New York, USA (2012). |
| [2] | R. J. Meier. Chemical Soc. Rev. 2005, 34, 743. |
| [3] | A. M. Osborn. R. B. Moore. Polymer Science: A Comprehensive Reference, Eds. K. Matyjaszewski. M. Moller. Elsevier BV. Amsterdam. (2012) pp. 721-766. |
| [4] | K. Suarez-Alcantara. D. C. Martinez-Casillas. K. B. Zheng. Q. Zhu. M. Abdellah. D. Haase. T. Pullerits. O. Solorza-Feria. S. E. Canton. Int. J. Hydrogen Energy, 2014, 39, 5358. |
| [5] | S. Shironita. T. Sakai. M. Umeda. Electrochimica Acta, 2013, 113, 773. |
| [6] | T. Suzuki. S. Tsushima. S. Hirai. ECS Transactions, 2010, 33, 1465. |
| [7] | E. H. Yu. K. Scott. R. W. Reeve. J. Applied Electrochem., 2006, 36, 25. |
| [8] | H. M. Yu. J. O. Schumacher. M. Zobel. C. Hebling. J. Power Sources, 2005, 145, 216. |
| [9] | M. Lopez-Haro. L. Guétaz. T. Printemps. A. Marin. S. Escribano. P.-H. Jouneau. P. BayleGuillemaud. F. Chandezon. G. Gebel. Nature Comm., 2014, 5, 5229. |
| [10] | S. Tan, D. Bélanger. J. Phys. Chem. B, 2005, 109, 23480. |
| [11] | B. Muriithi. D. A. Loy. ACS Appl. Mater. Interfaces, 2012, 4, 6766. |
| [12] | A. Gruger; A. Regis; T. Schmatko; P. Colomban Vib. Spec., 2001, 26, 215. |
| [13] | J. Guo; J.-G. Lee; T. Tan; J. Yeo; P. W. Wong; N. Ghaffour; A. K. An J. Membrane Sci., 2019, 117265. |
| [14] | C. Yin; A. Liu; B. Xiong; J. Li J. Membrane Sci., 2019, 117356. |
| [15] | S. D. Bernardina; J.-B. Brubach; Q. Berrod; A. Guillermo; P. Judeinstein; P. Roy; S. Lyonnard J. Phys. Chem. C, 2014, 118, 25468. |

 Abstract
 Reference
 Full-Text PDF
 Full-text HTML