-
Paper Information
- Paper Submission
-
Journal Information
- About This Journal
- Editorial Board
- Current Issue
- Archive
- Author Guidelines
- Contact Us
American Journal of Polymer Science
p-ISSN: 2163-1344 e-ISSN: 2163-1352
2017; 7(3): 45-50
doi:10.5923/j.ajps.20170703.01

Application of DSC in the Study of Thermal History of Cable Insulation Wire
 Abstract
 Reference
 Full-Text PDF
 Full-text HTML
Armaya’u Usman, Zakariyya Uba Zango
Department of Chemistry, Al-Qalam University Katsina, Katsina, Nigeria
Correspondence to: Zakariyya Uba Zango, Department of Chemistry, Al-Qalam University Katsina, Katsina, Nigeria.
| Email: |  |
Copyright © 2017 Scientific & Academic Publishing. All Rights Reserved.
This work is licensed under the Creative Commons Attribution International License (CC BY).
http://creativecommons.org/licenses/by/4.0/

Application of Differential scanning Calorimetry (DSC) was employed to study the thermal history of cable insulation wire. Samples of pre-heated and non-pre-heated polymer sample of the cable wire were analysed. From the DSC curves plotted against temperature on both pre-heated and non-pre-heated samples there are considerable differences in the curves. Moreover, the pre-heated curves obtained for pre-heated sample at 50 K/min heating rate shows very distinct similarities, the glass transition occurs at 130°C in all the samples. Two major endothermic peaks of melting and decomposition stages at different stages of temperatures between 337.2°C and 347.7°C where observed and a decomposition transition temperatures between 446.1°C and 448.6°C. These were found to be absent in the curves of the non-pre-heated sample which has only a melting transition stage. Observing the entire DSC curves and the graphs plotted, it can be seen that DSC too showed a clear difference on the thermal history of the two different cable wire samples.
Keywords: DSC, Polymers, Glass transition
Cite this paper: Armaya’u Usman, Zakariyya Uba Zango, Application of DSC in the Study of Thermal History of Cable Insulation Wire, American Journal of Polymer Science, Vol. 7 No. 3, 2017, pp. 45-50. doi: 10.5923/j.ajps.20170703.01.
Article Outline
1. Introduction
- Differential Scanning Colorimetry (DSC) is one of the thermo-analytical techniques used to study thermal properties of materials. It is a technique in which the difference in the amount of heat required to increase the temperature of a sample and reference are measured as function of temperature [1]. DSC technique is widely used for studies and examining polymers to check their compositions, Melting points, glass transition temperatures as well as the studies of thermal history of polymers. Knowledge about the thermal stability of the materials is an important key for the optimal use and processing of polymers. Usually the thermal stability of polymers is characterized using techniques such as thermogravimetric analysis TGA and DSC [2].DSC technique is used to monitors heat effects associated with phase transitions or chemical reactions as a function of temperature. A difference in heat flow to the sample and a reference at the same temperature is recorded as a function of temperature. The reference material used is mostly an inert material such as alumina, or just an empty aluminium pan. The temperature of both the sample and reference are increased at a constant rate [3].The properties of polymer materials and mixtures depend on the chemical and physical properties of neat polymers, additives as well as the used processing methodology. Differential scanning Colorimetry (DSC) is a physical characterization method used to study thermal behaviour of neat polymers, copolymers, polymer blends and composites [4, 5]. In DSC method, the temperature of a phase transformation is of great importance. The glass transition temperature, Tg, is the temperature at which amorphous (non-crystalline) polymers are converted from a brittle, glasslike form to a rubbery, flexible form [6, 7]. The glass transition is not a first-order phase transition, but one that involves a change in the local degrees of freedom through changes in the torsion angles along the polymer backbone [8]. For most polymers, the Tg are available from standard compilations and the method can show up possible polymer degradation by the lowering of the expected melting point [9], which depends on the molecular weight of the polymer, so lower grades will have lower melting points than the expected.When an organic chemical is being prepared, checks are done against a known standard material for purity as well as stability. Determination of its melting point is the easiest way of doing that (this cannot be done by using TG), since it doesn’t involve mass change [10]. A technique is needed that can broadly identify these transition states (solid-solid phase transitions and to some solid-state reaction), and this technique is DSC [11]. Unlike crystalline Polymers which have a definite melting and freezing point, unlike non-crystalline such as paraffin wax, fatty acids, alcohols and salt hydrates which have a relatively wide phase change temperature range during which the state of them are difficult to describe and the thermal properties including thermal conductivity, specific heat capacity, density, etc. are also hard to quantify [12]. E. Perodi et al., (2017), studied the mechanical behaviour of polyamide through determination of its glass transition temperature. Two factors were considered, the hydration level and processing. The thermal history on Tg was investigated by means of fast scanning Calorimetry (flash-DSC) [13]. The technique can be used to provide a simple way of measuring and identifying the quality of materials that may be adapted across a wide range of substances, from polymers to metals [14]. The direction as well as the magnitude of the change in heat in the system is very difficult to measure precisely, therefore; a more elaborate apparatus of Colorimetry is needed.
2. Experimental
2.1. Materials and Method
- i. PolymersInsulation cables were collected from the school departmental store and used as samples. And different plastic materials were randomly collected around the University.
2.2. Differential Scanning Calorimetry (DSC)
- The DSC instrument used is an automated DSC 1 METTLER TOLEDO (auto sampler type) which is used to measure the enthalpy changes in samples due to their physical and chemical properties as a function of temperature and time. The samples were prepared by cutting the sample to the size of the sample holder (aluminium crucible without pin) and weighing the sample using mettle AT 261 delta range weighing balance (electric) and ran in a Differential Scanning instrument. The DSC was run under three different heating rates and conditions so as to demonstrate the influence of heat (temperature) on each sample. The three heating rates are as follows:
2.3. The Different Heating Rates
- (1) Programmed from 25°C room temperature to 300°C (hold to the end of analysis) at 10.00 k/min under Nitrogen at 50 ml/min flow rate.(2) Programmed from 25°C (room temperature) to 500°C (hold to the end of analysis) at 25.00 k/min under nitrogen at 50 ml/min flow rate.(3) Programmed from 25°C (room temperature) to 500°C (hold to the end of analysis) at 50 k/min under nitrogen at 50 ml/min flow rate.
2.4. Thermal Pre-Treatment
- The polymer samples were categorised into three classes namely the pre-heated samples, the non-pre-heated samples, and the other polymers.i. Pre-heatedThese are samples directly obtained and used from the store but were oven heated under different temperatures of 50°C, 100°C, 150°C, 200°C and 250°C, to enable the determination of the thermal history of polymers used as electrical insulation.ii. Non-Pre-heatedThese are the normal cable insulation wires for electric wiring purposes purely non treated samples directly obtained and used from the store.iii. Other PolymersThe polymers are collected randomly around the university surrounding with different degree of hardness. They includes toothbrush plastic cover, plastic bottle cover, takeaway food containers, water pipes, and no any treatment or pre-heating was conducted on them.
3. Results and Discussion
3.1. Differential Scanning Calorimetry
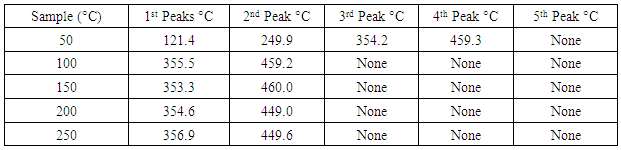
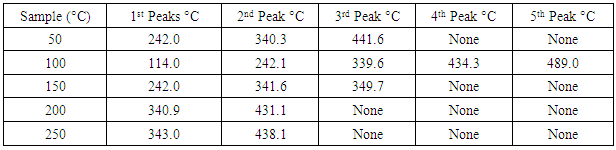
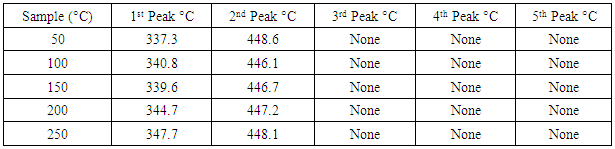
- The DSC results obtained in the five different pre-heated samples under the three different heating rates are tabulated in tables 1, 2 and 3.
|
|
|
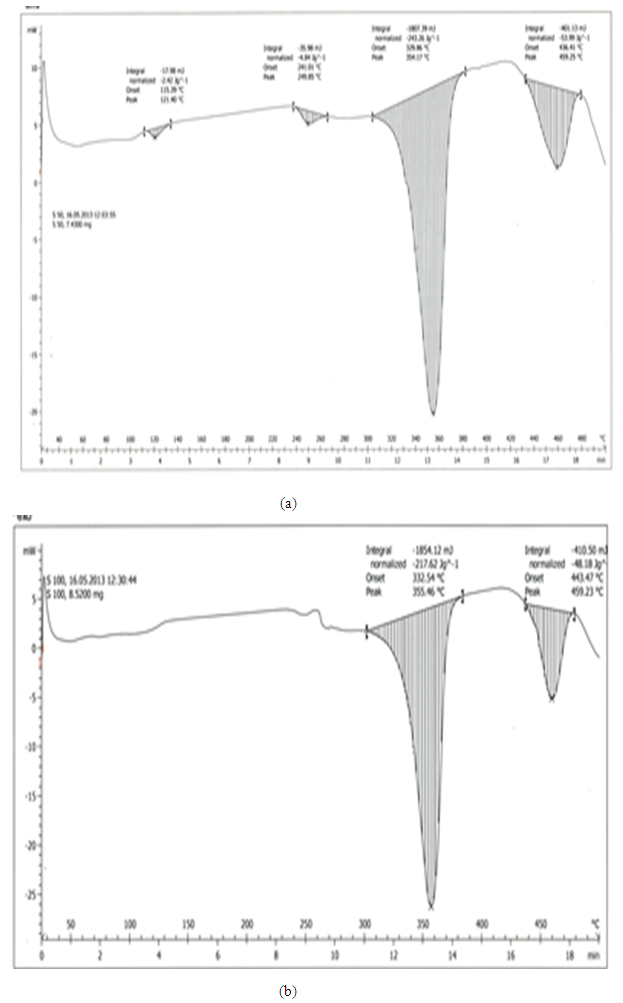 | Figure 1. Comparison between DSC curve of pre-heated samples at 50°C and 100°C respectively |
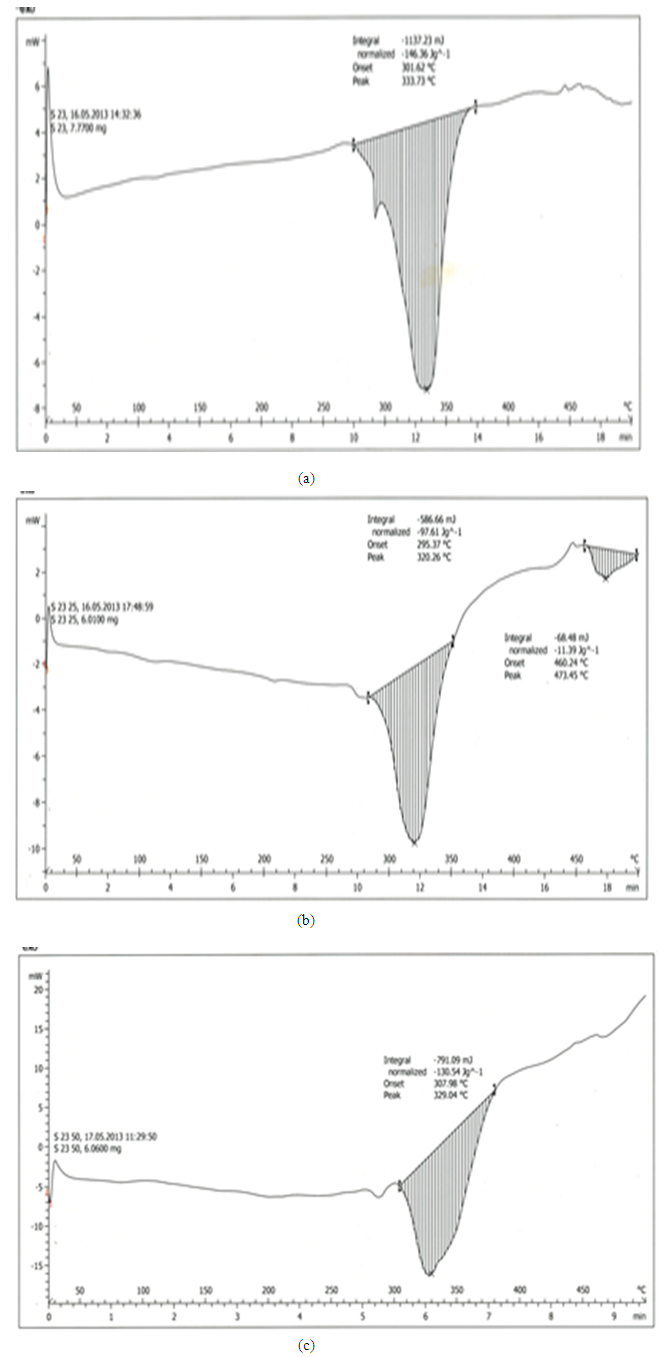 | Figure 2. Comparison of non-pre-heated curves at different heating rates of 10 K/min, 25 K/min and 50 K/min respectively |
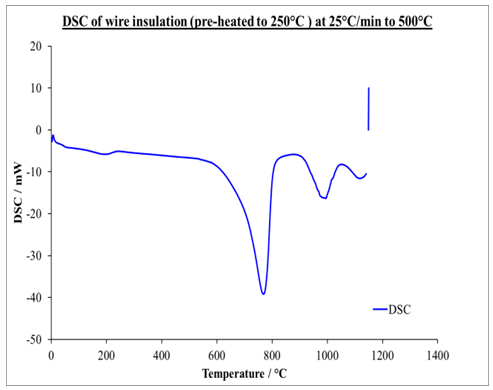 | Figure 3. DSC graph of pre-heated insulation wire to 250°C at 25 K/min to onset temperature of 500°C |
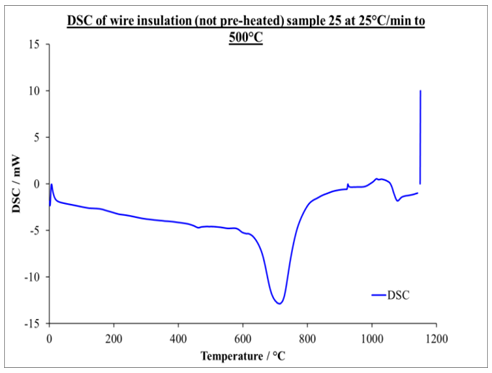 | Figure 4. DSC graph of non-pre-heated insulation wire at 25 K/min to onset temperature of 500°C |
4. Conclusions
- Differential scanning Calorimetry (DSC) can be used to study the thermal history of cable insulation wire. From the DSC curves plotted against temperature on both pre-heated and non-pre-heated samples there are considerable differences in the curves. Moreover, the pre-heated curves obtained for pre-heated sample at 50 K/min heating rate shows very distinct similarities, the glass transition occurs at 130°C in all the samples. Two major endothermic peaks of melting and decomposition stages at different stages of temperatures between 337.2°C and 347.7°C where observed and a decomposition transition temperatures between 446.1°C and 448.6°C. These were found to be absent in the curves of the non-pre-heated sample which has only a melting transition stage. Observing the entire DSC curves and the graphs plotted, it can be seen that DSC too showed a clear difference on the thermal history of the two samples.
ACKNOWLEDGEMENTS
- The authors wish to acknowledge the contributions of Dr. Gareth Perks of Huddersfield University England UK and Al-Qalam University Katsina.