-
Paper Information
- Paper Submission
-
Journal Information
- About This Journal
- Editorial Board
- Current Issue
- Archive
- Author Guidelines
- Contact Us
American Journal of Polymer Science
p-ISSN: 2163-1344 e-ISSN: 2163-1352
2017; 7(2): 30-37
doi:10.5923/j.ajps.20170702.02

Effect of Pressure on the Separation of Ethylene from Ethylene/Ethane Gas Mixture Using Hollow Fiber Membrane
 Abstract
 Reference
 Full-Text PDF
 Full-text HTML
Nayef Ghasem, Mohamed Al-Marzouqi, Nadia Sheta
Department of Chemical and Petroleum Engineering, United Arab Emirates University, Al-Ain, UAE
Correspondence to: Nayef Ghasem, Department of Chemical and Petroleum Engineering, United Arab Emirates University, Al-Ain, UAE.
| Email: |  |
Copyright © 2017 Scientific & Academic Publishing. All Rights Reserved.
This work is licensed under the Creative Commons Attribution International License (CC BY).
http://creativecommons.org/licenses/by/4.0/

The aim of this work is to study the effects of pressure, gas flow rates, liquid flow rates and silver nitrate concentration on the separation of ethylene/ethane gas using hollow fiber membrane contactor. A mathematical model is developed; the model considers the gas solubility as a function of pressure, temperature and silver nitrate concentration. The model is validated by the accomplished experimental data. The results of model predictions and the experimental data are in excellent agreement. The obtained results indicated that ethylene/ethane separation increases with increasing the inlet gas pressure to certain extent, silver nitrate concentration and liquid flow rates.
Keywords: Olefin/paraffin separation, Silver nitrate, PFA hollow fiber, Membrane contactor
Cite this paper: Nayef Ghasem, Mohamed Al-Marzouqi, Nadia Sheta, Effect of Pressure on the Separation of Ethylene from Ethylene/Ethane Gas Mixture Using Hollow Fiber Membrane, American Journal of Polymer Science, Vol. 7 No. 2, 2017, pp. 30-37. doi: 10.5923/j.ajps.20170702.02.
Article Outline
1. Introduction
- Petrochemicals are chemical goods derived from petroleum. Some of these compounds made from petroleum are also can be extracted from other fossil fuels, such as coal or natural gas, or renewable sources such as corn or sugar cane. The two most common petrochemical classes are olefins including ethylene and propylene. Ethylene and propylene are important commodity compound used as monomers to produce the most worldwide needed polymer; polyethylene and polypropylene, respectively. These monomers do exist in petroleum products as part of natural gas or natural gas liquids which need separation and further purification to be suitable as monomers. Separation of Olefin/paraffin gas mixtures with the similar carbon number such as ethylene/ethane or propylene/propane is a high-energy consumption processes, very long conventional distillation columns are used for this purpose. The drawbacks of distillation columns inspire investigators to look for a substitution technique to separation these gas mixtures [1-3]. Current studies show that gas-liquid membrane contactors could have after further progress and enhancement as a potential replacement to the conventional distillation column [4-6]. Researchers demonstrate that employing membrane contactor to separate ethylene/ethane [7, 8] and propylene/propane gas mixture with a variety of compositions using silver nitrate as absorption medium is an economically feasible process and is a creative method [9-16]. The advantages of using hollow fiber membranes contactors are the membrane fibers have a large area per unit volume compared to traditional distillation column [17, 18]. Liquid membrane contactor module using silver nitrate solution successfully for separation of Olefin/paraffin but not to the extent of commercial achievement due to the high cost of the silver nitrate solution [19]. Other than silver are copper salts can from complexation with olefins in the same manner that silver does, by contrast, copper carriers also suffer from stability problems and not easy to tackle, membrane was used as an air-sweep vacuum membrane distillation using fine silicon, rubber, hollow-fiber membranes [20]. Gas-liquid membrane contactors are a new and effective strategy for gas absorption that integrates membrane separation and liquid absorption. Compared with traditional absorption process, membrane contactor combines the advantages of both liquid absorption; low cost and high selectivity and membrane separation; high surface area to volume ratio and compact equipment. Some researchers studied various, operating parameters on the membrane separation performance, the concluded that the silver nitrate concentration and trans-membrane pressure does effect separation performance significantly [21, 23]. The effect of pressure ethylene separation using gas-liquid hollow fiber membrane contactor was not fully covered; also, pervious mathematical models did not include the effect of pressure and silver nitrate concentration in their models [6]. The aim of this work is to explore the experimental and simulation performance of the effect of pressure on the absorption of an in lab-made gas-liquid hollow fiber membrane contactor in the separation of ethylene from ethylene/ethane gas mixture via aqueous silver nitrate (AgNO3) solution at various ethylene concentration and pressures up to 10 bars. For the modeling side, to the best of our knowledge, it is for the first time in the literature that, the model includes the effect of ethylene solubility in silver nitrate aqueous solution as a function of pressure, temperature and silver nitrate concentration. The mathematical model equations are solved using the finite element method technique embedded with the efficient software package COMSOL Multiphysics version 5.3.
2. Experimental
2.1. Reagents and Materials
- Polyfluorinated alkoxyvinylether (PFA) microporous hollow fibers were purchased from Entegris (USA). Salable hollow fiber membrane module (1.25-inch diameter and 9-inch length, model G478) constructed from polypropylene hollow fibers was bought from Membrana (USA). Silver nitrate, bought from Sigma Aldrich, Germany. Ethylene (99.95%) and Ethane (99.5%) gas cylinders was purchased from Air Product, Nitrogen (99.99%) gas cylinder received from Sharjah Oxygen. Two-part low viscosity epoxy was acquired from Buehler (Resin No. 20-8140-128, Hardener No. 20-8142-064). All solutions were prepared using distilled water. The experimentations were done in cooled laboratory at 22±1°C.
2.2. Experimental Setup
- The module is made of polymer PFA hollow fiber membrane (Table 1). Across section of the module is shown in Figure 1. The silver nitrate aqueous solution through the tube side of the module is driven using high-pressure pump (Knauer pneumatic pump, max flow 499.9 ml/min, max pressure 100 bars). The gas flow rate is adjusted by a mass flow controller (Parker, Porter model 201). The pressure of the inlet gas was measured by a pressure regulator (Tescom). High-pressure digital gauges (Cole Parmer) were used to monitor both gas and liquid pressures. 5L/min. Nitrogen gas was used as a sweep gas. Gas compositions were tested using X-Stream XE, Emerson ethylene gas analyzers (Figure 2).
|
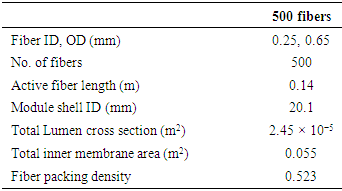
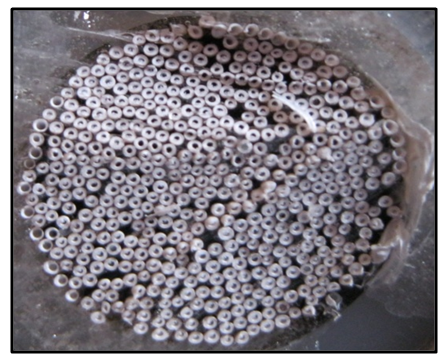 | Figure 1. Cross section of the fabricated high pressure stainless steel module |
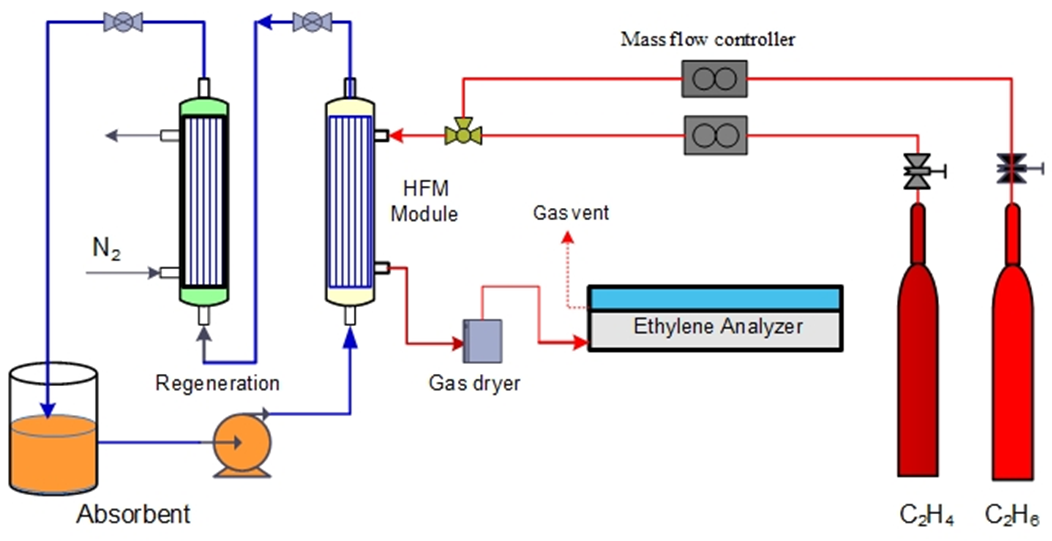 | Figure 2. Experimental setup used in the olefin/paraffin separation at high pressure |
3. Results and Discussions
3.1. Experimental Work
3.1.1. Effect of Feed Gas Pressure on Ethylene Separation at Different Gas Flow Rates
- The effect of feed gas pressure on ethylene separation from a mixture of 50% ethylene and 50% ethane using different gas flow rates and fixed solvent flow rate (30mLmin-1, 2M AgNO3) was studied and the attained data are plotted in Fig. 3. The results revealed that, ethylene flux was increased with increasing the feed gas pressure to some limit only and this is may be attributed to the low solvent capacity at which the silver cations began to be reduced to metallic silver which mean saturation of the carrier solution and the increases solubility of ethylene in silver nitrate with pressure. The same experiment was achieved using higher silver nitrate concentration (4M) but the same trend was obtained as shown in Fig. 4, and this is again may be attributed to the slow of desorption process at the regeneration polypropylene module.
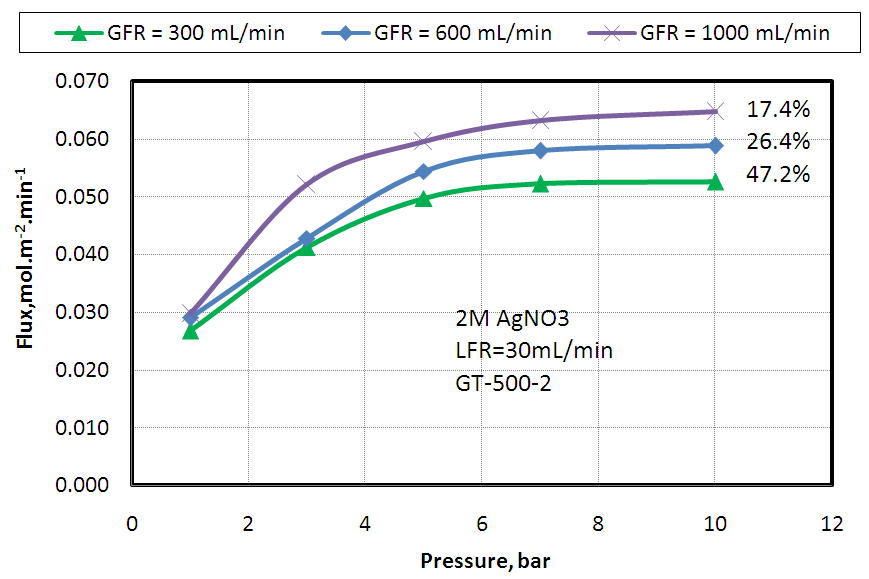 | Figure 3. Effect of feed gas pressure on Ethylene absorption flux at different feed gas flow rates and fixed solvent flow rate of 30 mL/ min and 2M AgNO3 |
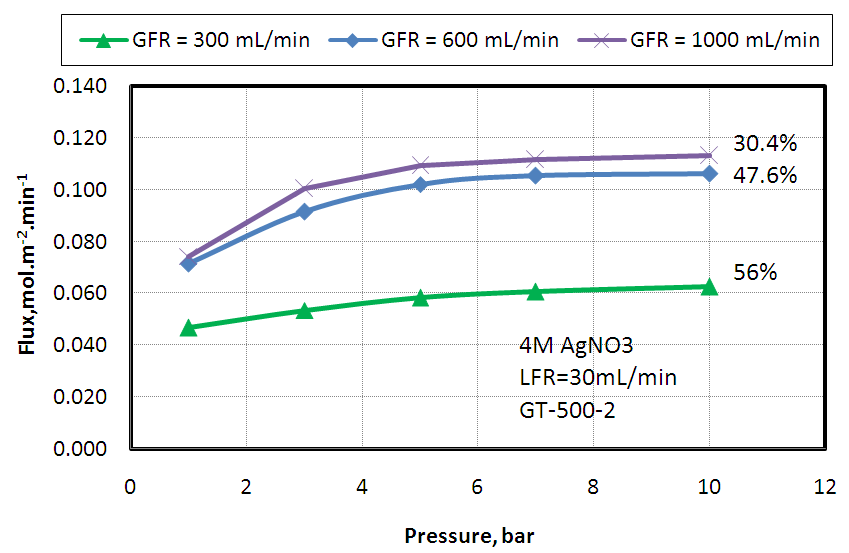 | Figure 4. Effect of feed gas pressure on Ethylene absorption flux at different feed gas flow rates and fixed solvent flow rate of 30 mL/ min and 4M AgNO3 |
3.1.2. Effect of Feed Gas Pressure on Ethylene Separation at Different Solvent Flow Rates
- The effect of feed gas pressure on ethylene separation from a mixture of 50% ethylene and 50% ethane using different solvent flow rates 30, 50 and 70 mL.min-1 and fixed gas flow rate (1000 mL.min-1) was studied and the obtained results are shown in Fig 5. The flux of ethylene increased with increasing the solvent flow rate and the removal percentage increased from 17.4% to 22% when the solvent flow rate increased from 30 to 50 mL/min, but with more increasing of solvent flow rate from 50 to 70 mL/min the removal percentage increased from 22% to 24.6% this is can be explained by the fact that increasing solvent flow rate will increase solvent velocity which will increase silver ions which are able to complex with olefins and increases separation but with more solvent flow rate the residence time of solvent in the desorption module will decrease and the regeneration of the silver nitrate will decrease as well resulting in less removal percentage than expected.
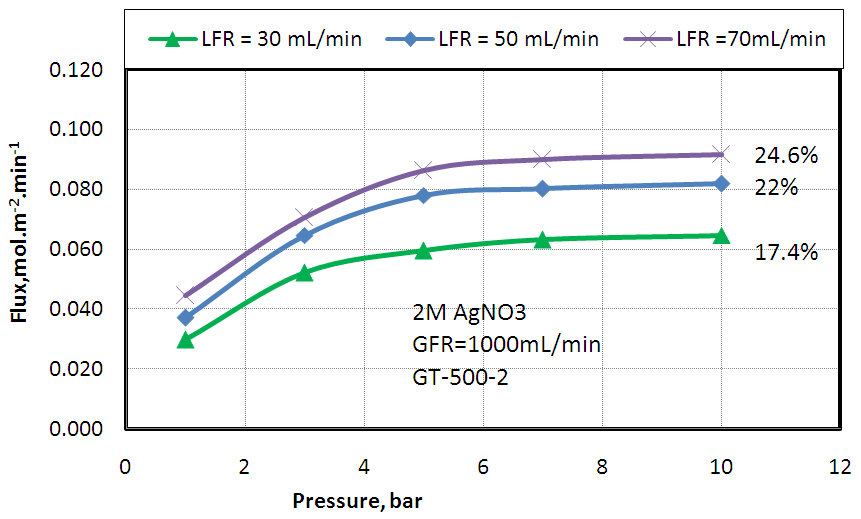 | Figure 5. Effect of feed gas pressure on Ethylene absorption flux at different solvent flow rates and fixed gas flow rate of 1000 mL/ min |
3.1.3. Effect of Feed Gas Pressure on Ethylene Separation at Different Silver Nitrate Concentration
- Ethylene separation from a mixture of 50% ethylene and 50% ethane was studied using different silver nitrate concentrations (2, 3, and 4M) at flow rate of 30mL/min. The gas flow rate was 600 mL/min. The effect of feed gas pressure on ethylene flux was studied and the result was shown in Fig.6. The observed enhancement in the ethylene flux at higher silver nitrate concentration paralleled the improvement of the solvent capacity (4M AgNO3 > 3M AgNO3 > 2M AgNO3). This is because the silver ions act as carriers facilitating the transport of the olefins from the feed stream to the permeate side.
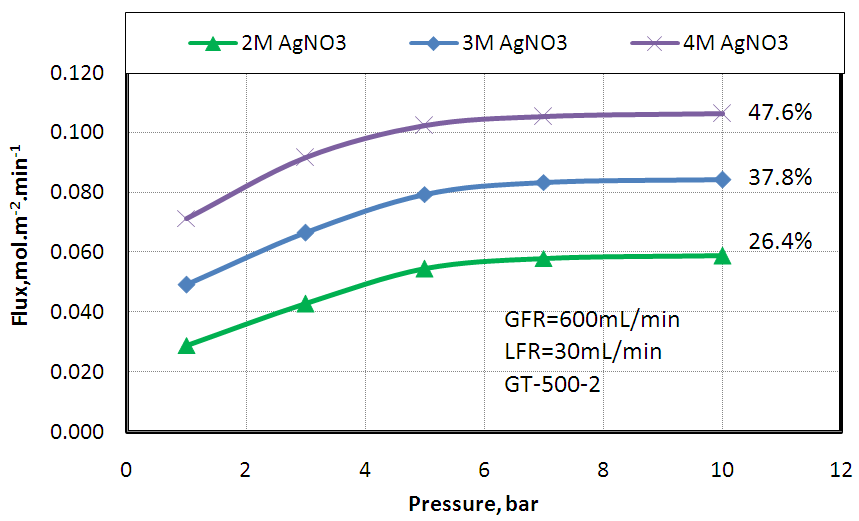 | Figure 6. Effect of feed gas pressure on Ethylene absorption flux at different silver nitrate concentration and fixed gas and liquid flow rates 600 and 30 mL/ min, respectively |
3.2. Modeling and Simulation
- A mathematical model employed for the countercurrent transport of C2H4/C2H6 gas mixture and silver nitrate aqueous solution as the absorption solvent in a gas-liquid hollow fiber membrane contactor was investigated [6]. The previous model considered the effect of various operating parameter that affects the separation of ethylene from ethylene/ethane gas mixture at atmospheric pressure. Gas solubility was considered constant and independent of pressure, temperature and/or silver nitrate concentration. In this version of the model, the effect of pressure, temperature and silver nitrate concentration on gas solubility in liquid silver nitrate is added to the model equations. The model is based on complete dissociated of silver nitrate. Ethylene absorption in a silver nitrate solution involves both physical absorption and chemical absorption due to the complexation reaction. Detailed of the model equations can be find elsewhere [6]. The physical solubility of a gas in a liquid at equilibrium can be described by the distribution coefficient. The empirical correlation for the ethylene- Ag+ system involving the solubility (s) of ethylene as a function of AgNO3 concentration, pressure, and temperature, the following equation satisfactorily correlates the experimental data with an average error of ± 8% [24].
 In this correlation, c is the silver nitrate concentration, P is the absolute pressure, and T is the temperature. Correlation results for the ethylene solubility values at is valid at pressures up to 0.64 MPa, silver nitrate concentrations from 1 to 6 M, and temperatures from 278 to 308 K are
  = 0.5780,
  = 9660,
  = 349.9,
  = 0.8602, and
  = -14.93. A plot of solubility versus pressure and silver nitrate concentration at constant temperature is shown in Figure 7. The figure shows that as ethylene partial pressure increases, gas solubility in aqueous silver nitrate increases, by contrast, the rate of increase in ethylene solubility is slightly higher at low pressure than that at higher pressure. At fixed partial pressure of ethylene, the solubility increases with the increase in silver nitrate concentration. The rate of increase in the solubility at low concentrations; for example, from 1M to 2M is somewhat higher than that from 3M to 4M. This phenomenon makes it obvious behind the rate of the slight increase in the percent removal of ethylene at high pressures, observed from the experimental data.
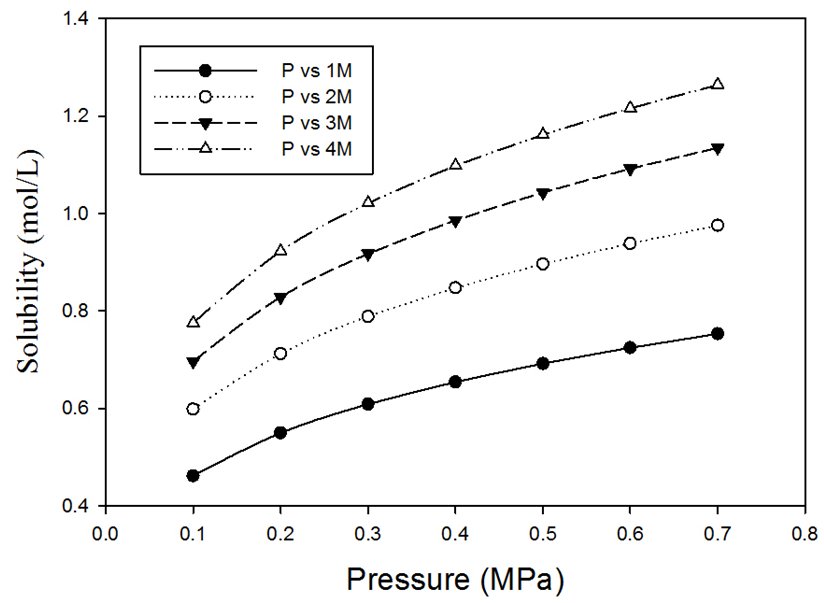 | Figure 7. Ethylene solubility in silver nitrate solution as a function of gas pressure and silver nitrate concentration |
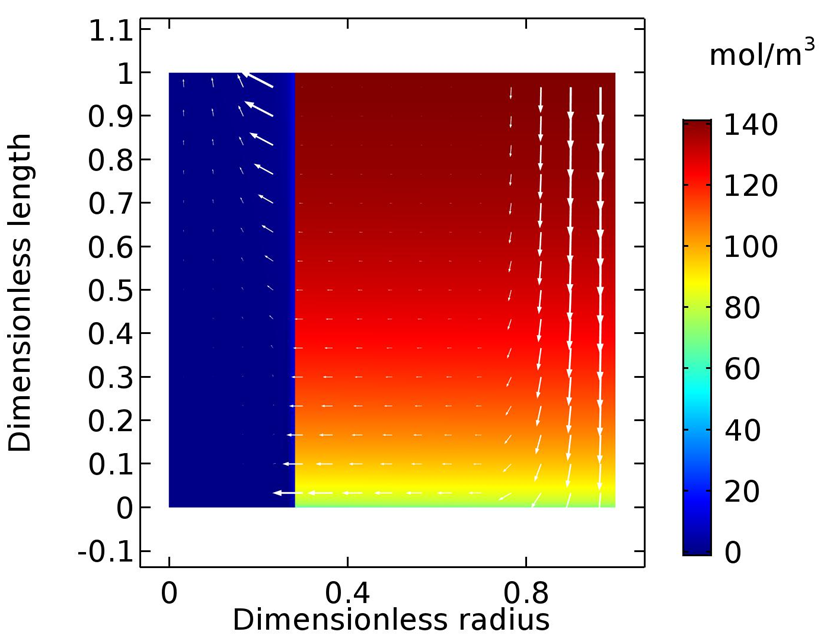 | Figure 8. 2D Surface plot for C2H4 concentrations profile, 0.7MPa, 4M AgNO3 |
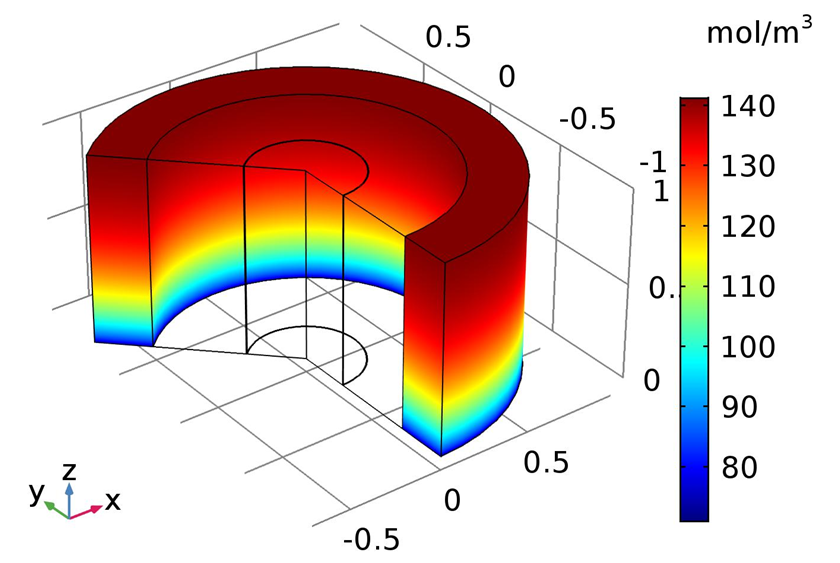 | Figure 9. 3D surface plot for C2H4 concentration profile in the shell side 0.7MPa, 4M AgNO3 |
 with inlet ethylene mole fraction of Y
  The percent removal increased downward along the membrane shell side toward
  that is as expected as explained before. The percent removal at a pressure of 1MPa is comparable to the value obtained from experimental data (56%) shown in Fig. 4 (Gas flow rate 300 ml/min, Liquid flow rate = 30 ml/min), the model predictions shows a value of 58%. The slight change is due to solubility value is applied for a range outside the optimum range of the correlation used in the model which is up to 0.7MPa.The model was validated with the experimental data, the results for the study of the effect of the inlet gas flow rate at fixed liquid flow rate (30 ml/min), fixed pressure (0.7 MPa), fixed silver nitrate concentration (4M) on the percent removal of ethylene is shown in Fig. 11. The figure shows the comparison between model predictions and experimental data for variable gas flow rate. The model predicted results were in an excellent agreement with model predictions.
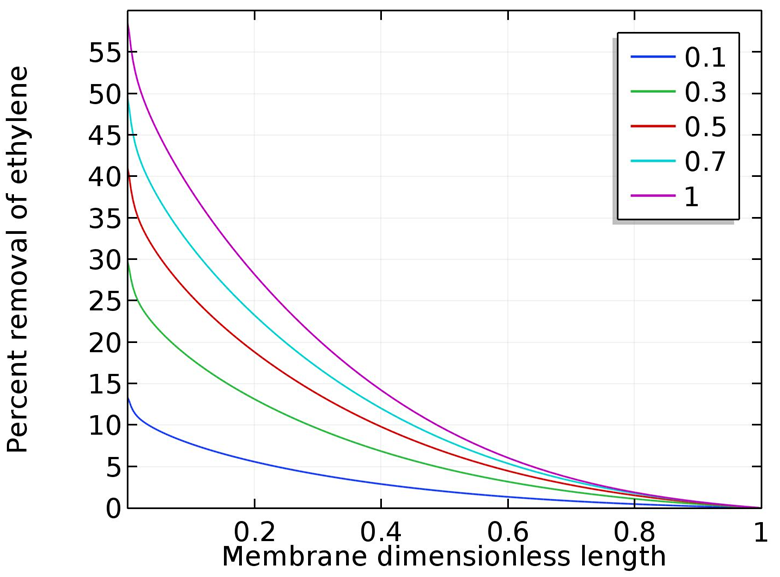 | Figure 10. Ethylene percent removal as a function of pressure, P in MPa, 4M silver nitrate, Gas flow rate 300 ml/min, liquid flow rate 30 ml/min |
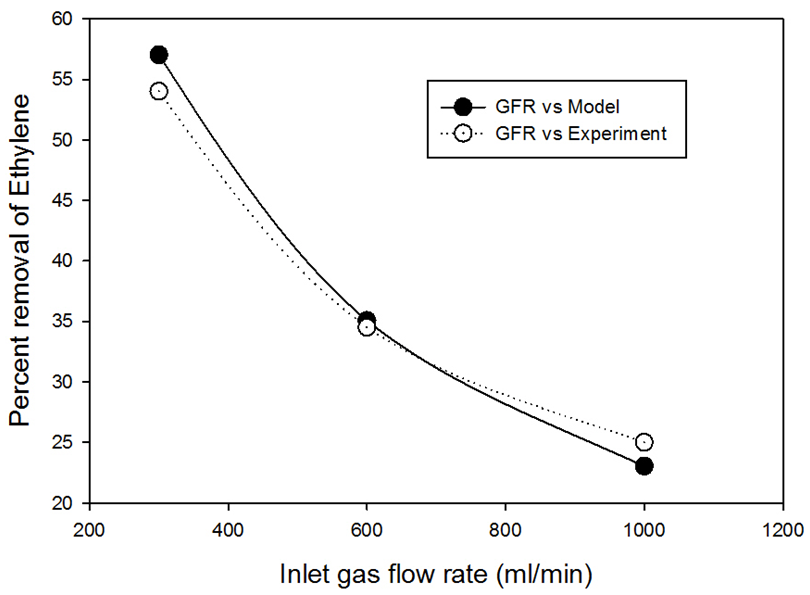 | Figure 11. Comparison of Model predicted results and experimental data, 4M AgNO3, 0.7MPa pressure, liquid flow rate, 30 ml/min |
4. Conclusions
- The effect of the operational parameters such as pressure, gas and liquid flow rates and silver concentration on the separation process of C2H4 and C2H6 using silver nitrate in hollow fiber membrane contactor was studied. The experimental results reveal that, the flux of ethylene increases with increasing pressure up to certain values. The flux of ethylene increases following a linear trend with increasing silver ion concentration and liquid flow rate. A mathematical model that conserved axial and radial diffusion along with gas solubility as a function of pressure, temperature and silver nitrate concentration was developed for the simultaneous transport of C2H4 and C2H6 in HFM contactors whereas silver nitrate is the absorbent carrier solvent. The model considered non-wetting model of operation for countercurrent gas–liquid flow arrangement. The model was confirmed with the accomplished experimental data. The model predicted results were in outstanding covenant with the experimental numbers.