-
Paper Information
- Paper Submission
-
Journal Information
- About This Journal
- Editorial Board
- Current Issue
- Archive
- Author Guidelines
- Contact Us
American Journal of Polymer Science
p-ISSN: 2163-1344 e-ISSN: 2163-1352
2015; 5(2): 35-40
doi:10.5923/j.ajps.20150502.01
Effect of Low Gamma-Irradiated dose on the Structure of Cellulose Triacetate Films: II. Positron Annihilation Spectroscopy
 Abstract
 Reference
 Full-Text PDF
 Full-text HTML
M. S. Abd El Keriem
Physics Department, Faculty of Science, Ain Shams University, Abbasia, Cairo, Egypt
Correspondence to: M. S. Abd El Keriem, Physics Department, Faculty of Science, Ain Shams University, Abbasia, Cairo, Egypt.
| Email: |  |
Copyright © 2015 Scientific & Academic Publishing. All Rights Reserved.
Positron annihilation spectroscopy, thermogravimetric and FT-IR techniques are used to study the effect of low doses of gamma irradiation on microscopic structure of cellulose triacetate films. The irradiation is done at room temperature with doses ranging from 5 to 25 kGy. The ortho-positronium lifetime component associated with the pick-off annihilation of positronium trapped by the free volume is analyzed. Alternation in the ortho-positronium lifetime is observed reaching to a minimum value at10 kGy which is followed by a sharp increase at 15 kGy. Afterward, the ortho-positronium lifetime remains almost constant up to 25 kGy. The intensity of ortho-positronium component, I3, revealed an opposite trend with respect to the ortho-positronium lifetime manner. The obtained results are discussed on the basis of free volume model. The thermogravimetric and FT-IR measurements bearded out the findings of positron annihilation spectroscopy and explained the variations on the CTA microstructure due to the effect of the low doses of gamma irradiation.
Keywords: Positron annihilation, Gamma irradiation, Cellulose triacetate
Cite this paper: M. S. Abd El Keriem, Effect of Low Gamma-Irradiated dose on the Structure of Cellulose Triacetate Films: II. Positron Annihilation Spectroscopy, American Journal of Polymer Science, Vol. 5 No. 2, 2015, pp. 35-40. doi: 10.5923/j.ajps.20150502.01.
Article Outline
1. Introduction
- Materials that have two refractive indices are known as optical birefringent materials. Birefringence is one of the most important properties of polymer films that are used as wave retarders [1]. Birefringent polymers are used in modern high-performance 3D display devices and in organic electro-luminescence displays that require retarders with well-controlled birefringence and wavelength dispersion [2, 3]. Polymer such as cellulose triacetate (CTA) is typically a dielectric with Fermi energy is about 160 times as great as the thermal energy at room temperature [4]. CTA as a uniaxial material has many diverse scientific and technological applications [5] due to its attractive properties [1, 6-10]. Many of optoelectronics devices depend basically on the birefringence property of the used materials [11].The variation in birefringence dispersion versus irradiation dose was investigated [12] leading to negative birefringence that could be utilized in CTA to design high-performance quarter wave retarders. The sign and wavelength dispersion of birefringence in CTA can be also controlled by irradiation [13]. Study the structure of irradiated polymeric materials is essential in order to produce achromatic or apochromatic retarders which can provide constant phase retardation independent of wavelength of light [14, 15]. Such retarders with white light sources are ideal for polarization spectroscopy, magneto-optical experiments, ellipsometry, polarimetry and telecommunications [16, 17].Recently, the structure and properties of nonirradiated CTA and other types of polymers have been studied using positron annihilation lifetime spectroscopy under different preparation processes and treatments [18-28]. Therefore in this work, positron annihilation lifetime spectroscopy (PALS) is used to study the structure of CTA films subjected to γ–irradiation. Fourier transformation infrared spectroscopy and thermal analysis are applied to provide information on the structure of γ–irradiated CTA films and their induced birefringence.
2. Experimental Details
- Cellulose triacetate is made from cellulose by heterogeneous acetylation of the corresponding respective cellooligosaccharide and is purified by recrystallization twice from ethylacetate–hexane. All six OH groups in the cellobiose units of cellulose are substituted by six COOCH3 groups. It is usually a rigid amorphous polymer as assumed from the molecular structure (Fig. 1). Developed Fortpan photographic film plates with dimensions of 6.3 cm× 8.8 cm and a thickness of 180 ± 1 μm were investigated. The samples were irradiated with the following doses: 5, 10, 15, 20 and 25 kGy. Irradiation process with gamma rays was performed at the National Center for Radiation Research and Technology, Cairo, Egypt. The gamma irradiation was done using Russian cell (60Co source) of the model ISSLEDOVATEL. The dose rate of the cell was 10 kGy/100 min.
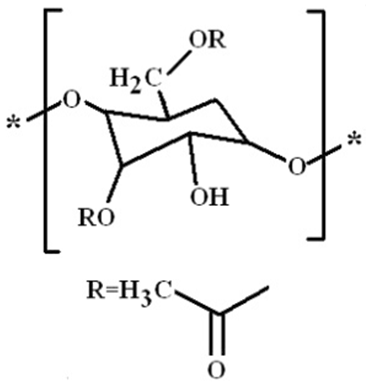 | Figure 1. Cellulose triacetate chemical structure |
3. Results and Discussion
3.1. Positron Annihilation Spectroscopy
- The positron lifetime spectra for nonirradiated and gamma-irradiated CTA samples are analyzed in terms of three lifetime components to give the best variance ratio and most reasonable standard deviations. Each lifetime component is corresponding to the average annihilation rate of a positron in a different state. The shortest lifetime component (τ1) belongs to the annihilation of p-Ps atoms, and the intermediate one (τ2) arises from the free annihilation of positrons in the polymer matrix while the longest-lived component (τ3) is attributed to the o-Ps atoms in free volumes of amorphous regions of polymer via the pick-off annihilation.A semi-empirical approach based on a quantum mechanical model developed by Tao [31] for molecular liquids was used to correlate the o-Ps lifetime, τ3, (in ns) to the radius, R, of a spherical cavity according to the relation [32]:
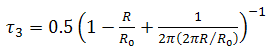 | (1) |
 and ΔR = 0.1656 nm is the thickness of the homogenous electron layer in which the positron annihilates [25]. Thus the average of the o-Ps hole size
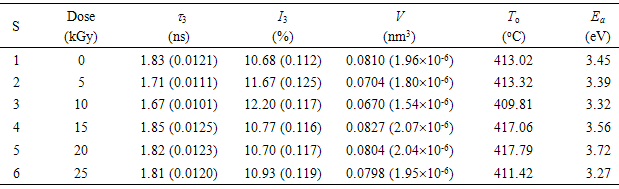
 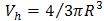 , which is probed by the o-Ps lifetime (τ3), can be calculated. The probability of the o-Ps formation is called intensity of the o-Ps (I3) and it is proportional to the number of cavities in the investigated systems [33].Gamma irradiation of CTA polymeric films shows a decrease in the free volume size. It leads to an obvious decrease in the ortho-positronium (o-Ps) lifetime with an increase in the intensity of o-Ps. Taking τ3 as a measure of the free volume hole size and I3 as a number of free volume holes, the lifetime of o-Ps and its intensity for the nonirradiated sample have been deduced to be τ3 =1.827 ± 0.005 ns and I3 = 10.68% ± 0.076%. The lifetime τ3 associated with the pick-off process as a function of gamma irradiation doses is shown in Fig. 2.It is known that bond lengths of C=O bonds are around 123 pm in carbonyl compounds while for C–O bonds are in the range of 143 pm. So if the irradiation does not alter the interstices positions between the carbonyl groups but only drives some C=O bonds to decompose and forming C–O bonds, accordingly the resultant spaces between different carbonyl groups shrink. Beside the formation of free radicals, the shrinking of space interstices available in the polymer network minimizes the free volumes sizes. This situation would also lead to an increase in the rate of annihilation process which is associated with more detected intensity.The obtained data of the lifetime (τ3) and free volume size for gamma irradiation samples exhibits three regions as shown in Figs. (2a) and (2c). First, there is a smooth decrease to about 10kGy. The 8.7% decrease in τ3 is related to the formation of free radicals and the 17.3% decrease in the free volume is due to of the formation of C-O bonds in the carbonyl group. The free volume sizes are estimated using Eq. (1) and is found to decrease from 80 to 67 Å3 at 10 kGy. Second, an increase in I3 is apparent up to 15 kGy. It remains constant with increasing the irradiation dose up to 25 kGy. As shown in Fig. (2b), I3 shows an increase at the beginning up to 10 kGy. Such increase in I3 is mainly attributed to the presence of carbonyl groups, which are created during irradiation [34]. With increasing the dose, a smooth decrease in I3 is attained up to 15 kGy and is followed by leveling off up to 25 kGy, which is familiar for γ-irradiated polymers [35]. This behavior may indicate that the stability in the structure has been achieved.
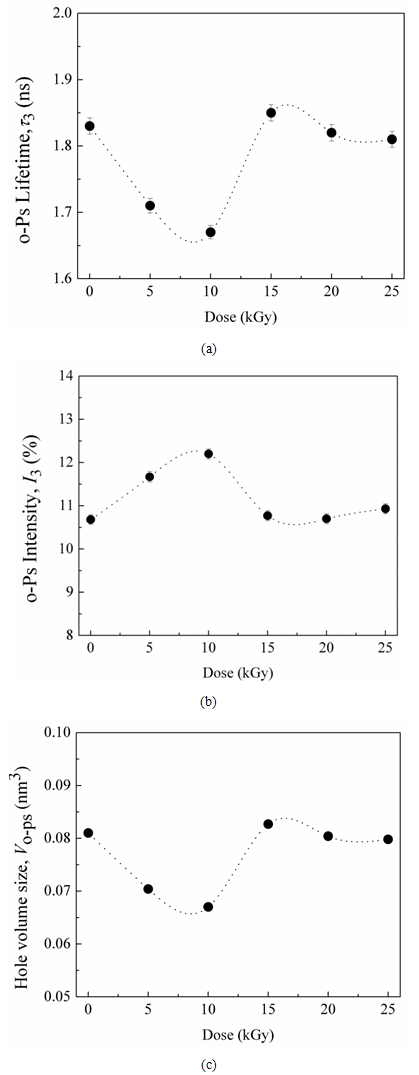 | Figure 2. Variation of lifetime, τ3, (a), intensity, I3, of the o-Ps component (b) and free volume size, V, (c) as a function of gamma doses |
3.2. Thermogravimetric Measurements
- In thermogravimetric method, TG curves, Fig. 3, are obtained at a heating rate of 10 Co/min by using the expression:
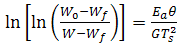 | (2) |
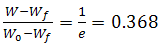 | (3) |
 against θ leads to a straight-line relationship where the decomposed ratios are equal. Hence, the activation energy of decomposition Ea can be evaluated from the slope of the line.
 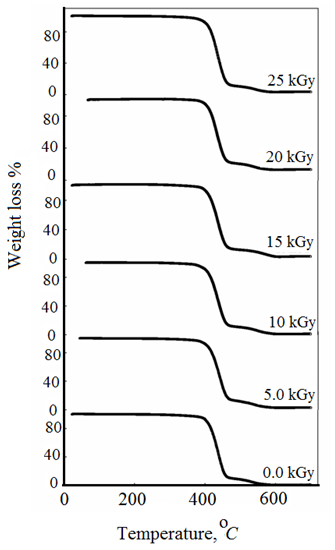 | Figure 3. TGA thermograms measured in the temperature range of 20-700 oC for different investigated CTA samples |
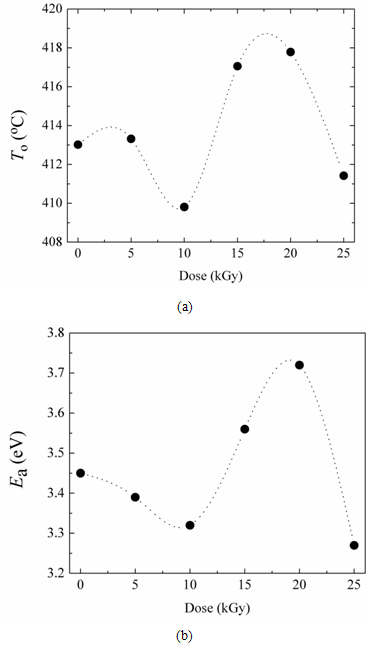 | Figure 4. (a) Variation of onset temperature of decomposition, To, with the gamma dose, (b) Variation of activation energy of thermal decomposition, Ea with the gamma dose |
|
3.3. FT-IR Measurements
- Fig. 5 illustrates the measured absorbance for CTA spectrum in the IR region between 4000 – 400 cm-1. Bands at 1219 and 1055 cm-1 are attributed to stretching modes of C-O single bond. CTA contains carbonyl group which absorbs in the region 1760-1665 cm-1 due to the stretching vibration of the C=O bond. This distinctive carbonyl band is particularly useful for diagnostic purposes because it has a characteristic high intensity. Fig. 6 shows the variation of intensity of IR carbonyl relative percentage of absorbance intensity (Ia) for irradiated and non-irradiated CTA samples as a function of the gamma irradiation doses. It is clear that Ia exhibits an oscillated changes in the relative percentage of absorption intensity of carbonyl bands. The observed changes in the relative carbonyl absorption bands are good sign of the effectiveness of the irradiation process even with these small irradiation doses. The carbonyl relative percentage of absorbance intensity, Ia, data exhibits three regions. First, there is a smooth decrease in Ia equal to 2.3% with increasing the dose up to 10 kGy. The decrease in the carbonyl relative percentage of IR absorbance intensity, Ia, means that the carbonyl group is partially dissociated. Subsequently as the dose increases, an increase of 1.5% in the carbonyl Ia is calculated up to a irradiation dose of 20 kGy. This increase is mainly due to the reformation of C=O bond of carbonyl groups relative to C-O bond numbers. Increasing of gamma irradiation more to 25 kGy leads to inflection point associated with a decrease in the Ia value.
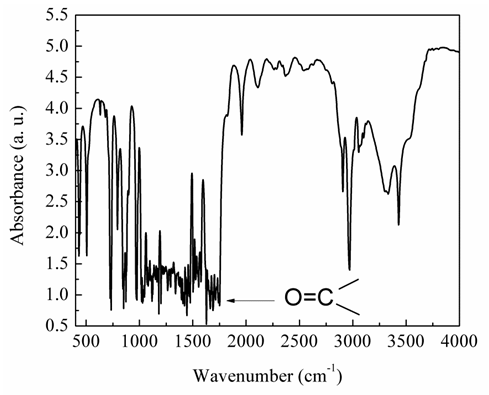 | Figure 5. FT-IR spectrum of CTA sample |
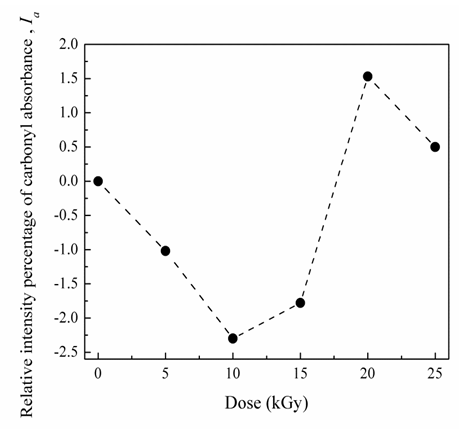 | Figure 6. Variation in IR relative intensity percentage of CTA carbonyl absorbance as a function of the gamma irradiation doses |
4. Conclusions
- The sensitivity of positron annihilation spectroscopy detects successfully the variation on chemical microstructure of CTA polymeric films after low doses gamma irradiation. The different positron annihilation spectroscopic parameters (such as positron lifetime and intensity) depend on the state of the electron participating in the annihilation reaction and on the available free volumes as well. The results of thermogravimetric analysis and FT-IR spectroscopy confirmed the findings of positron annihilation spectroscopy. The explanation and analysis of the obtained data is afforded by the formation or decomposition of carbonyl group in CTA after gamma irradiation.