Samuel E. Agarry1, Ganiyu K. Latinwo1, Tinuade J. Afolabi1, Semiu A. Kareem2
1Department of Chemical Engineering, Ladoke Akintola University of Technology, Ogbomoso, Nigeria
2Department of Chemical Engineering, Federal University of Technology, Yola, Nigeria
Correspondence to: Ganiyu K. Latinwo, Department of Chemical Engineering, Ladoke Akintola University of Technology, Ogbomoso, Nigeria.
| Email: |  |
Copyright © 2015 Scientific & Academic Publishing. All Rights Reserved.
Abstract
Performance characteristics such as Indentation Force Deflection (IFD), Tensile strength and Elongation-at-break of flexible polyurethane foam reinforced with calcium carbonate filler, were evaluated using a 23 variables factorial design. The process variables studied were composition of calcium carbonate, its particle size distributions, and evolved temperatures for formation of components (allophanate and biuret) of polyurethane foam hard segment domains. Interactions were observed between CaCO3 composition and particle size distributions as well as with the evolved temperatures. The design results for IFD suggested rejection of the particle size by the foaming process and the experimental data confirmed composition and temperature effects. Tensile strength and elongation-at-break show the significance of the composition and particle size effects. These experimental findings should be taken into account in the design of foaming process incorporating filler, as it affords the practicability of determining which compositions and particle size to meet the requirement for specific polyurethane foam applications.
Keywords:
Flexible polyurethane foam, Calcium carbonate, Factorial design, Mechanical property
Cite this paper: Samuel E. Agarry, Ganiyu K. Latinwo, Tinuade J. Afolabi, Semiu A. Kareem, Model Predictive Performance of Filled Flexible Polyurethane Foam, American Journal of Polymer Science, Vol. 5 No. 1, 2015, pp. 1-9. doi: 10.5923/j.ajps.20150501.01.
1. Introduction
Polyurethane (PU) foams are ubiquitous in the modern built environment. They are major consumer plastic materials with an annual production capacity of nearly 12 million tons [1]. The distribution of various polyurethanes used was as follows: 29% rigid foams, 37% flexible foams, 12% elastomers and 12% coatings [2]. Within an expanding PU market, attention can be drawn to flexible PU foam (FPF) which is mainly used to create the soft cores of sofas and other upholstered household furniture, commercial / institutional furniture such as office chairs and sofas, seating for theaters and stadiums, armrest, headrest and other interior systems for automobiles, airliners, trains, buses, etc., and as packaging and bedding due to their high rubber-like elasticity and high mechanical and chemical resistance properties. Furniture and bedding represent the largest end-use-market for FPF, accounting for 76% of all flexible polyurethane slab-stock foam (FPSF) consumption. FPF is ideal for this purpose because of its resiliency, durability, comfort, support and other favorable properties.The mechanical properties of cellular foams are primarily controlled by the chemicals constitutive of the hard and soft segment phases in the foam structure. Generally accepted morphology of toluene di-isocyanate reactions with polyol and water for FPSF matrix consists of the soft segment phase, the ureas which when aggregated to a critical size, phase separate into hard domains also called micro-phase and large structural units called ‘urea balls’ or macro phase or precipitates [3, 4]. The morphology may contain reaction products of urea and isocyanate – biuret as well as reaction product of urethane linkages and isocyanate – allophanate. Both biuret and allophanate segments are particularly important in introducing additional physical crosslinks that improve hardness of foam, but are stable only at reaction temperatures of 110 – 130℃ and are reversed as the temperature approaches 134℃ [5]. Also, the chemical structure of hard segment domains form the bidentate hydrogen bonds which results when polyurea carbonyl groups associate with both hydrogens of adjacent polyurea groups resulting in well-ordered packing that provides structure with further increase in load bearing characteristics [3, 6, 7]. For some years, studies on FPF have been extended to composite foams reinforced by the introduction of fibres [8] or metallic or mineral particles [7, 9-15]. This modification results in enhanced performance of FPF achieved by dispersion across the polymer matrix along with the polyurea hard segments. Through this means, shape, size and mobility of hard domains, mobility of soft segments, load bearing characteristics, and overall flexibility and modulus of the polymer matrix can be affected. Properties of FPF can be varied over a wide range to meet specific application portfolios. Thus, it is proposed that these properties might play a key role on the composition and particle sizes of filler selected to meet target application requirements.Load-bearing properties and modulus characteristics of FPF have been improved by mineral calcium carbonate [16-18]. The organic PU composites with inorganic calcium carbonate nano- or micro- scale building blocks combine the advantages of the inorganic material (e.g. rigidity, thermal stability) and the organic polymer (e.g. flexibility, ductility and processability). Businesses in polyurethane foam manufacture have avail themselves of these benefits especially with calcium carbonate [19], for reasons of above, as well as for reason of replacement to commonly used copolymerpolyolcontaining graftpolystyerene-polyacrylonitrile particles as reinforcing agent. This is because copolymer polyols are expensive and create problems of clogging [7]. Methods can be developed for high-fidelity models based on description of the underlying physics of foaming process. By this model, a better understanding of the different phenomena which occur within the foam system is achieved. Further, the system overall behavior and extrapolation to conditions beyond those encountered for experimentation are possible. Such models can be used to predict performance characteristics of foam and can provide information that helps to develop whole ranges of formulation protocols. Employing models to predict mechanical properties of foam with different formulation requirements can reduce the time-to-market and cost of production. Predictive models of mechanical properties of polymeric foams have mostly been carried out through multi-scale modeling approach based on the Gibson and Ashby model [20]. Multi-scale modeling relies on a step-by-step passage of details from atomistic level tomesoscopic and on to macroscopic level. At the atomistic level, binding energy between individual components of polymer composite system constitutes the input parameters for the higher level mesoscale simulations. Density profiles and system morphologies are the output parameters from the mesoscale and are mapped on to the final macroscopic properties. This approach has been used to predict elastic modulus, thermal conductivity, and permeability of polystyrene, polyamide, and thermoplastic polyurethane [21]. Fereidoon and Taheri [22] have also used the Gibson and Ashby model [20] to develop a model predicting energy absorption characteristics of open cell polypropylene foams. Saint-Michel et al. [15] reported the effect of filler size on mechanical properties of high density PU foams. Mathematical models based on Gibson and Ashby was employed to predict elastic and viscous modulus of rigid PU foam systems. Mechanical properties of biodegradable cellular foam made from polyvinyl alcohol filled with talc powder have been predicted by a different approach employing factorial analysis. Optimum formulation composition of the polymer-filler composite used as cushioning material was obtained by response surface methodology (RSM) [23]. The study revealed the effectiveness of RSM in the development and optimization of cellular foam products. The basic principle of RSM is to relate product properties of regression equation that describe interrelations between input parameters and product properties [24]. The regression equation follows the black box model by factorial experiments based on varying all factors (process variables) simultaneously at a limited number of factor levels (the established limit of variation of the selected process variables). The design protocols implies the necessary randomization to avoid but detect systematic errors and also, to reduce time-consuming replication of experiments.Arising from the literature survey, no model yet exists to predict performance of amorphous thermoset FPF and its composites. In our previous study [19], we have replaced certain fractions of conventional polyol with calcium carbonate of different compositions and particle size distributions and obtained a representation of the binding energy at the atomistic level in terms of temperatures at a time when all the foam components, that is, filler, polymer matrix, and quat molecules have interacted. In the present study, we focus on implementing the temperature at end of reaction, filler compositions, and particle size distributions as inputs parameters in black box macroscopic model to predict the foam’s mechanical properties. Thus, a factorial design was applied to the processing conditions: calcium carbonate compositions, calcium carbonate particle size distributions, and temperature at end of reaction.
2. Materials and Methods
Flexible polyurethane foam composites(FPFC) were prepared from polyether triol (Konix FA-717, 3500 molecular weight, Korea polyol Co.) with an OH value of 44 mg KOH/g polyol and toluene di-isocyanate T-80 (80:20 Scuranate, Lyondell) with an average functionality of 2.7. The formulation selected was to achieve FPFC of a target density of 25 kg/m3. Water was used as the blowing agent in all cases. Catalysts used were dibutyltindilaurate (D22, Union Carbide) and dimethylethanolamine (DABCO, Air products). Naturally occurring mineral calcium carbonate was used as filler. The filler have an average size distribution of 0.06, 0.5, 3.5, 10, 20, and 841 μm. Compositions of the filler were varied from 5 wt% to 40wt% volume fractions. The surfactant was a Niaxsilicone-polyol block copolymer, L-580. The foam was prepared by substituting certain percentages of the polyol with the equivalent weight fractions of calcium carbonate to reduce the quantity of polyol for cost prospective without adversely affecting the mechanical properties.
2.1. Factorial Design
The objective functions in the polyurethane foam composite system were the 65% indentation force deflection (65% IFD), tensile strength, and elongation-at- break and are represented by the response Y in Eq. (1). The input parameters (which are three independent variables) are: volume fraction, VF (g) of the calcium carbonate (X1); particle size of the calcium carbonate, PS (μm) (X2), and the temperature at end of reaction, T (K) (X3). The mathematical relationship of the response (objective function, Y) on these variables can be approximated by a polynomial equation [25, 26]. | (1) |
with the regression parameters being  the intercept parameter,
  the linear coefficients,
  the cross product (interactions) coefficients and
  and
and  the quadratic and cubic coefficients, respectively. Application of response surface methodology is only possible when the interactions among three and more factors (coefficients
 are negligible and the above polynomial equation resume to a quadratic polynomial response [25]. Multiple regression analysis was used to obtain the correlation coefficients
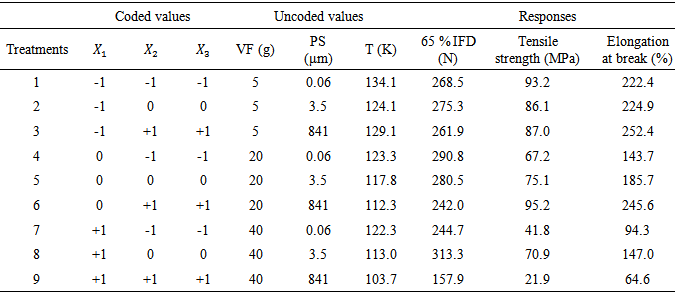
  and the equation can be used to predict the mechanical properties of the polyurethane foam. Factorial planning was initiated with the three variables each one at two levels (-1/+1) (Table 1). In using Table 1, the temperature is not known a priori, but determined from experiments for different treatment combinations. The aim of the design was to select the most important variables that influence the mechanical properties on the basis of the statistical approaches of experimental design, and to evaluate the process variable effects and their interaction by means of statistical test.
Table 1. Factorial planning arrangement and responses
 |
| |
|
2.2. Polyurethane Foam Processing
Syntheses were performed in the R & D laboratory of Vitafoam Nigeria Plc. The components of the foam formulation, polyol, catalysts, surfactant and filler were mixed for 10 seconds using an 8 hp electric mixer at 1400 rpm. The isocyanate was then added and the components were mixed for 5 seconds at 1400 rpm at which point they were poured into an open box having dimensions 25 x 14.8 x 16.5 cm (Figure 1) and allowed to cure. The cubical box contain a thermocouple centered to its base and protruding to the top and two other thermocouples inserted to the side of the box, one at the base and one at the top section. The outputs of the thermocouples were continuously monitored. Averages of the maximum temperature at the end of reaction were obtained. These values were used as input parameters in black box models. Mechanical properties were obtained by cutting samples from the foam block along the foam rise direction and subjected to tests according to ASTM D 3574 – 81 and ASTM D 618 – 61. All tests were conducted at 23 ± 2℃ temperature and a relative humidity of 50 ± 5%. The test specimens were placed in the test room 12 hours prior to test. Averages of three replications were obtained for all experiments and the values with standard deviations of less than 10% were used. 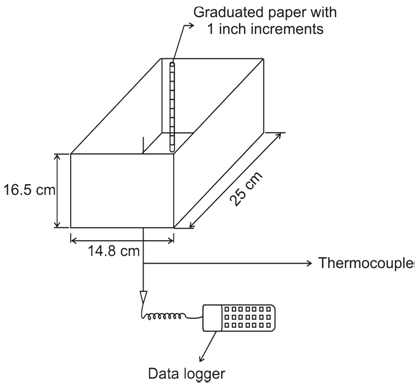 | Figure 1. Temperature dynamics of polyurethane foam composite formation |
2.3. Analysis of Data
The regression analysis was carried out by the stepwise variable selection backward elimination procedure [24] for fitting the model, represented by Eq. (1), to the experimental data. This method involved using the experimental data on the 65% IFD, tensile strength and elongation-at-break in approximating black box model equations to establish relations between the residual of experiment for each response and input or control parameters in terms of coordinate variations. The set of equations obtained, neglecting terms in third order, which in this study, is a set of 9 equations in 9 unknowns is solved by the Gaussian elimination method to yield 9 correlating coefficients. The coefficients are put in Eq. (1) to yield the model equations for each of the response. The equations are able to predict the mechanical properties of the composite foam system and to determine as well, the effects of each control parameters and important interactions among them, with a confidence level of 95%. The factorial planning arrangement and responses for this system is shown in Table 1.
3. Results and Discussion
Regression analysis for different models with data of Table 1 yields the fitted quadratic models. Multiple regression equations were generated relating 65% IFD, tensile strength, and elongation-at-break to coded levels of the variables. The developed models are indicated in Eqs. (2 - 4). | (2) |
 | (3) |
 | (4) |
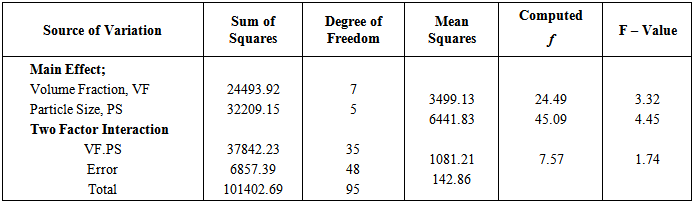
Implementing these equations for calcium carbonate of volume fractions 5 – 40 wt % and particle size distributions 0.06 and 841 μm yield the predicted mechanical properties of the composite polyurethane foam system. The information that arises from these models is the prediction of these properties from any formulation protocol. All the main effects including linear and quadratic, and interaction of effects were calculated for each model. The analysis of variances for all the models were obtained with the volume fractions and particle sizes of filler as the sources of variation. The temperature was known a priori in the model. Theses analyses are shown in Tables 2, 3, and 4, respectively.Table 2. The analysis of variance of filler volume fractions and particle size distributions to 65 % IFD
 |
| |
|
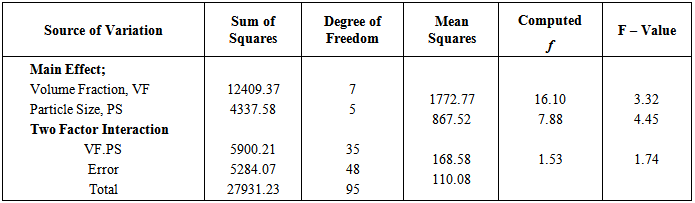
Table 3. The analysis of variance of filler volume fractions and particle size distributions to tensile strength
 |
| |
|
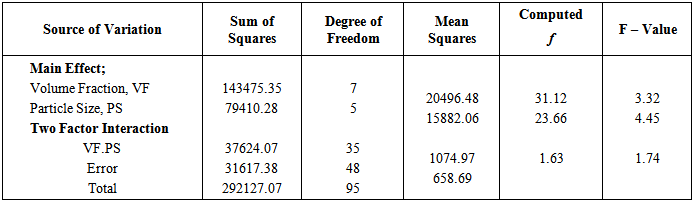
Table 4. The analysis of variance of filler volume fractions and particle size distributions to Elongation-at-Break
 |
| |
|
For clarity, the results are shown only at two particle size distributions. The key ingredients to flexible polyurethane foam applications in furniture and beddings are the support, comfort and durability characteristics. The 65% IFD is indicative of the foam hardness and characterizes the foam support to a seated adult. Table 2 shows that the 65% IFD is influenced both by the main effects of volume fraction and particle size as well as the interactions between these variations as a result of which the trend observed in Figure 2 indicate a systematic increase in the 65% IFD as the filler volume fraction is increased until 35 wt% volume fraction and then decreased at 40 wt %. The filler added in foam formulation modify the polymers constitutive of the cell wall struts. Exfoliation of the filler across the polymeric foam matrix absorbs the exothermic heat generated, to the extent of stability of the constitutive materials in the struts as the filler was increased from 10 – 35 wt%. Higher hard segment content in this volume fraction range provides more bidentate hydrogen bonding for increased cross linked density on the FPF structure. The struts constitute the polyurethane mass, filler, ureas, biuret, allophanate. These materials contribute to the mass/density of the struts and the overall density of the foam. For applications target, struts of high densities are formulated, particularly for their high mechanical property advantage obtained from the more urea bidentate hydrogen bonding possible. Foam of this type, however, have the disadvantage of low throughput volume. For cost reduction through high throughput volume and for enhanced mechanical properties, we have fixed the density of the polyurethane foam in this study and have supplemented the polyol with filler. All the foams produced have densities of ca. 25 kg/m3 and the mass of the constituents in the strut have been affected. The phenomenon responsible for this effect has been reported before in terms of the physics of foam formation [5]. Also, Figure 2 shows the predicted 65% IFD. It can be seen that both the experimental and predicted results agreed well.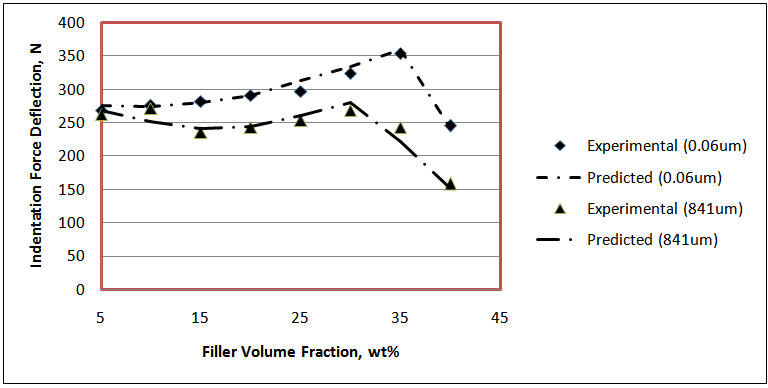 | Figure 2. Comparison between experimental and predicted 65 % IFD of reinforced FPF |
On the basis of the multiple regression Eq.(2), the main process variables affecting the 65% IFD are the volume fractions of the filler, the particle size of the filler and the maximum evolved temperature. Figure 3 shows the response surface plot interaction between filler volume fraction and filler particle size distribution as it affects 65% IFD. The response surface analysed revealed that the increase in filler volume fraction from 5 – 35 wt% present a strong positive effect, increasing the hardness of the foam characterized by the indentation force deflection. At 40 wt %, however, the indentation force deflection decreased. The earlier increase at volume fraction of 35 wt% and below suggest the fillers are exfoliated in the polyurethane matrix. This exfoliation add to the mass of the content of the cell struts. By this mechanism, the negative effect that should be introduced from the cut in the polyol fraction has been supplemented by the filler, loaded up to 35 wt %. The polyol available for reaction with equivalent stoichiometric isoyanate at 40 wt % filler addition is below a critical value for complete polyurethane mass of adequate molecular weight. Further, the reaction is ‘overwhelmed’ by this volume fraction to the extent the bidentate hydrogen bonding in the ureas are absent.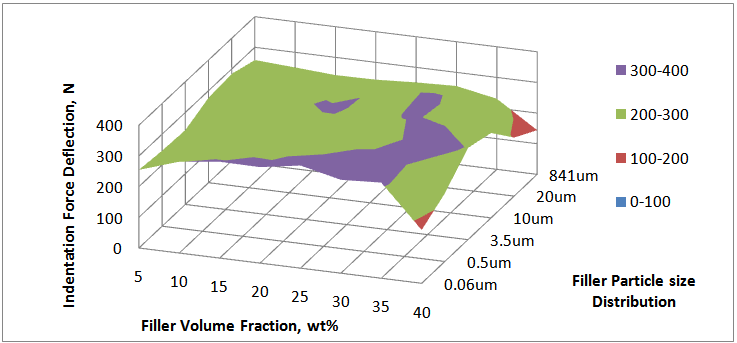 | Figure 3. Surface response plot of flexible polyurethane foam’s 65 % IFD |
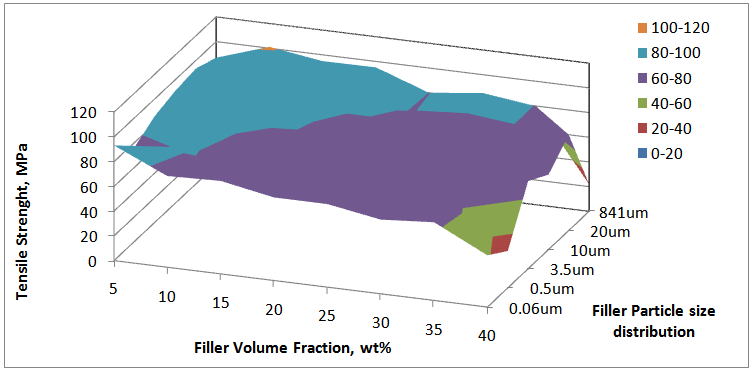
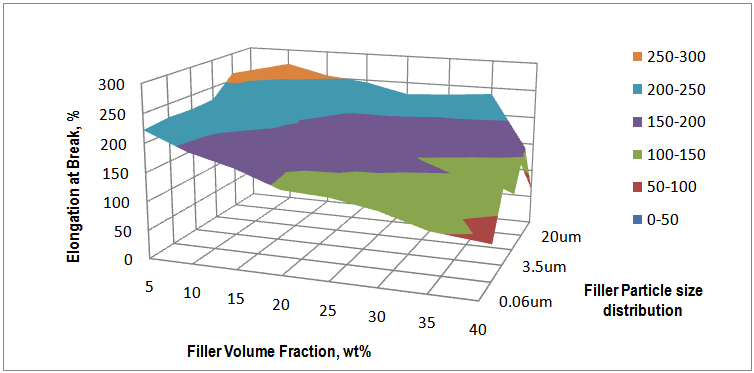
For these reasons, the 65 % IFD at 40 wt% loading of the calcium carbonate decreased.The particle size distributions of the filler have negative effect on the indentation force deflection. Figure 3 shows that the calcium carbonate particle size varied from 0.06 to 3.5 μm increased the indentation force deflection of the composite polyurethane foam. Coarse filler having particle sizes from 10 to 841 μm, however, decreased the indentation force deflection. FPF matrix have segmented structure with separated flexible polyether soft segment phase and hard urea domains of approximately 3 – 6 nm in size with inter domain spacing of 7 – 12 nm [6]. Into this architecture, the fine nano- and micro- fillers (0.06 – 3.5 μm) interact with the soft segment increasing its mass and also with the hard domain decreasing its mobility, but with no influence on the bidentate hydrogen bonding. On these premise, they reinforce the hardness of the FPF. Coarse fillers present the opposite of the trend observed in the fine filler. By this trend, the increase in the grain sizes of the filler particles from 10 – 841 μm reduced the 65% IFD. The maximum evolved temperature in the composite PU foam formation has a moderate positive effect on the 65% IFD. The temperature has interactions both with the filler concentrations and particle sizes in affecting the hardness of the FPFC. Considering the volume fractions, it is observed that there is an increase of 65% IFD as the filler loading is varied from 5 – 35 wt % for a filler of particle size 0.06 um. An increase in 65% IFD is also observed for filler of 841 um across all the filler loadings. However, there is a ca. 17 % differential in the 65% IFD between these two granulometries with the 0.06 um sized filler having a higher IFD to the 841 um sized filler acoss the loading from 5 – 35 wt%. At 5 wt%, the IFD is 268.5 N and 261.9 N for the 0.06 and 841 um sized filler, respectively. The maximum evolved temperatures at this particle sizes and volume fraction are 134℃ and 122℃, respectively. At 20 wt% filler loading it can be seen that the IFD is 290.8N and 242N for the 0.06 and 841 um sized filler, respectively, while the maximum evolved temperatures are123.3℃ and 112.3℃, respectively. Although the 5 wt% loading produce a temprature higher than the 20 wt% loading (Table 1), the apparent decrease in the 65 % IFD at this filler loading is suggestive of the absence of components of cell wall strut – allophanate and biuret which have capability to induce hardness in foam and are stable in the PU foam matrix only at temprature range of 110 - 130℃ [27]. At 20 wt%, the maximum temprature evolved is within the range for formation of the constitutive chemical components for enhanced IFD. However, at volume fractions higher than 20 wt %, that is, 40 wt%, the filler serves as heat sink making substantial part of the heat generated absorbed or dissipated. The maximum evolved temperature is lower than 110℃ and low IFD is reported.The equations representing the responses tensile strength (Eq. (3)) and elongation-at-break (Eq. (4)) indicate that these properties are negatively affected by the main process variables volume fractions and maximum evolved temperatures, while they were positively affected by the filler’s particle sizes.Their is no significant interactions between the filler volume fractions and particle sizes (Tables 3 and 4). This implies that different volume fractions and different particle sizes have different effects on the tensile strength and that the effects is best observed by considering a particular volume fraction at all the particle sizes. There is a good agreement between experimental and predicted data for tensile strength (Figure 4). Figure 5 is the respose surface plot that shows the interaction between the filler volume fraction and filler particle size distribution as it affects tensile strenght. It is seen that there is a decrease in the tensile strength as the volume fraction of the filler having particle sizes 0.06 – 841 um is increased from 5 – 40 wt%. Further, the effect of the particle sizes is more apparent when one consider that at each of the volume fractions, the FPFC’s tensile strength is improved as the grain sizes of the reinforcing filler become large. Similar trends were observed for elongation-at-break (Figure 6). Just as for 65 %IFD and tensile strenght, there is also a good agreement between experimental and predicted data for elongatio-at-break (Figure 7).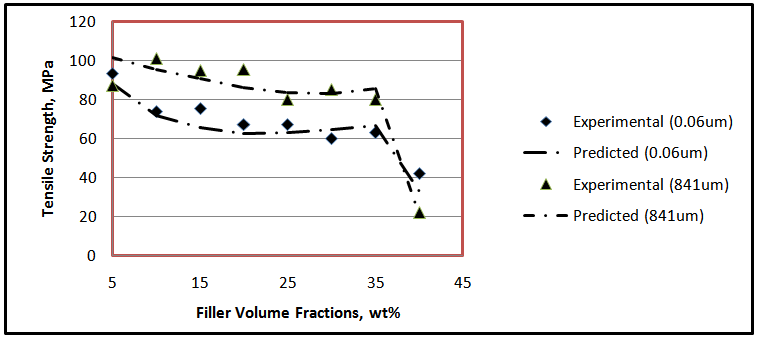 | Figure 4. Comparison between experimental and predicted tensile strength of reinforced FPF |
 | Figure 5. Surface response plot of flexible polyurethane foam’s tensile strength |
 | Figure 6. Surface response plot of flexible polyurethane foam’s elongation-at-break |
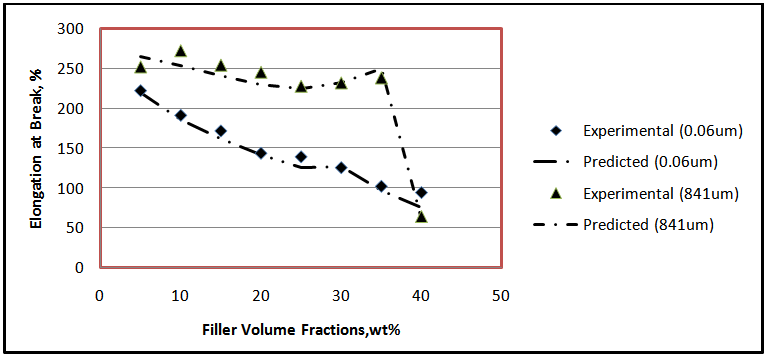 | Figure 7. Comparison between experimental and predicted elongation-at-break of reinforced FPF |
FPF architecture is made of long network of urethane chains with a particularly kinked conformation and a separated hard segment free of mobility.These features give FPF its characteristic relaxation modulus. Adding filler to interact with PU foam has been shown to affect its architecture and conformation [28]. As shown in both Figures 5 and 6, the modulus characteristic of the foam, as its tensilestrength and elongation at break, are decreased with incorporation of filler in the foam matrix. The decline is intensified with high volume fraction (up to 35 wt% at which the temperature evolved at end of reaction is between 110 – 130℃) of the filler because more surface area is available to restrict the hard segment mobility, reduce the urea tendency to form bidentate hydrogen bonding, and weaken the kinked conformation.
4. Conclusions
Factorial design experiments can be applied to study the behaviour of FPFC, allowing a simultaneous study of the effects of filler compositions, particle sizes, and maximum evolved temperatures during foam reactions on mechanical properties: 65% IFD, tensile strength and elongation at break.Prediction of these properties are possible through regression models developed from the factorial design saving the time-to-market of foam products by eliminating the traditional trial and error formulation prepation method. Fine nano- (60 nm) and micro (0.5 – 3.5 μm)- sized calcium carbonate increased the 65% IFD as the volume fraction of the filler was increased up to 35 wt%, while the coarse filler (10 – 841 μm) reduced the property. Tensile strength and elongation at break are reduced as the volume fraction of the filler is increased from 5 – 40 wt% for both fine and coarse filler particle sizes. However, at specified volume fractions these properties were increased as the grain sizes of the filler was varied from fine to coarse. From the cost prospective, micro-filler of particle size 3.5 μm at volume fraction 15 wt% can be recommended. This filler moderately increase hardness and density, decreased slightly tensile strength and elongation at break and can be a better choice for CPPs replacement.
ACKNOWLEDGEMENTS
The authors would like to gratefully acknowledge the management and staff of VITAFOAM Nigeria, Plc, Lagos, Nigeria for their cooperation in allowing usage of their foam materials, foaming facilities, technical expertise, and for providing fund for this research activity.
References
| [1] | AvarG (2008) Polyurethanes (PU). Kunststoffe Internationa l10: 123-127. |
| [2] | Valencia LB (2009) Experimental and numerical investigation of the thermal decomposition of materials at three scales: application to polyether polyurethane foam used in upholstered furniture. Ph.D Thesis, LCD Université de Poitiers. |
| [3] | Dounis DV, Wilkes GL (1997) Structure-property relationships of flexible polyurethane foams.polymer38 (11): 2819 – 2828. |
| [4] | Herrington R, Turner R,Lidy W (1997) Flexible foam fundamentals. In: Herrington R and Hock K (eds) Flexible polyurethane foams. Freeport, USA: The Dow Chemical Company, 3.1–3.57. |
| [5] | Latinwo GK, Aribike DS, Oyekunle L, and Susu AA (2010a) Evaluation and Modelling of the Dynamics of Filled Flexible Polyurethane Foam. Nature and Science 8(9): 159 – 167. |
| [6] | Kaushiva BD (1999) Structure-property relationships of flexible polyurethane foam, Ph.D Thesis, Virginia Polytechnic Institute and State University. |
| [7] | Javni I, Song K, Lin J, Petrovic ZS (2011) Structure and properties of flexible polyurethane foams with nano- and micro-fillers. Journal of cellular plastics 47(4): 357 – 372. |
| [8] | CotgreaveTC, Shortall JB (1977) The mechanism of reinforcement of polyurethane foam by high-modulus chopped fibres. J. Mater. Sci. 12(4): 708-717 |
| [9] | Barma P, Rhodes MB, Salovery R (1978) Mechanical properties of particulate‐filled polyurethane foams. J ApplPhys49: 4985. |
| [10] | Siegmann A, Kenig S, Alperstein D, Narkis M (1983) Mechanical behavior of reinforced polyurethane foams. Polymer composites 4(2): 113-119. |
| [11] | Krysztafkiewicz A, Maik M (1987) Modified precipitatedsilicas as polyurethane fillers. Colloids and polymer science 265: 704-710. |
| [12] | Vaidya NY, Khakhar DV (1997) Flexural Properties of Mica Filled Polyurethane Foams. J Cell Plast 33(6): 587-605. |
| [13] | Goods SH, Neuschwanger CL, Whinnery LL, Nix WD (1999) Mechanical properties of a particle-strengthened polyurethane foam. J Appl PolymSci 74(11): 2724-2736 |
| [14] | Javni I, Zhang W, Karajkov V, Petrovic ZS (2002) Effect of Nano-and Micro-Silica Fillers on Polyurethane Foam Properties. Journal of Cellular Plastics 38: 229-239. |
| [15] | Saint-Michel F, Chazeau L, Cavaillé J (2006) Mechanical properties of high density polyurethane foams: II Effect of the filler size. Composites Science and Technology66: 2709 -2718. |
| [16] | Nunes RCR, Fonseca JLC, Pereira MR (2000) Polymer-filler Interactions and Mechanical Properties of a Polyurethane Elastomer. Polymer Test 19(1): 93-103. |
| [17] | Chen L, Blizard K, Straff R, Wang X (2002) Effect of Filler Size on cell Nucleation during Foaming Processes. Journal of Cellular Plastics, 38: 139 – 148. |
| [18] | Latinwo GK, Aribike DS, Oyekunle LO, Susu AA, Kareem SA (2010b) Effects of Calcium carbonate of Different Compositions and Particle size distributions on the Mechanical Properties of Flexible Polyurethane Foam. Nature and Science 8(9): 92 – 101. |
| [19] | Latinwo GK, Susu AA, Aribike DS and Oyekunle LO (2010c) Effects of incorporation of calcium Magnesium carbonate on the mechanical and morphological properties of flexible polyurethane foam. science focus 15(1): 35 – 44. |
| [20] | Gibson LJ, Ashby MF (1997) Cellular solids: structure and properties, 2nd ed., Cambridge, Cambridge University Press. |
| [21] | Pereira SP, Scocchi G, Toth R, Posocco P, Nieto DR, PriclS, Fermeglia M (2011) Multiscale modeling of polymer/clay nanocomposites. Journal of multiscale modeling 3(3): 151 – 176. |
| [22] | Fereidoon A, Taheri SA (2012) Using finite element method to analyze the effect of microstructure on energy absorption properties of open cell polymeric foams. Journal of cellular plastics 48(3): 257 – 270. |
| [23] | Peng J, Wei K, Lui W (2005) Study of optimum feed compositions of biodegradable cellular foams blend with talc.Journal of cellular plastics 41: 457 – 473. |
| [24] | Tatarka PD, Cunningham RL (1998) Properties of protective loose-fill foams. J.Appl. Polym. Sci. 67(7): 1157 – 1176. |
| [25] | Box GEP, Hunter WG, Hunter JS (1978) Statistics for Experimenters: an Introduction to Design, Data Analysis and Model Building. John Wiley and Sons, New York, USA. |
| [26] | Otto M (1999) Chemometrics: Statistics and Computer Application in Analytical Chemistry. Wiley-VCH, Weinheim, Germany. |
| [27] | Klempner D, Sendijarevic V (2004) Handbook of Polymeric Foams and Foam Technology. 2nd Edition, Hanser Publishers, Munich. |
| [28] | Widdle RD (2005) Measurement and modeling of the mechanical properties of flexible polyurethane foam, Ph.D dissertation, Purdue University, West Lafayette, Indiana. |
 Abstract
 Reference
 Full-Text PDF
 Full-text HTML