Ibanga O. Isaac1, Okon D. Ekpa2
1Department of Chemistry, Akwa Ibom State University, Ikot Akpaden, P.M.B 1167, Uyo, Akwa Ibom State, Nigeria
2Department of Pure and Applied Chemistry, University of Calabar, P.M.B 1115, Calabar, Cross River State, Nigeria
Correspondence to: Ibanga O. Isaac, Department of Chemistry, Akwa Ibom State University, Ikot Akpaden, P.M.B 1167, Uyo, Akwa Ibom State, Nigeria.
| Email: |  |
Copyright © 2012 Scientific & Academic Publishing. All Rights Reserved.
Abstract
The kinetics of the preparation of biopolymers from two triglyceride oils- melon seed and cottonseed oils were studied using alcoholysis-polycondensation process. Six grades of biopolymers formulated to have oil content of 40% (A), 50% (B), and 60% (C) melon seed oil (MESO) and 40% (D), 50% (E), and 60% (F) cottonseed oil (COSO) respectively were prepared. The extent of polycondensation was monitored by measuring the volume of water of esterification evolved, determining the pH and acid value of aliquots of the reaction mixture at various intervals of time. The extent of the reaction (Pn) and number-average degree of polymerization ( ) were calculated from end-group analysis of aliquots of the reaction mixture withdrawn at various intervals of time. The rate of water evolution for short oil biopolymers- sample (A) and (D) were in the order of 10-1 cm3/min, while those of medium oil- samples (B) and (E) and long oil- samples (C) and (F) were in the order of 10-2 cm3/min. The pH of the in-process samples increases with decreased in acid values. The initial reaction rates followed second order kinetics and thereafter deviations were observed. The second order rate constants for all the samples were of the order 10-4 g(mgKOH)-1min-1.
Keywords:
Biopolymers, Kinetics, pH
Cite this paper: Ibanga O. Isaac, Okon D. Ekpa, Comparative Study on the Kinetics of the Preparation of Melon Seed and Cottonseed Oils Based Biopolymers, American Journal of Polymer Science, Vol. 4 No. 1, 2014, pp. 7-15. doi: 10.5923/j.ajps.20140401.02.
1. Introduction
The used of triglyceride oils in synthesis of alkyd resins (biopolymers) has been widely studied in recent times. This is due to environmental and eco-friendliness of this product. Alkyd resins are conventional binders used in the production of paints, varnishes and other coating products. The used of vegetable oils such as rubber seed, melon seed, cottonseed, tobacco seed, coconut seed and palm oils in synthesis and characterization of alkyd resins have been reported[1, 2, 3, 4, 5, 6, 7, 8, 9 and 10].There are two methods for alkyd resin synthesis – the monoglyceride process and fatty acid process[5, 11]. In fatty acid process, polyesterification yields the alkyd resin in a one – step synthesis. On the other hand, monoglyceride process involves the modification of the oils with polyols by transesterification, followed by polycondensation with polybasic acid.However, there are intermediate reactions leading to alkyd formation, which should be considered in order to understand the mechanism of alkyd resin synthesis. To the alkyd chemist, the reaction of practical significance is that of ester formation with the liberation of water[9] Goldsmith[12] and Nagata[13] stated that, alkyd resins are formed because of several independent reactions, which are probably occurring side by side. These reactions are:• esterification reactions between polybasic acid and hydroxyl groups of monoglyceride forming half-esters. This is depicted in “Equations 1 and 2” using phthalic anhydride as the polybasic acid.It is well known for glycerol that the β-hydroxyl group is less reactive than α-hydroxyl group. This has been shown with fatty acids, which forms unstable β-glycerides, which are easily converted into α-glycerides as long as α-hydroxyls are available[13] The same is generally assumed for polybasic acid like phthalic anhydride. This is the most rapid reaction and occurs at relatively low temperatures usually between 130℃ and 150℃. This reaction is complete by the time the maximum reaction temperature of above 200℃ is reached.• esterification reactions of the hydroxyls of monoglyceride and polyol with the carboxyls of fatty acid, polybasic acid half – ester, or polybasic acid (“Equations 3 and 4”).Kinetics of such a reaction is difficult to follow due to innumerable side reactions. Igwe and Ogbobe[9] and Aigbodion and Okieimen[14] stated that one of the reasons for the apparent failure in applying the theory of polyesterification in kinetic studies of alkyd synthesis is due to complications resulting from the innumerable side reactions.This research is aimed at using end-group analysis, amount of water of esterification and pH to explain and compare rates of polyesterification and the beginning of cross-linking (time of gelation) during preparation of cottonseed and melon seed oils biopolymers.
2. Experimental
2.1. Materials
Triglyceride oils used for biopolymers preparation were locally sourced. MESO was obtained from melon seeds purchased at Akpan Andem market, Uyo. Melon seeds were dried; ground and the oil Soxhlet extracted with petroleum ether as the solvent following the method describe elsewhere[12]. COSO was purchased at Sabongari market, Kano. The oils were stored in a refrigerator prior to use. Technical grade phthalic anhydride, glycerol, xylene from BDH were obtained from commercial sources and used without further purification, in the preparation of the alkyds.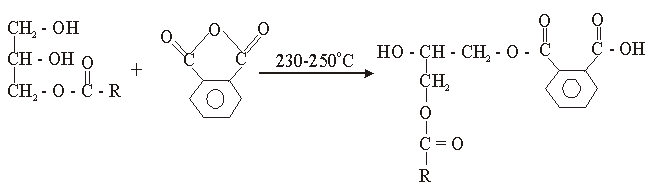 | (1) |
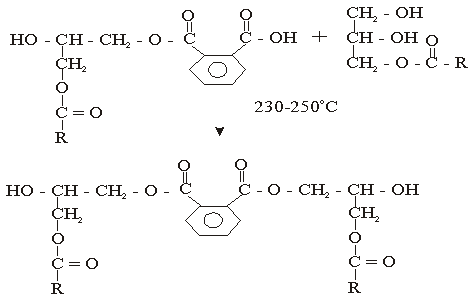 | (2) |
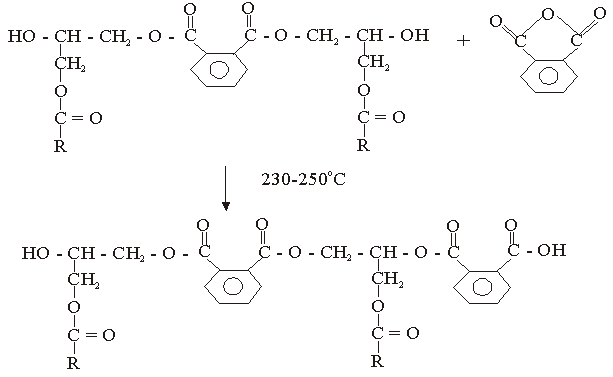 | (3) |
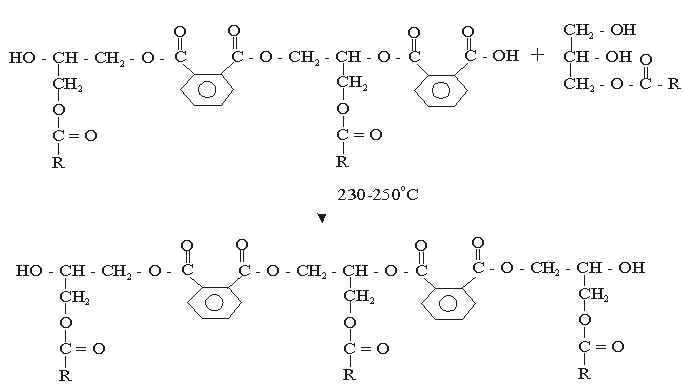 | (4) |
2.2. Methods
2.2.1. Preparation of Biopolymers
Six grades of biopolymers formulated to have oil content of 40% (A), 50% (B), and 60% (C) melon seed oil and 40% (D), 50% (E), and 60% (F) cottonseed oil respectively which were prepared with phthalic anhydride, glycerol and xylene in the previous study[1] were used in this experiment. In each preparation, the monoglyceride was first prepared by reacting the glycerol with COSO and MESO respectively. The monoglyceride was cooled down to about 180℃ and then a calculated amount of phthalic anhydride was added. This time of adding the polybasic acid was taken as the beginning of the reaction. The temperature was quickly raised to about 230℃ and maintained between a range of 230 and 250℃ throughout the duration of the reaction. Aliquots of the reaction mixture were withdrawn at 20 min intervals and the acid value determined by titrimetric method[4], the pH of the mixture was determined using a pH meter model pH-016. The volume of water of esterification evolved was measured at the same time.
2.2.2. Theory of End-group Analysis, Extent of Conversion (Pn) and Average Degree of Polymerization ( ) of Biopolymers
However, the rate of a step polymerization is conveniently expressed in terms of the concentrations of the reacting functional groups[15]. Thus, the polyesterification can be experimentally followed by titrating for the unreacted carboxyl groups with a base, i.e., monitoring the acid value. Considering a simple esterification reaction below (“Equation 5”), the rate of polymerization, R, can then be expressed as the rate of disappearance of carboxyl groups, – d[COOH]/dt (“Equation 6”).  | (5) |
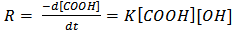 | (6) |
For most polymerizations the concentrations of the two functional groups are very nearly stoichiometric[15 and 16], and “Equation 6” can be written as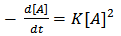 | (7) |
 | (8) |
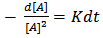
where [A] is the concentration of – OH groups or –COOH groups. However, “Equations 6 and 7” show that synthesis of biopolymers follows second – order reaction, with K as the second order rate constant. By integrating “Equation 8”, we have a second order rate constant.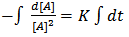 | (9) |
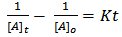 | (10) |
where [A]o is the initial concentration at t = 0 and[A]t is the concentration after time, t, of hydroxyl or carboxyl groups respectively. It is convenient at this point to express “Equation 10” in terms of the extent or fraction of reaction (Pn) defined as the fraction of the hydroxyl or carboxyl functional groups that have reacted at time t[15 and 16]. However, “Equation 11” gives Pn, which is also referred to as the extent or fraction of conversion.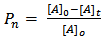 | (11) |
This implies | (12) |
Substituting for[A]t in “Equation 10” and rearrangement, we have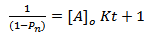 | (13) |
Hence, “Equation 13” is a second – order rate equation with K as second order rate constant. Hence, “Equation 13” indicates that a plot of  versus t should be linear. This behaviour has been generally observed in polyesterification [15]. Several authors have plotted this graph during kinetic studies of rubber seed, coconut, soybean, castor and palm kernel oils alkyds preparation[4, 6, 9, 10, 14 and 17] and observed deviations from linearity (second order) either at the early stage of the reactions or towards the end of the reactions.The deviation from second order kinetics of polyesterification reaction was attributed to occurrence of chain branching at relatively short intervals along the polymer chain[4 and 14]. In addition, Onukwli and Igbokwe [6] attributed this to the periods of reaction of the primary – OH and the secondary – OH leading to the formation of linear and three-dimensional molecules respectively.Odian[15] and Fried[16] define (
 ) as the average number of structural units per polymer chain.
 | (14) |
This “Equation 14” relating the degree of polymerization to the extent of reaction was originally set forth by Carothers and is often referred to as Carothers equation[15]. The extent of the reaction (Pn) and number-average degree of polymerization ( ) were calculated from the end- group analysis of aliquots of the reaction mixture withdrawn at various intervals of time using the relationships in “Equations 11 and 14” respectively. The values of Pn and
  for both MESO and COSO biopolymer samples, as well as acid values, pH and water of esterification obtained were plotted with reaction time. Also, rates of polymerization of biopolymers were calculated using “Equation 13” (end-group analysis) and based on the amount of water of polycondensation evolved at each stage of reaction.
3. Results and Discussion
3.1. Kinetic Studies of the Preparation of MESO and COSO Biopolymers Based on Water of Esterfication
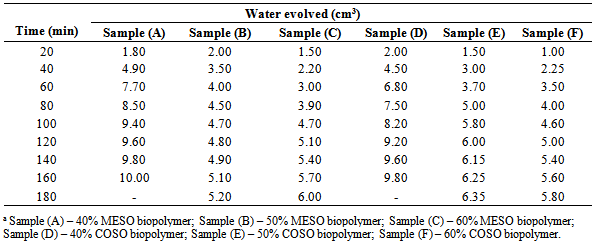
Few authors[9 and 14] have reported the use of variations in the volume of water of esterification evolved with time to study the rate of polycondensation. Table 1 and Figure 1 respectively show the variation and rate curve of the volume of water evolved with reaction time during MESO and COSO biopolymer preparation. It can be seen that at the early stages of reaction, the volume of water evolved was high, and then decreased at longer periods of reaction. This observation may be because of high initial esterification reaction, which could lead to depletion in the available functional groups reacting. Aigbodion and Okieimen[14] made similar observation during the kinetics of the preparation of rubber seed oil alkyds resin. The variations in the volume of water of esterification evolved during the polyesterification reaction can also be attributed to limitation in inter-contact between the reacting functional groups due to increased viscosity (of the reaction medium) as the reaction progressed. Table 1. Water evolved at various stages of reaction during MESO and COSO biopolymers synthesis
 |
| |
|
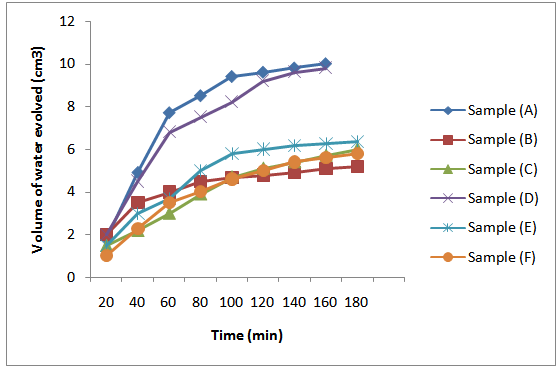 | Figure 1. Rate curves based on volume of water of esterification evolved during MESO and COSO biopolymers synthesis |
It is expected that the theoretical (calculated) water of esterification should be greater than that evolved during the polycondensation reaction; this is because polycondensation hardly gets to completion before termination. However, as observed in Figure 2, the amount (grams) of water evolved in samples (A), and (D) are higher than those of samples (B), (C), and (E), (F) respectively. It is also observed that the amounts of water evolved in the former samples were greater than the theoretical water of esterification. On the other hand, the theoretical water for samples (B), (C), (E) and (F) was greater than the water evolved. This may be because of increased rate of agitation of the reaction mixture and increase in the volume of xylene added to the reaction mixture, since the short oil biopolymers (samples (A) and (D)) tend to form gel at longer reaction periods. Aigbodion and Okieimen[14] attributed increased volume of water evolved during polyesterification reaction to factors such as rate of agitation of reaction mixture, and the contribution by glycerol and xylene. It is also evident from Figure 2 that the amounts of water evolved for both MESO and COSO biopolymer samples decreased with increase in oil length. This may be because glycerol and polybasic acid content decreased with increase in oil length.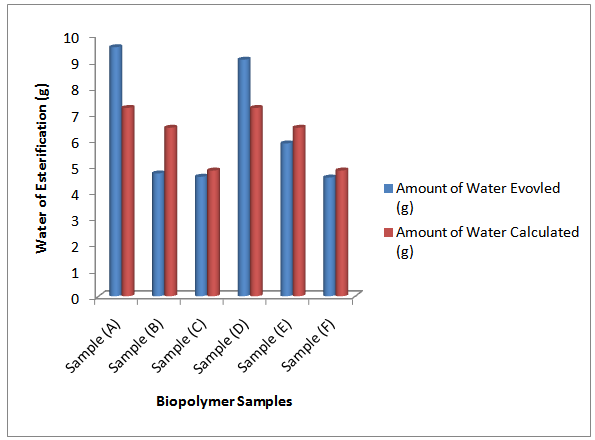 | Figure 2. Chart of water of esterification of melon seed and cottonseed oils biopolymers |
3.2. Rate of Polymerization Reaction Based on the Volume of Water Evolved
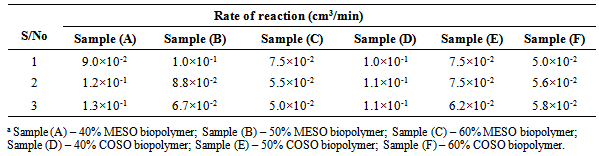
The rates of water evolution calculated from the linear portions of the plots in Figure 1 are given in Table 2. The following order in reaction rates based on evolution of water of esterification was observed for the synthesis of short oil [sample (A)], medium oil [sample (B)] and long oil [sample (C)] biopolymers of MESO: long oil < medium oil < short oil biopolymers. The rate of water evolution for sample (A) was in the order of 10-1 cm3/min. On the other hand, the rates of evolution of water of esterification for samples (B) – (C) were in the order of 10-2 cm3/min. This implies that the rate of water evolution was fastest in sample (A) compared to samples (B) – (C). This could be attributed to increase content of pthalic anhydride in sample (A) compared to samples (B) and (C) to react with hydroxyl groups of the glycerol and melon seed oil. Also observed in Table 2 is the decreased in the rate of evolution of water of esterification during synthesis of COSO biopolymers from long oil[sample (F)], medium oil[sample (E)] and short oil[sample (D)] biopolymers. That is, the rate of reactions follows the following order: Sample (F)  sample (E)
  sample (D) and increases as the oil length decreased. This observation collaborates with that of MESO biopolymers. The rate of water evolution for sample (D) was in the order of 10-1 cm3/min, while those of samples (E) and (F) were in the order of 10-2 cm3/min as in the MESO samples counterparts.
Table 2. Rate of reactions during the synthesis of MESO and COSO biopolymers (water evolution rate)
 |
| |
|
3.3. Variation of pH and Acid Values with Time during MESO and COSO Biopolymers Synthesis
Many authors have reported the use of variations in acid values of alkyd resins with time to study the kinetics of alkyd resin synthesis[4, 6, 9, 10, 14 and 17]. The pH is another parameter that has not been explored and exploited. In this research, the pH of the aliquots of the alkyd samples, in a 0.1M ethanolic KOH solution were determined at 20 min intervals. The successful use of pH values in the kinetic studies of MESO and COSO biopolymers synthesis, which is more reliable than the used of acid value, since the determination of pH values is by instrumental method has been one of the major contributions of this research in the area of surface coating research. It is observed that the pH of MESO and COSO biopolymers increases rapidly at the early stages of reaction as the acid value also decreased in like manner (Figures 3 and 4). This was followed with a period of a more gradual increase in pH as the acid value also decreased gradually. This variation may be due to decrease in concentration of H+ as the primary and secondary hydroxyl of glycerol reacts with phthalic anhydride, melon seed oil and cottonseed oil respectively. Mechanism of alkyd resin synthesis reveals intermediate reactions leading to alkyd formation to include polyesterification reactions between polybasic acid and hydroxyl groups of polyhydric alcohol to form half – esters; esterification reactions of the hydroxyls of polyol with the carboxyls of fatty acid, polybasic acid half – ester or polybasic acid[12 and 13]. The two reactions above resulted in a decrease in the concentration of hydrogen ions of the reaction mixture, thereby increasing the pH. The initial increase in pH of the reaction mixture may be due to initial increase in rate of reaction as the temperature is gradually increased.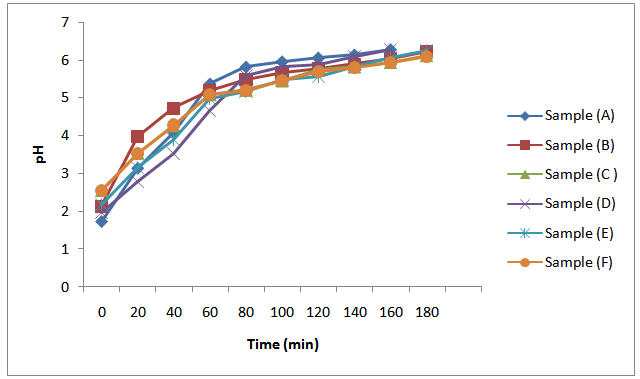 | Figure 3. Plot of pH against time during MESO and COSO biopolymers synthesis |
It is also observed in Figure 3 that pH at the early stages of reaction increases from samples (A) – (C) and samples (D) – (F) respectively as the oil length increases. This may be attributed to decrease in polybasic acid content as the oil length increases. Generally, as observed from Figure 3, pH of the aliquots of reaction mixtures increases as the acid value decreases.Also, the initial marked decrease in the acid value of the reaction mixture as observed in Figure 4 was followed with a period of a more gradual decrease in the acid value. It is also evident from the results in Figure 4 that the initial acid value decreases as the oil length of the samples increases. Ogunniyi and Odetoye[5] made similar observation during the preparation and evaluation of tobacco seed oil – modified alkyd resins. This observation can be rationalized based on the different reactivities of α- and β -OH groups of glycerol. Goldsmith[12] reported that α-OH groups of glycerol react much faster than do their β -OH counterparts. Thus, the initial rapid decrease in the acid value observed correspond to the time when α-OH groups reacted. A similar high rate of conversion during the early stages of the reaction between glycerol and phthalic anhydride has been reported[3, 6 and 9].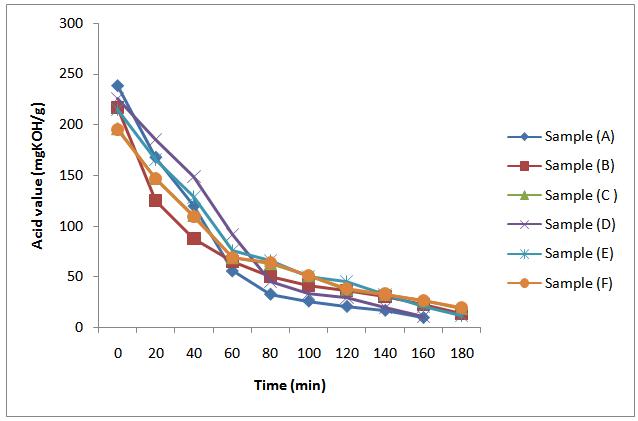 | Figure 4. Plot of acid value (mgKOH/g) against time during MESO and COSO biopolymers synthesis |
The initial marked decrease in acid value of the samples at early stages of reaction can also be explained based on the temperature of the reaction. For instance[12], and[14] suggested that at a temperature of about 160℃ primary hydroxyls of glycerol react rapidly with phthalic anhydride, while secondary hydroxyl react at temperatures above 230℃. Thus, the initial marked decreased in acid value found for all the samples may be assumed to be because of increase in the rate of esterification accompanying the rapid increase of temperature to 230℃. An increase rate of esterification reaction at temperatures above 200℃ has been reported[13].Summarily, the acid values of the in – process samples of both MESO and COSO alkyds decreases with time; the initial acid values decreases as oil length increases; the acid value decreases as the pH increases and pH increases with time.
3.4. Extent of Reaction of Polybasic Acids (Pn) and Number– average Degree of Polymerization ( ) of MESO and COSO Biopolymer Samples
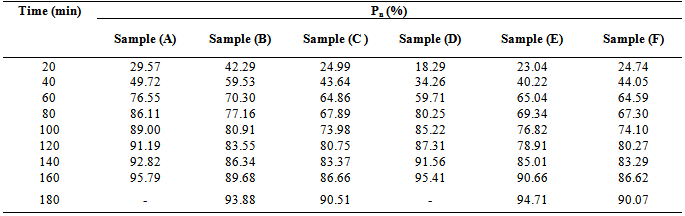
Table 3 and Figure 5 respectively show the result of Pn,  and plots of degree of polymerization versus time for MESO and COSO alkyds resins. However, in polyesterification reactions it is generally assumed that the reactivity of the functional group does not depend on the size of molecule to which it is attached[14]. It is observed from the result that Pn and
  for MESO and COSO biopolymers increases in a stepwise manner with reaction time. This implies, polyesterification reaction of triglyceride oils with polybasic acids is a stepwise reaction.
Table 3. Extent of reaction (Pn) of phthalic anhydride during MESO and COSO biopolymer synthesis
 |
| |
|
 | Figure 5. Plot of average degree of polymerization (Xn) of MESO and COSO biopolymers with time |
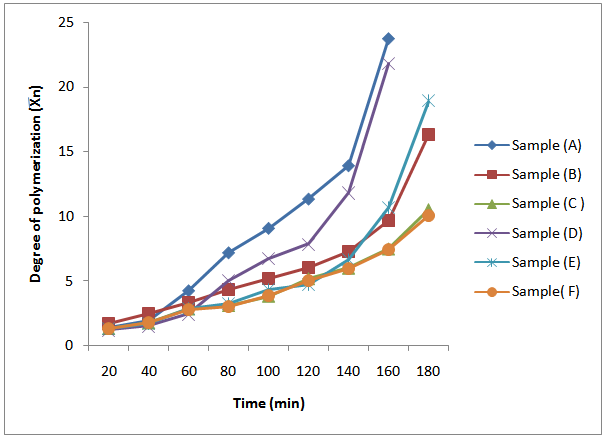
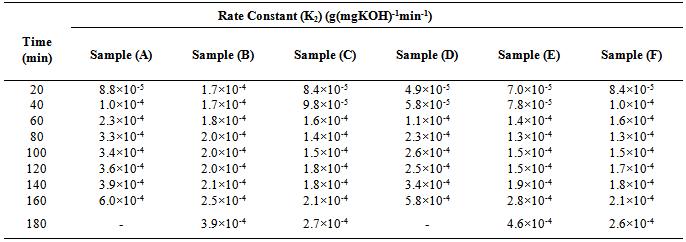
For polycondensation reactions, it was proposed that plots of  against time should be linear throughout the reaction[18]. This is also confirmed from “Equation 13”. However, in Figure 5, which show the plots of the degree of polymerization of MESO and COSO biopolymers, two distinct portions, are obvious. The first portion is the initial linear portions, which corresponds to a period when the primary hydroxyl groups of glycerol reacted and the second curved portion, which corresponds to the period when the secondary hydroxyl groups of glycerol reacted. This region of deviation from linearity in these plots is considered to mark changes in the physical characteristics of the reaction medium, most probably the period marking the beginning of the formation of relatively large molecular species and the cross – linking of the alkyd chains. It can be seen that the initial portions of these plots for sample (B) are linear up to 60 min of reaction corresponding to 70.30% conversion (Table 3). The value of second-order rate constant, K2, calculated from this linear portion of Figure 5 is given as 1.7×10⁻⁴ g(mgKOH)-1min-1 (Table 4). There was a slight deviation from this linearity after 60 min and the linearity was re-established with a new second order rate constant of 2.0×10⁻⁴ g (mgKOH)-1min-1 (Table 4) up to 120 min corresponding to 83.55% conversion (Table 4). Thereafter deviation from linearity was observed again. Samples (C) and (E) show similar trend of linearity at the beginning of polyesterification reaction. The values of Pn for these samples at the point of deviations were 64.86% at 60 min and 86.66% at 160 min for sample (C) (Table 3). That of sample (E) was 65.04% at 60 min and 78.91% at 120 min. The values of second – order rate constant, K2, calculated from the linear portions for samples (C) and (E) are 1.8×10⁻⁴ g(mgKOH)-1min-1 and 1.5×10⁻⁴ g(mgKOH)-1min-1 respectively (Table 4). Many authors[2, 6, 9 and 14] have reported similar observations for alkyds prepared from other oils.
Table 4. Second order rate constant K2 at various time intervals during cottonseed oil alkyd synthesis
 |
| |
|
For samples (A) and (D), the plots in Figure 5 did not show linearity at the early stage of reaction up to 80 min of reaction. That of sample (F) started at 60 min of reaction. Pn at the points of deviations were 86.11% at 80 min and 91.19% at 120 min for sample (A), and 80.25% at 80 min and 87.31% at 120 min for sample (D) (Table 3). That of sample (F) was 64.59% at 60 min and 80.27% at 120 min. The second – order rate constant, K2 calculated at the linear portions of Figure 5 for samples (A) and (D) were 3.4×10⁻⁴ g(mgKOH)-1 min-1 and 2.5×10⁻⁴ g(mgKOH)-1min-1 respectively (Table 4). That of sample (F) was 1.7×10⁻⁴ g(mgKOH)-1min-1.It is well known that the rate constant in esterification reactions is dependent on the proportion of the reactants, speed of agitation of the reaction mixture, changes in temperature and removal of water of esterification.[14] For a second order reaction, K2 will also depend on the initial concentration of the reactants (acid value). The initial acid values of samples (A) and (D) are about the same magnitude, but the rate of decrease in acid value is fastest for sample (A) followed by sample (D) hence their relatively larger K2 values. It is also observed that sample (A) and sample (D) in that order, attained the highest degree of polymerization at the shortest time compared to samples (B), (C), (E), and (F).It is obvious from the above results that the initial reaction rates in the preparation of MESO and COSO biopolymers follow second order kinetics with rate constants of the order 10-4 g (mgKOH)-1min-1. The degree of polymerization calculated in the regions of deviation from second order kinetics tends to suggest branching of the biopolymer chains at relatively short intervals.
4. Conclusions
The results from this research revealed that the initial reaction rates in the preparation of both melon seed and cottonseed oils biopolymers follow second order kinetics with rate constants of the order 10-4 g(mgKOH)-1min-1.The average degree of polymerization calculated in the regions of deviation from second order kinetics tends to suggest branching of the biopolymer chains at relatively short intervals. The pH of aliquots of the reaction mixture of both melon seed oil and cottonseed oil based biopolymers determined at 20 min intervals increases as the acid value decreased.The amounts of water of erification evolved for short oil biopolymers of both melon seed and cottonseed oils were greater than that of medium and long oil biopolymers. Also, the amounts of water evolved in the short oil biopolymers were greater than the theoretical water of esterification. On the other hand, theoretical water of esterification for medium and long oil biopolymers were greater than water of esterification evolved. Based on water evolution and end-group analysis, short oil biopolymers of both melon seed and cottonseed oils attained the highest degree of polymerization at the shortest time compared to medium and long oil biopolymers.
References
| [1] | Isaac, I. O and Ekpa, O. D., 2013, Fatty acid composition of cottonseed oil and its application in production and evaluation of biopolymers. American Journal of Polymer Science, 3(2), 13-22. |
| [2] | Ekpa, O. D. and Isaac, I. O., 2013, Fatty acid composition of melon (Colocynthis vulgaris Shrad) seed oil and its application in synthesis and evaluation of alkyd resins. IOSR Journal of Applied Chemistry, 4(4), 30- 41. |
| [3] | Issam, A. M and Cheun, C. Y., 2009, A study of the effect of palm oil on the properties of a new alkyd resin. Malaysian Polymer Journal, 4(1), 42 – 49. |
| [4] | Ekpa, O. D. and Isaac, I. O., 2009, Kinetic studies on polyesterification of unsaturated oils and diacids in the alcoholysis process. Research Journal of Applied Science, 4 (4), 125-128. |
| [5] | Ogunniyi, D. S. and Odetoye, T. E., 2008, Preparation and evaluation of tobacco seed oil-modified alkyd resins. Bioresource Technology, 99, 1300-1304. |
| [6] | Onukwli, O. D. and Igbokwe, P. K., 2008, Production and characterization of castor oil-modified alkyd resins. Journal of Engineering and Applied Science, 3 (2), 161-165. |
| [7] | Mukhtar, A., Habib, U and Mukhtar, H., 2007, Fatty acid composition of tobacco seed oil and synthesis of alkyd resin. Chinese Journal of Chemistry, 25, 705-708. |
| [8] | Ikhuoria, E. U., Aigbodion, A. I. and Okieimen, F. E., 2004, Enhancing the quality of alkyd resins using methyl esters of rubber seed oil. Tropical Journal of Pharmaceutical Research, 3 (1), 311-317. |
| [9] | Igwe, I. O. and Ogbobe, O., 2001, A study of the kinetics of alkyd resin formation. Journal of Chemical Society of Nigeria, 26(1), 75- 80. |
| [10] | Okieimen, F. E. and Aigbodion, A. I., 1997, Studies in molecular weight determination of rubber seed oil alkyd resins. Industrial Crops and Products, 6, 155-161. |
| [11] | Ekpa, O. D. and Isaac, I. O., 2008, The use of metallic soaps from cottonseed oil and soybean oil-based alkyd resins in paint production. New Era Research Journal of Engineering, Science and Technology, 1 (3 & 4), 1-14. |
| [12] | Goldsmith, H. A., 1948, Alpha and beta hydroxyls of glycerol in preparation of alkyd resins. Industrial & Engineering Chemistry. 40, 1205-1211. |
| [13] | Nagata, T., 1969, Cooking schedule of alkyd resin preparation. part II. Effect of cooking schedule on molecular weight distribution of alkyd resin. Journal of Applied Polymer Science. 13, 2601 – 2619. |
| [14] | Aigbodion, A. I and Okieimen, F. E., 1996, Kinetics of the preparation of rubber seed oil alkyds. European Polymer Journal, 32(9), 1105- 1108. |
| [15] | Odian, G., 2004, Principles of polymerization. 4th edition. John Wiley & Sons. Inc., Hoboken, New Jersey. |
| [16] | Fried, J. R., 2003, Polymer science and technology. 2nd edition. Pearson Education, Inc. |
| [17] | Aigbodion, A. I. and Pillai, C. K., 2001, Synthesis and molecular weight characterization of rubber seed oil-modified alkyd resins. Journal of Applied Polymer Science, 79, 2431-2438. |
| [18] | Flory, P. J., 1941, Molecular size distribution 3-dimensional polymers I: gelation. Journal American Chemical Society. 63, 3083-3090. |
 Abstract
 Reference
 Full-Text PDF
 Full-text HTML