-
Paper Information
- Previous Paper
- Paper Submission
-
Journal Information
- About This Journal
- Editorial Board
- Current Issue
- Archive
- Author Guidelines
- Contact Us
American Journal of Polymer Science
p-ISSN: 2163-1344 e-ISSN: 2163-1352
2013; 3(3): 56-62
doi:10.5923/j.ajps.20130303.04
Structural and Electrical Properties of Pure and NiCl2 Doped PVA Polymer Electrolytes
 Abstract
 Reference
 Full-Text PDF
 Full-text HTML
S. Bhavani1, Y. Pavani1, M. Ravi1, K. Kiran Kumar1, 2, V. V. R. Narasimha Rao1
1Sri Venkateswara University, Department of Physics, Tirupati, A.P, India
2GITAM University, Dept. of Engineering Physics, GIT, Visakhapatnam, 530 045, A.P, India
Correspondence to: S. Bhavani, Sri Venkateswara University, Department of Physics, Tirupati, A.P, India.
| Email: |  |
Copyright © 2012 Scientific & Academic Publishing. All Rights Reserved.
Polymer electrolytes of pure polyvinyl alcohol (PVA) and PVA complexed with nickel chloride of different concentrations were prepared by solution cast technique. Structural investigations were carried out by X-ray diffraction (XRD), Fourier transform infrared (FTIR) studies and differential scanning calorimetry (DSC) was used to determine the glass transition and melting temperatures. Electrical properties were studied; using complex impedance spectroscopy. Electrical conductivity was measured in the temperature range 303 K – 373 K and in the frequency range 1Hz - 1MHz, using Cole-Cole plots. The temperature dependence of electrical conductivity followed Arrhenius relation. The variation of total conductivity with frequency showed Jonscher’s power law behavior. The charged species responsible for electric transport in this polymer electrolyte system was estimated from the transference number data using Wagner’s polarization technique.
Keywords: XRD, FTIR, DSC, Ionic Conductivity, Transference Number
Cite this paper: S. Bhavani, Y. Pavani, M. Ravi, K. Kiran Kumar, V. V. R. Narasimha Rao, Structural and Electrical Properties of Pure and NiCl2 Doped PVA Polymer Electrolytes, American Journal of Polymer Science, Vol. 3 No. 3, 2013, pp. 56-62. doi: 10.5923/j.ajps.20130303.04.
Article Outline
1. Introduction
- The principal motivation behind the study of solid polymer electrolytes is that these materials are found as promising materials for potential applications in advanced electrochromic display devices, super capacitors, fuel cells, gas sensors, solid state batteries etc, due to their excellent ionic conductivity, leak proof, good contact with electrodes and thermal stability when compared to liquid electrolytes. The efforts of research and development are mainly focused on the electrical conduction mechanism to understand the nature of charge transport prevalent in these materials and to improve electrical conductivity, ionic transport number and electrode–electrolyte interfacial reactions at ambient temperatures[1-5]. Polymer electrolytes formed by incorporating metal salts into a highly polar polymer matrix to make it ionically conductive are called polymer salt complexes. During the last few decades, the utilization of polymer salt complexes in various applications has led to intensive interest in these materials[6-8]. Polymer electrolytes complexed with monovalent metal ions were reported extensively. It is also possible to enhance the conductivity with bivalent metal ions such as zinc, cadmium, lead, cobalt, nickel, manganese and mercury. Polymeric systems based on bivalent metal salts are less reactive than the systems based on lithium salts, and hence they are more advantageous for non-battery devices also[9].In the present work polyvinyl alcohol (PVA) was selected as host polymer as it is relatively cheaper and is one of the most important polymeric materials which has many applications in industry due to its unique chemical and physical properties. The hydrogen bond between hydroxyl groups plays an important role in determining its properties like high water solubility, wide range of crystallinity and high crystal modulus[10]. Due to its high tensile strength and good abrasion resistance, PVA is used in double-layer capacitors and electrochemical windows etc[11]. The present work aimed to enhance electrical conductivity by doping NiCl2 into PVA host matrix. NiCl2 was taken as a dopant for a variety of reasons like its low cost, thermal stability and good electrical properties. In this paper an effort has been made to study the effect of addition of nickel chloride to PVA and study its structural and electrical properties. The results obtained from these measurements are analyzed and reported.
2. Experimental
2.1. Sample Preparation
- Films (thickness ~150 µm) of pure PVA and various compositions of complexed films of PVA with NiCl2 salt were prepared in the weight percent ratios (90:10), (80:20) and (70:30) by solution cast technique using double distilled water as a solvent. The solution was vigorously stirred for 10 to 12 h to get a homogeneous mixture and was cast onto poly propylene dishes and allowed to evaporate at room temperature to remove all traces of solvent. The dried polymer electrolyte films were carefully removed from the propylene dishes and stored inside a dry vacuum box.
2.2. Analytical Techniques
- In the present study, X-ray diffraction spectra were recorded at room temperature in the range 10 o-70o Bragg angle by a SEIFERT X-ray diffractrometer. CuKα radiation was used along with Zr filter for better monochromatic radiation. Infrared spectra of polymer electrolyte films were recorded using EO-SXB IR spectrometer with a resolution of 4 cm-1 in the range 400 - 4000 cm-1. Differential scanning calorimetry (DSC) thermograms were recorded in the temperature range 303 K - 483 K using an SDT Q600 thermal analyzer at a heating rate of 10oC per minute under nitrogen atmosphere. The impedance measurements were carried by a computer controlled phase sensitive multimeter (PSM 1700) in the frequency range 1Hz-1MHz and temperature range 303 K - 373 K. The temperature was measured by copper-constantan thermocouple. The transference numbers, both ionic (tion) and electronic (tele) for various complexed films were evaluated using Wagner’s polarization technique.
3. Results and Discussion
3.1. XRD Analysis
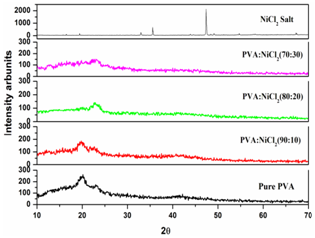 | Figure 1. XRD patterns of pure PVA and NiCl2 doped PVA polymer electrolytes |
3.2. FTIR
- FTIR spectroscopy is one of the important investigation techniques of polymer structure that provides information about the structural components and interactions among various constituents of the polymeric films. Different types of bonds possess different natural frequencies. A molecule of particular type of bonding will interact with electromagnetic radiation if it has asymmetric charge distribution. Electromagnetic radiation of the correct (IR) frequency can produce a stretching of the bond between these atoms as the negative charged atom moves in a direction opposite to that of positively charged atom. This type of stretching results in a vibration of molecule and as a consequence, an oscillating electric field is established and this field is capable of interacting with the electric field associated with the radiation. If the frequency of the radiation matches with the natural vibrational frequency of the molecule, a net transfer of energy takes place, it undergoes a quantum jump in its vibrational (or rotational) energy and it results in a change in the amplitude of the molecular vibration. Consequently there will be absorption of radiation, giving rise to an absorption band (peak). Similarly, rotation or twisting or bending of asymmetric molecule around their centers of mass is possible. Hence the identification of an absorption peak at a particular frequency of the infrared region will reveal the nature of bonding[16]. FTIR spectra for pure PVA, NiCl2 complexed PVA and NiCl2 are shown in Fig 2. The absorption band in the region 3527-3063 cm-1 corresponds to O-H (inter molecular hydrogen bond) stretching of PVA shifted to 3649-3090 cm-1, 3628-3055 cm-1 and 3625-3033 cm-1 in 10 wt%, 20 wt%, and 30 wt% NiCl2 complexed PVA films respectively. The displacement of O-H band towards the lower wave numbers indicates that the positively charged nickel ions are coordinated through ionic bonds with the negatively charged hydroxyl groups belonging to different chains in PVA[17]. The broadening in the hydroxyl band in all the complexes confirms that the increase in the concentration of Ni reduces the intermolecular interaction between chains and expands the space between them[18].In addition to this, C-H stretching of CH2 showed an absorption band at 2992 cm-1 in pure PVA and is shifted to 2987 cm-1, 2965 cm-1 and 2957 cm-1 as salt concentration increases. The C-H bending of CH2 in pure PVA exhibited an absorption band at 1481 cm-1 and is shifted to 1472 cm-1, 1470 cm-1, and 1462 cm-1 in the complexed films for different wt% of NiCl2 respectively. The shift in acetyle C–O stretching of PVA from 917 cm-1 to 935 cm-1, 912 cm-1 and 902 cm-1 also supports the interaction of salt with the host matrix. C-C stretching occurring at 1173 cm-1 in pure PVA is shifted to 1171 cm-1, 1148 cm-1 and 1146 cm-1 in 10 wt%, 20 wt%, and 30 wt% salt complexed polymer electrolyte films respectively. All these changes in the FTIR spectra are clear indications of the complexation of PVA with NiCl2 salt.
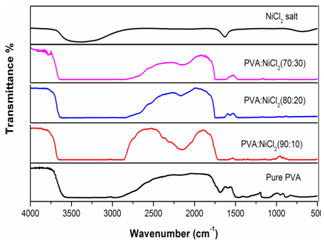 | Figure 2. FTIR patterns of pure PVA and NiCl2 doped PVA polymer electrolytes |
3.3. DSC
- Differential Scanning Calorimetry (DSC) is a technique to study the thermal transitions of a polymer. Using this technique the glass transition temperature
 melting temperature (Tm) and the degree of crystallinity (χc) of the material can be identified. Fig.3 shows the DSC curves of pure PVA and PVA: NiCl2 complexed films in the temperature range 300 - 550 K.
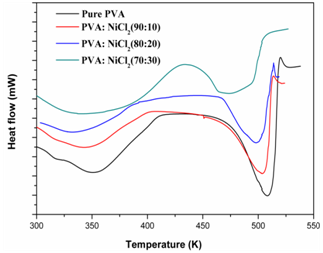 | Figure 3. DSC spectra of pure and NiCl2 doped PVA polymer electrolytes |
 ) of the polymer electrolytes.
  decreases with increase in salt concentration. The observed shift in
  values indicates the interaction between the polymer and the salt[21]. The low glass transition temperature leads the higher segmental motion of the polymer electrolyte[19]. Hence the ions move easily throughout the polymer chain. This enhances the ion transportation which leads higher ionic conductivity[20]. Another endothermic peak was observed around 498 K - 520 K corresponds to the melting point of the polymer electrolytes. Melting temperature is measured at apex of the endothermic peak and melting enthalpy is determined from the area of the peak. The relative percentage of crystallinity (%χc) was estimated using the equation[22].
 where
where  is the melting enthalpy of pure PVA and
  is melting enthalpy of NiCl2 complexed PVA. The measured values of glass transition temperature (
 ), melting temperature (
 ), and relative percentage of crystallinity (%χc) values are listed in Table 1.
|
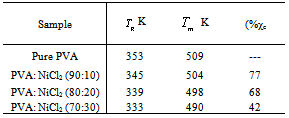
 values and relative crystallinity (χc) decrease with the increase of salt concentration. In addition, the melting endotherm is found to broaden with increase of salt concentration .The decrease in melting temperature and the broadening of the melting endotherm are clear indications of decrease in the degree of crystallinity and dominant presence of amorphous phase[23]. The glass transition temperature (
 ) and χc has been found to be low for 30wt% NiCl2 doped polymer electrolyte system. The lower values of
  and χc represents the high amorphous content of the complexed polymer electrolytes.
 3.4. Impedance Analysis
- Impedance spectroscopy was employed to establish the conduction mechanism. Sunandana et al[24] reported that the conductivity depends on the mobile ion concentration, the vibrational frequency of the mobile ions at equilibrium and the entropy of activation. Fig 4 shows the Cole-Cole plots of (PVA: NiCl2) (70:30) wt% polymer film at different temperatures. Complex impedance plots showed two well defined regions. A semi circle in the high frequency range related to the conduction process in the bulk of the complex and a linear region in low frequency range, which is attributed to the bulk effect of blocking electrodes. The bulk resistance for all samples was calculated from the interception of the semicircular arc on the real axis. Conductivities of the film at different temperatures were evaluated using the following formula
 where
where  is the thickness of the polymer electrolytes
 ,
,  , the area of the blocking electrodes
 and
and  is the bulk resistance of the polymer electrolytes. The bulk resistance
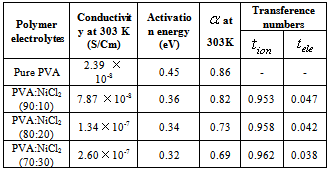
  decreases with increase in salt concentration. This may be due to the increase in the mobile charge carriers by the addition of NiCl2. The ionic conductivity increases with increasing NiCl2 content from 10 wt% to 30 wt%. Hopping mechanism between coordinating sites, local structural relaxations and segmental motions of the polymer chains are the essential to assure high conductivity of the electrolyte[25, 26]. The conductivity values of the polymer electrolytes at room temperature are given in Table 2.
3.5. Temperature Dependent Conductivity
- Electrical conductivity of pure and NiCl2 doped polymer electrolytes was measured at different temperatures for doped samples. The variation of electrical conductivity as a function of inverse temperature for pure PVA: NiCl2 (70:30) was inserted in Fig.4. The linear variation in
 vs
vs  plot suggests an Arrhenius type thermally activated process represented by the relation
 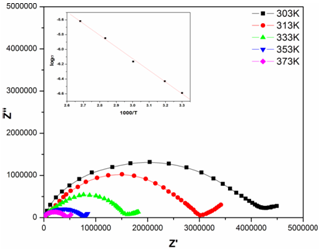 | Figure 4. Cole-Cole plots of PVA: NiCl2 (70:30) at different temperatures. Variation of conductivity with temperature is inserted inside the figure |
 where
where  is a pre exponential factor,
  , the activation energy,
  , the Boltzmann constant and
  , the absolute temperature. The conductivity increases with increasing temperature for all complexes. Druger et al[27] attributed the change in conductivity with temperature in solid polymer electrolytes to segmental motion, which results in an increase in free volume of the system. Thus, the segmental motion either permits the ions to hop from one site to another or provides a pathway for ions to move. In other words, the segmental movement of the polymer facilitates the translational ionic motion. From this, it is clear that the ionic motion is due to translation motion or hopping facilitated by the dynamic segmental motion of the polymer. As the amorphous region increases, the polymer chain acquires faster internal modes in which bond rotations produce segmental motion to favor inter and intra chain ion hopping, thus increasing the conductivity.The activation energy is a combination of the energy of defect formation and the energy of migration. The calculated values of activation energies for all polymer electrolyte films have been listed in Table 2. It was found that the highest conductivity was obtained for the polymer electrolyte with 30 wt% of NiCl2 which also had the lowest activation energy. Polymer electrolytes having low activation energies are desirable[28] for electrochemical applications.
3.6. Total Conductivity
- The variation of conductivity as a function of frequency at different temperatures for PVA: NiCl2 (80:20) is shown in Fig 5.
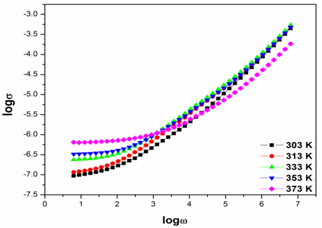 | Figure 5. Conduction spectra of PVA: NiCl2 (80:20) at different temperatures |
 , which represents the fact that the total frequency dependent conductivity, is the sum of
 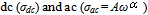 components. The typical dc conductivity at low frequency arises from the activated hopping of ions, and at higher frequencies, the ionic conductivity increases with the increasing frequency which may be attributed to the couple of forward and backward ion displacements occurring simultaneously thus facilitating the frequency dependence of ionic motion in accordance with Jonscher's universal power law behavior. In Jonscher's model some of the localised charge may jump over several consecutive sites leading to a d.c. conduction current and some over a shorter distance; hopping to the adjacent site becomes a limiting case.According to jump relaxation model reported by Funke[30], at very low frequencies, an ion can jump from one site to its neighboring vacant site successfully contributing to the dc conductivity. At higher frequencies, however the probability for the ion to go back again to its initial site increases due to the short time periods available. This high probability for the correlated forward-backward hopping at higher frequencies together with the relaxation of the dynamic cage potential are responsible for the high frequency conductivity dispersion. the power law exponent relates the backhop rate to the site relaxation time as
|
 is less than one, the backward hopping is slower than the site relaxation time, which results in translational motion of the Ni+2 ions. However, if the ratio exceeds one the backward hopping is faster than the site relaxation time. The values of
  as a function of salt concentration for the present polymer electrolytes are listed in table 2. From the table 2, it is seen that
  values were less than one and decreased with increase of salt concentration. The low values of
  may be due to the formation of free sites for Ni+2 ion transport[31].
3.7. Transference Numbers
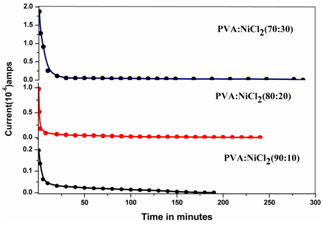 | Figure 6. Transference plots of PVA: NiCl2 polymer electrolyte films for different Compositions |
 ,
, ) were calculated using the equations
 where
where  is the initial current and
  is the final current. The polarization current versus time plots for different polymer electrolytes are shown in Fig 6. The resulting data is given in Table 2. From the table 2, the values of
  are in the range 0.953 - 0.962. This suggests that the charge transport in the investigated polymer electrolytes is predominately due to ions. The contribution of electrons to the current is negligible in all the samples. As suggested by the other workers[15, 33], the transference number (
 ) of the present polymer electrolyte films is close to unity and hence these electrolytes are suitable for solid-state electrochemical cells applications.
 4. Conclusions
- The complexation of NiCl2 salt with PVA was confirmed by XRD and FTIR studies. Thermal analysis indicates the glass transition temperature and crystallinity is low for PVA: NiCl2 (70:30) polymer electrolyte.The conductivity was found to increase with increasing temperature in all polymer films. The activation energy values showed a decreasing trend with increasing dopant concentration. The lowest activation energy value (0.32 eV) was obtained for 30 wt% of NiCl2.The ionic transport number data indicates that the conduction is predominantly due to ions rather than electrons.