Sherif M. A. S. Keshk1, 2, Abdullah G. Al-Sehemi1, 3
1King Khalid University, Faculty of Science, Chemistry Department, P.O. Box 9004, Abha 61413- Saudi Arabia
2Ain-Shams University, Institute of Environmental Studies and Research, Basic Science Department, Abbassia, Cairo 11566, Egypt
3Unite of Science and Technology, Faculty of Science, Chemistry Department, P.O. Box 9004, Abha 61413- Saudi Arabia
Correspondence to: Sherif M. A. S. Keshk, King Khalid University, Faculty of Science, Chemistry Department, P.O. Box 9004, Abha 61413- Saudi Arabia.
| Email: |  |
Copyright © 2012 Scientific & Academic Publishing. All Rights Reserved.
Abstract
An effective and convenient preparation of starch/mercerized cellulose composite was reported. The composite was obtained by mixing mercerized cellulose and corn starch. Different techniques such as FT-IR, X-ray diffractometer and differential scan colorimetric have been utilized for characterization of starch/mercerized cellulose composite. FT-IR results showed a C-O bond stretching band at 900 cm-1 for starch/cellulose composite (1:1, 2:1) more stronger than that observed in starch, owing to interaction between the amorphous starch and cellulose. However, X-ray confirmed the interaction between both mercerized cellulose and starch due to a possible enhancement in the close packing of the starch. Moreover, starch/mercerized cellulose composite (2:1) exhibited the lowest value of ΔCp. These results indicate that starch/cellulose prepared within 2:1 ratio has the lowest thermal expansion and the highest thermal stability.
Keywords:
Cellulose, Starch, Composite, X-ray Diffractogram, Thermal Stability
Cite this paper: Sherif M. A. S. Keshk, Abdullah G. Al-Sehemi, New Composite Based on Starch and Mercerized Cellulose, American Journal of Polymer Science, Vol. 3 No. 3, 2013, pp. 46-51. doi: 10.5923/j.ajps.20130303.02.
1. Introduction
Natural fiber reinforced plastics prepared using biodegradable polymer as matrix are the most environmental friendly materials. Such materials have the advantage of decomposition at the end of their life cycle. Unfortunately, the overall physical properties of those composites are far away from glass-fiber reinforced thermoplastics. Flax and soft-wood-Kraft-fiber are comparable in physical properties to glass-fiber, type E[1]. This can be explained by the differences in fiber structure owing to environmental growth conditions, area of growth, climate conditions and age ofplant. Further, the technical digestion and hydrophilicity nature of such fiber are other important factors thatdetermine the structure, as well as the characteristic values of fiber[2]. The hydrophilic nature of natural fibers influences the overall mechanical properties, as well as other physical properties of the fiber itself[3]. Starch, a hydrophilic renewable polymer, has been used as a filer for environmentally friendly plastics for about two decades[4]. Mixing starch with poly–L-lactic acid (PLA) is one of the most popular blends, because starch is an abundant and cheap biopolymer and PLA is biodegradable with good mechanical properties[5]. Starch with PLAcomposite prepared by compression molding had higher crystallinity index than that prepared by injection molding[4, 5]. However, the blend prepared by injection molding had higher tensile strength and lower water absorption values than those made by compression molding. Starch effectively increased the crystallization rate of PLA and it affected the melting point of PLA[4, 5]. On the other hand, Gelatinization of starch was found to lead to the destruction or diminution of hydrogen bonding in granules and a decrease in crystallinity of starch[6]. The presence of flax-fiber in starch increases the tensile strength and Young’s modulus[7]. Several studies and applications have demonstrated that cellulose fibers are a promising candidate as reinforcement in thermoplastic matrixes. Only few papers, however, are focused on polysaccharide-based composites[8-14]. The presence of commercial cellulose improves mechanical performance and thermal stability of starch[8,9]. All preparationreported of starch /cellulose composite were used a mixing solvents as sodium hydroxide/poly ethylene glycol or sodium hydroxide/urea and others used ethylene bis formamide as plasticizer[9,15 ,16].The present work describes the preparation and thermal characterization of starch/mercerized cellulosecomposite prepared in different ratios.
2. Materials and Methods
2.1. Extraction of Cellulose from Paper Waste
Cellulose was extracted from paper wasteby immersing inde-ionized water for 24 h. This was followed by swellingwith a givenconcentration of sodium hydroxide for 36 h at 80℃.
2.2. Starch Preparation
Corn starch was dispersed in a de-ionized water in a conical flask and stirred for 24 h at room temperature.
2.3. Composite Preparation
Mercerized cellulose andwet corn starch were immersed intohot de-ionized water. Then, the mixture was stirred for 24 h at 70℃. The composite was centrifuged and washed well till neutralization and finally dried under reduced pressure. The previous preparation procedure was repeated at different ratio of starch to mercerized cellulose (1:1, 2:1 and 3:1) at 70℃.
2.4. Fourier-transform Infra-red
FT-IR spectra of the prepared composites were measured with a Bruker FT-IR IFS 66 spectrophotometer, to investigate the chemical structure of the processed composites.
2.5. X-ray Diffractometry
Thick samples of starch/cellulose composite were prepared according to Kai &Keshk[17]. Diffractograms of the thick samples were recorded at room temperature with RIGAKU PRINT 2200V series using Ni-filtered  radiation
 The operating voltage and current were adjusted to 40 Kv and 30 mA, respectively. Crystallinity index (C.I.) was calculated from reflected intensity data using Segal et al. method[18], according to the eq. (1),
 | (1) |
where I020 is the maximum intensity of the lattice diffraction and Iam is the intensity at2θ=18°
2.6. Thermal Stability Measurements
The calorimetric measurements were carried out using Setaram calorimeter (DSC 131 Evo) with an accuracy of ± 0.1℃. Temperature and energy calibrations of the instrument were performed using the well-known melting temperatures and melting enthalpies of high purity indium and zinc supplied with the instrument. For non-isothermal experiments the prepared samples weighing about 10 mg were sealed in an aluminum pans and were tempered at 15 K/min in the range of 30 to 500℃. An empty aluminum pan was used as reference and in all cases a constant 60 ml/min flow of nitrogen in order to extract gases emitted from the reaction. Such gases are highly corrosive to the sensory equipment installed in the calorimeter furnace.
3. Results and Discussion
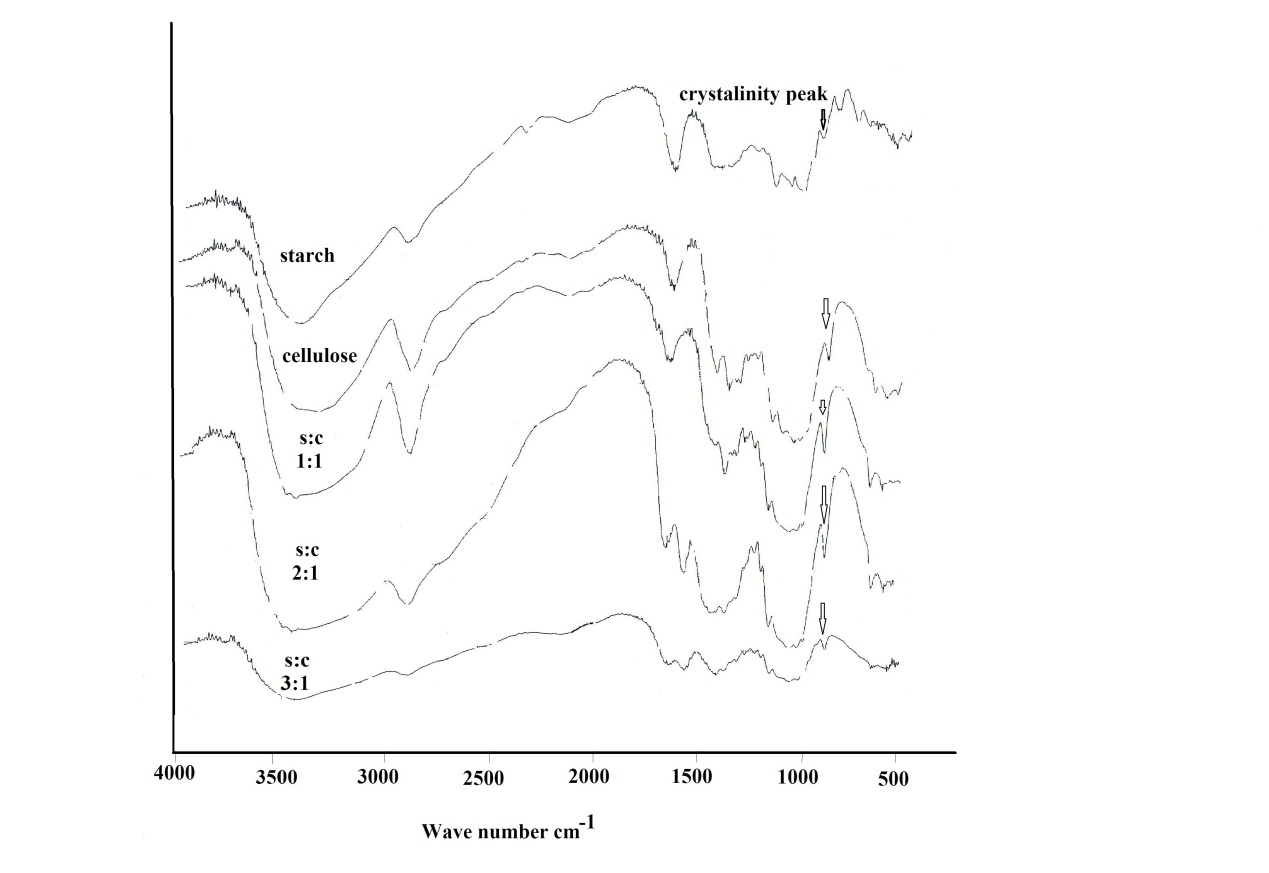 | Figure 1. FT-IR of (a) Starch(b) Cellulose(c) Starch /cellulose in 1:1 (e) Starch /cellulose in 2:1(f) Starch /cellulose in 3:1 |
FT-IR spectra of composite samples in different ratios of both starch and mercerized cellulose were recorded in the range from 4000 to 400 cm-1.The spectrum of cellulose (Fig.1) showed five characteristics bands between 980 and 1160 cm-1 corresponding to the C-O bond stretching band mainly attributed to primary alcohols[10]. The band at 1160 cm-1 is assigned to the C-O-C asymmetric stretching. Whereas, the bands at 1315 and 1430 cm-1 are attributed to CH2 wagging symmetric bending and CH2 asymmetric bending, respectively[19]. The spectra of all these composite samples (Fig.1) are mainly dominated by the cellulose bands. Moreover,each spectrum has two peaks at 1430 cm-1 and 900 cm-1 that were assigned to amorphous and crystalline regions of cellulose, respectively[20]. Whereas, the C-O bond stretching band at 900 cm-1 appeared more stronger for 1:1 and 2:1 ratio than that of starch and other ratio (3:1).This result could be explained by a physical interaction between starch and cellulose in aqueous sodium hydroxide.The X-ray patterns of cellulose, starch and their composite samples in different ratios are shown in Fig.2. The native starch diffraction peaks are related to its A-type crystalline structure, while the peaks observed for cellulose reflect its B-type structure[21-23]. The diffractive angle (2θ°) and d- spacing of the corresponding plane are depicted in Table (1).The composite processed at 1:1 ratio showed no change in a diffraction plane of (200) plane, while a diffraction plane of (11¯0) appeared at a lower angle side (2θ°=12.2) with a broader d-spacing plane (7.27) when compared with those of pure starch (14.8° and 5.97). Whereas, a diffraction plane of (110) appeared at the highest angle (2θ°=19.92) with narrow d-spacing plane (4.55) compared to those of pure starch (16.9° and 5.22) (Table 1).This could be attributed to a relatively great inclusion of cellulose in the (11¯0) and (110) planes of starch. The presence of cellulose could lead to expansion of the d-spacing of (11¯0) plane and contraction of the d-spacing of the (110) plane of starch. This behavior is accompanied by a shift to the greatest angle with decrease in the diffraction intensity. This data could be further explained by the increase of both intermolecular hydrogen bonding between the sheetsand the crystallinity index in starch/cellulose composite. The strong interaction between cellulose fiber and starch could be attributed to enhancing the close packing of starch molecules. Whereas, in case of the highest amount of cellulose, the diffraction intensity of (200) plan increased with the lowest angle shift owing to a little inclusion of cellulose in the (11¯0) and (110) planes of starch. Moreover, the steric effect of cellulose is higher than starch due to the affinity of cellulose toward the starch chaindecreases. Furthermore, X-ray patterns (Fig.2) of starch/cellulose composite samples (1:1 and 3:1 ratios) demonstrate two different diffraction peaks which are corresponding to diffraction peaks of cellulose I and II. Furthermore, the crystalinity index of all composite samples are higher than that in starch (Table 1).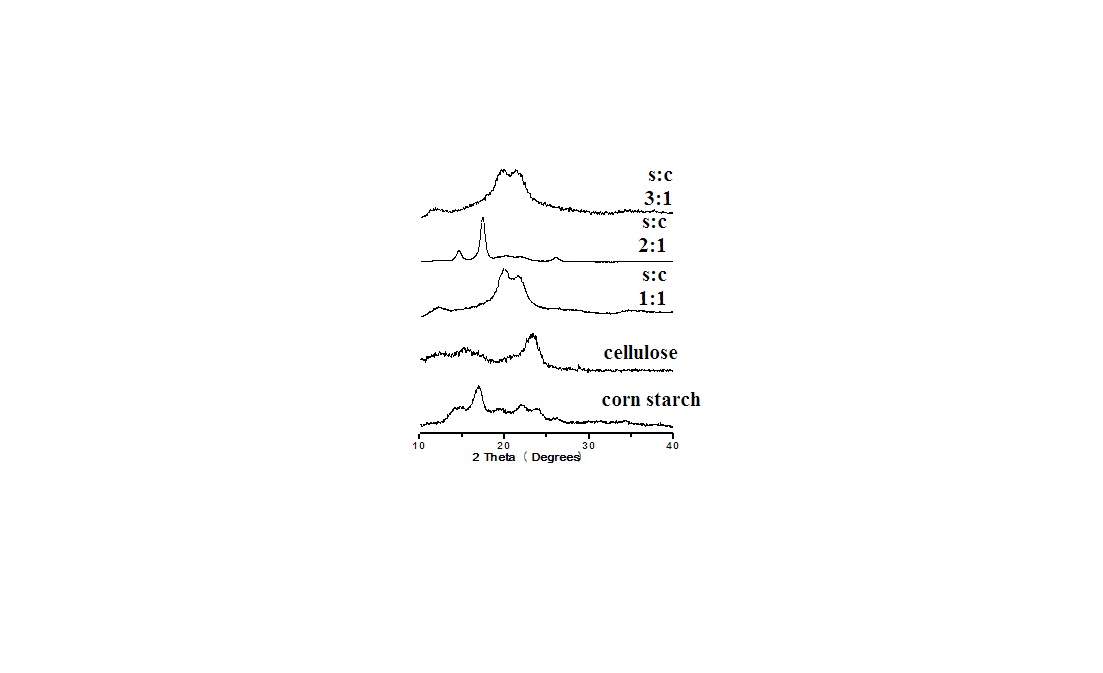 | Figure 2. X-ray diffractogram of starch , cellulose and their composite samples |
Table 1. Reflective angle, d-spacing and crystallinity index(C.I.) of the cellulose, corn starch and their composites
 |
| |
|
DSC patterns of the different composite samples are shown in Figs.(3-6). The characteristic temperatures such as the glass transition temperature, Tg, the onsetcrystallization temperature, Tc , and the crystallization temperature peak, Tp have been estimated in starch/cellulose composite (Figs 3-6). In the starch pattern (Fig.3), the Tc1 and Tc2 refer to first onset and second crystallization temperature, respectively. Moreover, Tp1 and Tp2 denote that the first and second peak of crystallization temperature in starch (Fig.3). In the present work, the derived values (ΔT= Tc- Tg) have been used as a rough estimate of the thermal stability of the prepared composite samples. However, it is favorable to have ΔT (thermal stability) values as large as possible. As shown in Figs.(3-6), our prepared composite samples exhibited ΔT values of 173.98, 130.98, 193.83 and 177.15 0C for starch and starch/cellulose composite ratio of 1:1, 2:1 and 3:1, respectively. Therefore, it may be concluded that, the starch/cellulose composite in 2:1 ratio has a good thermal stability compared to other ratios formulated due to the highest crystalinity index (Table 1). The heat capacity Cp at the lowest temperature which is the glass transition region, Tig, referred to the heat capacity of glassy state, Cpg, and that at the highest value of Teg region,Cpl referred to the heat capacity of liquid state. The difference in heat capacity (ΔCp= Cp1-Cpg) is the heat capacity change for the transition from glass to the liquid states (Figs. 3-6). The differences in heat capacity ΔCP are found to be32.886, 175.316, 3.084 and 11.151 μv for starch and starch/cellulose composite ratio within 1:1, 2:1, 3:1, respectively. Starch/cellulose prepared in 2:1 ratio has the smallest value of ΔCp compared with other prepared composite samples. This indicates that, starch/cellulose prepared in 2:1 ratio has the lowest thermal expansion and the highest thermal stability.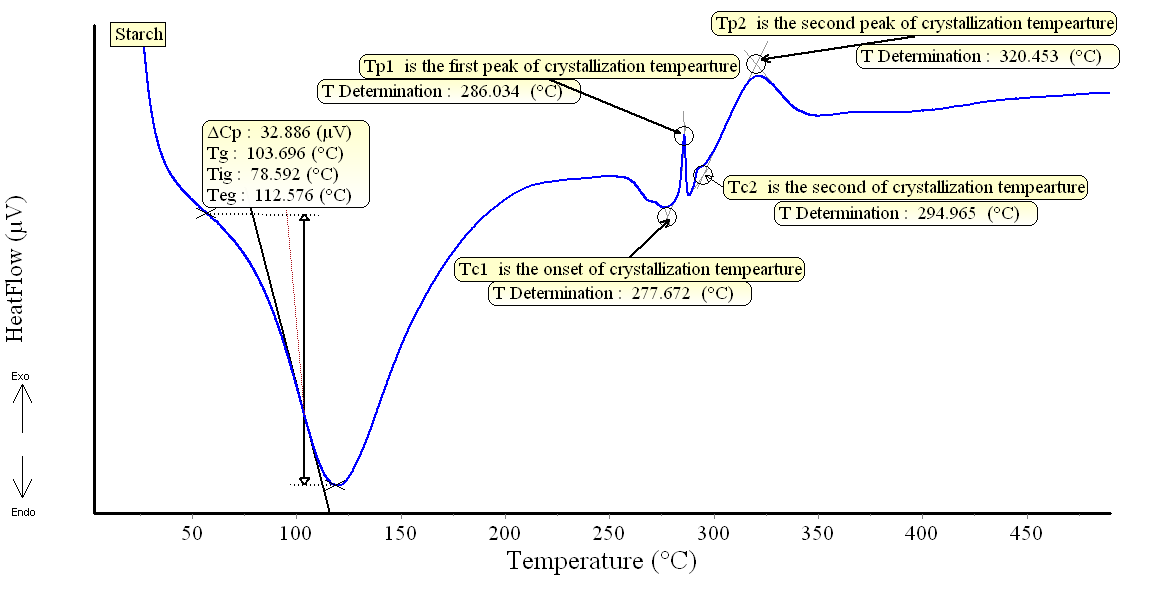 | Figure 3. DSC pattern of starch at 15 K/min |
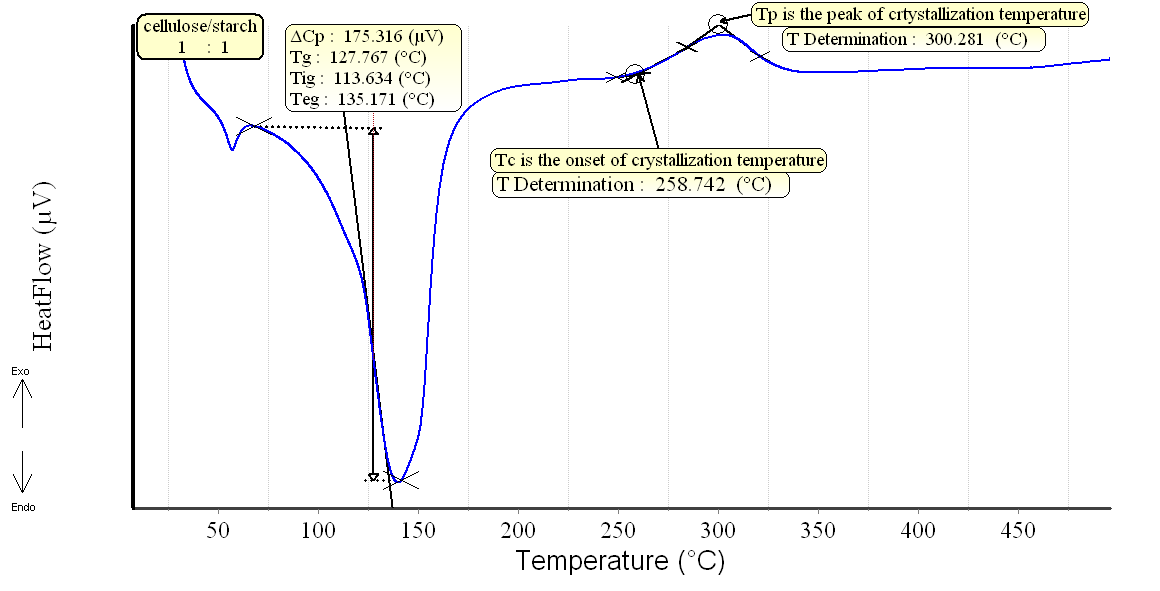 | Figure 4. DSC pattern of starch/cellulose composite in 1:1 at 15 K/min |
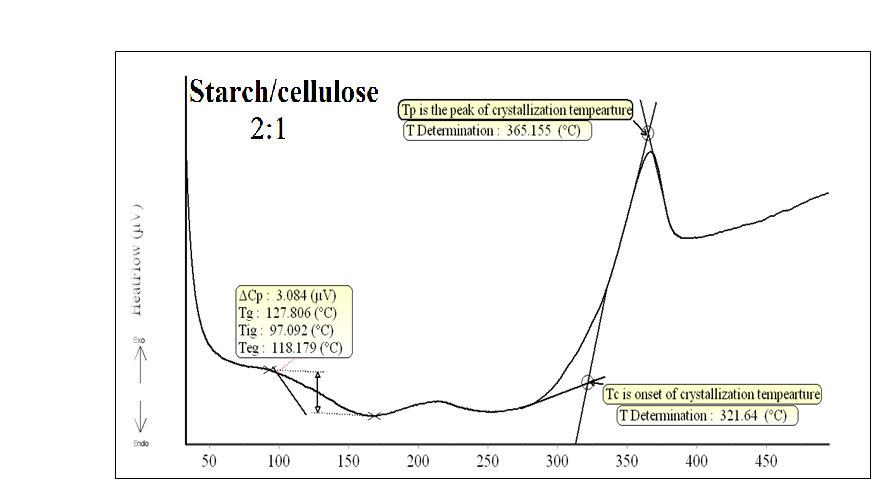 | Figure 5. DSC pattern of starch/cellulose composite in 2:1 at 15 K/min |
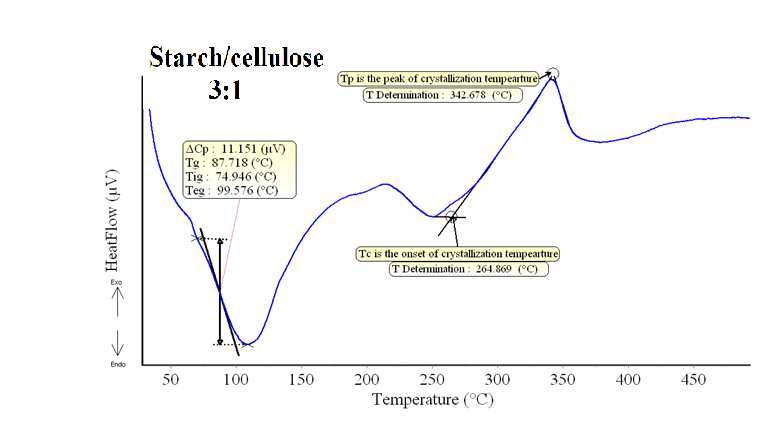 | Figure 6. DSC pattern of starch/cellulose composite in 3:1 at 15 K/min |
4. Conclusions
To the best of our knowledge, this is the first time we report an eco-composite from paper garbage and corn starch. Our results proved that, the starch/mercerized cellulose composite prepared in 2:1 ratio is the best among other ratios. Starch/mercerized cellulose composite (2:1) has the lowest thermal expansion with the highest thermal stability owing to the highest crystalinity index. In our future work, we will further explore mechanical properties of starch/mercerized cellulose composite to prove its utility for plastic industry.
ACKNOWLEDGMENTS
We would like to thank Khalid University for its miscellaneous help during this study. This project (KKU – SCI – 11 - 020) was jointly supported by King Khalid University.
References
| [1] | SridharMK, Basavarajappa G, Kasturi SG, Balasubramanian, N. Evaluation of Jute as a Reinforcement in Composites. Indian J of Textile Res. 1982; 7: 87-92. |
| [2] | Gassan J, Bledzki K. Alkali treatment of jute fibers: relationship between structure and mechanical properties. J Appl Polym Sci 1999; 71: 623–9. |
| [3] | Westerlind B S,Berg J C. Surface energy of untreated and surface-modified cellulose fibers. JAppl Poly Sci. 1988; 36: 523–534. |
| [4] | Ke T, Sun S X. Effect of moisture content and heat treatment on physical properties of starch and poly lactic acid blends. J applpolymSci. 2001; 81: 1203-1211. |
| [5] | Ke T, Sun SX,Seib P. Blending of poly lactic acid and starchescontaining varying amylose content. J applpolymSci. 2003; 89: 3639-3646. |
| [6] | Park J W , Im S. Biodegradable polymer blends of poly lactic acid and gelatinized starch. PolymEng Sci. 2000; 40: 2539-2550. |
| [7] | SoykeabkaewN, Nishino T, Peijs T.All-cellulose composite of regenerated cellulose fiber by surface selective dissolution. Composites part A.Appl Sci Manuf. 2009; 40: 321-328. |
| [8] | Egusa S, Kitaoka T, GotoM,Wariishi H. Synthesis of cellulose in vitro by using a cellulose/surfactant complex in non-aqueous medium. Angewandtechemie International Edition, 2007; 46: 2063-2065. |
| [9] | Zhao Q, Yam R, Zhang Q, Yang K, Cheng J, LiR. Novel all-cellulose Eco composite prepared in ionic liquids. Cellulose 2009; 16: 217-226. |
| [10] | MarechalY, Chanzy H.The hydrogen bond network in Ib cellulose as observed by infraredspectrometry. J MoleculStruct. 523: 183-186. |
| [11] | MartinsI, Magina S, Oliveira L, Freire C, SilvestreA, Neto C, Gandini A.New bio composites based on thermoplastic starch and bacterial cellulose. Comp Sci and Technol. 2009; 69: 2163–2168. |
| [12] | Gouda M, Keshk S. Evaluation of Multifunctional Properties of Cotton Fabric Based on Chitosan-Metal Film. CarbohydPolym.2010; 80: 505-513. |
| [13] | Raquez J, Nabar Y, Narayan R, DuboisP. Preparation and characterization of maleated thermoplastic starch-based nanocomposites. J Appl Polym Sci. 2011; 122: 639–647. |
| [14] | Li G, Sarazin P, Orts J, Imam S, FavisB. Biodegradation of thermoplastic starch and its blends with poly(lactic acid) and polyethylene: influence of morphology. MacromolChem Phys. 2011; 212: 1147-1154. |
| [15] | [Yang J, Yu J, Fri X. A Novel Plasticizer for the preparation of thermoplastic starch. Chin ChemLett. 2006; 17: 133-136. |
| [16] | DonglinH, LifengY . Preparation of all-cellulose composite by selective dissolving of cellulose surface in PEG/NaOH aqueous solution.CarbohydPolym 2010; 79: 614-619. |
| [17] | Kai A, Keshk S M S. Structure of Nascent Microbial Cellulose II. Polym J. 1999; 31: 61-64. |
| [18] | Segal L, Nelson M, Conrad C M. Further studies on cotton cellulosewith reduced crystallinity. Textil Res J. 1953; 23; 428–435. |
| [19] | Kacurakova M, Smith C, Gidley J, Wilson H. Molecular Interaction in Bacterial Cellulose Composite studied by 1D FT-IR and dynamics 2D-FT-IR. Carbohyd Res. 2002; 337: 1145-1153. |
| [20] | Nada A, Shabaka A, Yousef A, Nour A. Infrared spectroscopicand dielectric studies of swollen cellulose. J ApplPolym Sci. 1990; 40: 731–739. |
| [21] | Cheetham N, Tao L. Variation in crystalline type with amylose content in maize starch granules: an X-ray powder diffraction study. CarbohydPolym. 1998; 36: 277-279. |
| [22] | KeshkS M S, Suwinarti W, Sameshima K. Physicochemical Characterization of Different Treatment Sequences on Kenaf Bast Fiber. CarbohydPolym. 2006; 65: 202-206. |
| [23] | KeshkS M S, Haijia M. A New Method for Producing Microcrystalline Cellulose fromGluconacetobacter xylinus and Kenaf. CarbohydPolym. 2011; 84: 1301-1305. |

 radiation
 The operating voltage and current were adjusted to 40 Kv and 30 mA, respectively. Crystallinity index (C.I.) was calculated from reflected intensity data using Segal et al. method[18], according to the eq. (1),


 Abstract
 Reference
 Full-Text PDF
 Full-text HTML