-
Paper Information
- Next Paper
- Previous Paper
- Paper Submission
-
Journal Information
- About This Journal
- Editorial Board
- Current Issue
- Archive
- Author Guidelines
- Contact Us
American Journal of Polymer Science
p-ISSN: 2163-1344 e-ISSN: 2163-1352
2012; 2(5): 109-114
doi: 10.5923/j.ajps.20120205.05
About Possibilities of Strengthening of Epoxypolymer Composites by Modificated Brick Powder
Dmitro L. Starokadomsky
O. O. Chuiko Institute of Surface Chemistry, Kyiv, Ukraine
Correspondence to: Dmitro L. Starokadomsky , O. O. Chuiko Institute of Surface Chemistry, Kyiv, Ukraine.
| Email: |  |
Copyright © 2012 Scientific & Academic Publishing. All Rights Reserved.
The composites of the epoxypolymer (EP) with the brick powder (BP) are new materials that combine high characteristics with the low price. Herein we discuss about the several such compositions and evaluate some physical characteristics for them. Presented data suggest that BP (at the concentration range from 5 to 50 wt%) increases strength characteristics of the epoxypolymer's compression and abrasion, and reduce his shrinkiness. At the same time, the BP in 10 wt% concentration leads to the frustration and defectation in composite structure. Under the high concentrations of the BP (50 wt%) the plastic deformation disappears, the compression strength increases, contraction decreases, and the destruction of template goes through formation of Chernov-Luders Diagonal; but at the same time usage of high concentrations of the BP leads to increase of swelling of the polymer. The obtained results show that particles of brick powder able to significantly strengthen and structurize the EP-composite, at the same time make it more susceptible for liquid corrosion.
Keywords: Epoxypolymer, Brick Powder, Strength, Compression, Moving, Tearing, Shrinkage, Swelling, Concentr.HNO3, Life-Time, Durability
Article Outline
1. Introduction
- Due to rising prices on polymeric raw materials, a perspectives of low-cost fillers became actual. In particular, it becomes relevant, if necessary fillers made of materials that pollute the environment (build, industrial and polymer waste), in relation to new ecologic initiatives in EC and US. One of their materials is brick powder. Note that the question of hardening epoxy by filling alumina and silica fillers are still relevant, as evidenced the list of works[1-7]. For example, typical filler in studies of new EP-composites stands montmorillonite[3, 8], alumina[10], waste-glass[9]. But in literature data about filling of EP by brick powder have not detected.The red brick is a product of hard thermo-treatment (>1000℃) of alumosilicates. The brick powder (BP) is a available product and perspective material as recycling filler for polymers. BP is well compatible with epoxyresins. In this work the character of BP-influence on strength and swelling of epoxy-polymer (EP). In this work, we avoided the stages of special treatment of BP (organo-modification, ultrasound, endurance in solutions). In the future, we plan to extend the work involving special modifications methods. It is established that decantation in water of thick fraction of brick powder let obtain the filler with good compatibility with epoxy-resins. The possiblities of new composite system epoxypolymer – braick powder were invextigated in this work.
2. Main Body
2.1. Experimental Part
- For obtaining of EP-composites, in epoxydian-resin ED-20 (Russian UfaKhimProm production, see formula) added 12.5 wt% of polyethylene-polyamine. After 5 min of mechanical homogenization, EP-composite was hardened at normal conditions during 3 days, after that t100 oC (2 hours) was carried out. For measurements of compression strength (press Louis Shopper), composition was poured in cylindrical forms (d=1 cm). From their forms, the cylindrical templates 1Ч1.2 cm. The strength to adhesion moving (and tearing) detected on stall plates (and cylinders) adhesive area with glued surface S = 3 cm2 (for tearing – 5 cm2) in machines L.Shopper and Armaveer. Abrasion was determined on the R120 sandpaper with a common passage through 1.5 m. The shrinkage was determined by the change in specimen length of template h=1.5 cm with a micrometer.Swelling measured by growing of mass of templates (lens-form d=10 mm, h(in center)=2mm) in conc.HNO3 during 15 days. Swell degree q measured as Life-time of template in c.HNO3 evaluated as a time (days) of transition fro solid to viscous (when cannot to VZVESIT) state. As filler, the separated (by decantation) brick powder from red usual brick (smooth and dense, production of firm TMM, Ukraine) was used. The decantation carried out by one-stage method: powder poured into a container with distilled water and left for 2 min after shaking poured into a container with distilled water and left after shaking for 2 min.. Then, suspension was separated from sediment, and dried at 100℃. Surface area of obtained powder was S≈9 m2/g.
2.2. Results: Compression Strength
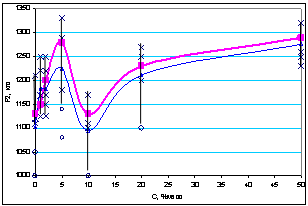
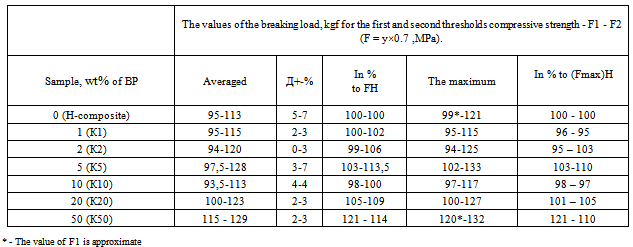
- Diagrams of compression of investigated epoxypolymer identify their dependence on the concentration and type of BP. As is shown (Figure1), the diagram of destruction at compression for unfilled EP (H-composite) have a well-known[10-12] classic shape. We have two limits (thresholds). The first - the yield stress у1 (tensile strength, the threshold for plastic deformation, plasticity limit) reflect the plastic deformation, when template transform to barrel – well-known effect for plastics and metals[10, 11].For investigated composites, the low dispersion of у1 (2-4% instead usual 10-15%) is characteristic.After reaching the yield point, epoxypolymer sample retains the ability to resist compression for quite some time.An extended plateau on the diagram after the first threshold corresponds to plastic deformation with an almost constant resistance - "yield plateau"[11]. Note that this can be critical in practically important cases - those which require resistance to the final destruction, and deformation is allowed (in the manufacture of structures, self-leveling floors, furniture). In our case, after у1, tension resistance of the sample is stabilized and then continues to grow (Figure 1) to the second limit (threshold) of strength у2, sometimes referred as “ultimate state”, stress of destruction[12], the tensile strength[11, p.23], the limit of tensile strength[12, c.50], the threshold of complete destruction, etc. The destruction of the sample is complete after the second threshold strength у2.The unfilled polymer is characterized by noticeable fluctuations (serration) of curve deformation-tension, especially at the "yield plateau" AB between the first and second threshold у1 and у2 (Figure 1, for C=0 wt%). When you add a 1 wt% of BP the form of the diagram maintained similar to H-composite, but it smoothed and serration after у1 on "yield plateau" disappears (Figure 1), and "yield plateau" is compressed. At 2 wt% of the BP type of the diagram is similar to 1 wt%, but significantly different from the diagram for the 0 wt% (Figure 1): yield area is compressed, and the hardening stage tapers section BC before the final destruction (the limit of destruction and the second threshold strength). At 5 wt%, the “yield plateau” is almost no visible growth of tension is terminated and the final destruction site becomes more clear and sharp (Figure 1). Thus, with C>5 wt% the relative deformation and decrease after the first threshold (yield stress у1) faster the stage of hardening, and tensile strength of у2 (second threshold) increases. This suggests a gradual loss of plasticity and increasing of fragile and hardness with increasing of C, that gives an increase of strength (Table 1). Regular change in the form of diagrams and correlation у~C (hardening with increasing of C) interrupted at 10 wt%. At this concentration, the diagrams of compression back to "imperfect" form, which is typical for the unfilled polymer (Figure 1) - with a gear and a significant yield plateau. This can be considered as an evidence of disordering (loosening, appearance of defects, etc.) of the structure at C=10 wt%. At C=20 wt%, form of the diagram is similar to the form for 2-5 wt%, although threshold points are poorly visible (Figure 1). This may indicate an improvement of load distribution in the composite (no "failures" and "teeth" on the diagram).The diagram form changes radically at C=50 wt% (Figure 1). The relative plastic deformation almost stops (no “yield plateau”). And final destruction у2 (the limit of destruction) can be seen by steps gradually (in stages). At C=50 wt% the fracture behaviour of the sample is specific. For C=0 % (unfilled polymer) and 1≤C≤20 wt%, the destruction of two thresholds (across the barrel-stage and plastic deformation) is completed by cracking along the longitudinal line in a compressed (flattened) sample or dispersal parts of the sample (as in the case of 10 wt%). Destruction of the same composite with 50 wt% of the BP is clearly along the diagonal - to "Chernoff-Luders lines"[13], while its original form does not change. This behaviour suggests the formation of a composite with such a high filling of the new reinforced low-plastic structure compared with the lowest content. Perhaps there is a sharp (percolation) changes in the structure at 20<C<50 wt%.
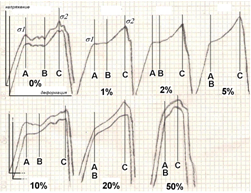 | Figure 1. Diagrams of compression of epoxypolymer with 0-50% by weight of brick powder |
|
2.3. Other Characteristics of the Composites
- Other mechanical characteristics also serve as indicators of structural change with the introduction of brick powder. Data on the shrinkage of the composites show a significant decrease only at high contents of BP. As can be seen from tab.2 at C<=20 wt% change of shrinkage is insignificant (about 10% compared with H-composite, tab.2). However, at 20 wt% is observed double reduction of shrinkage, and at 50 wt%, it almost does not occur (in 40 times less than for H-composite, tab.2). This confirms the conclusion of the hardening of the composite structure the high contents of BP.Abrasion D (wear resistance) of composites does not change up to C=10 wt%. At 10
2.4. Effect of BP Filling on the Swelling of Polyepoxides
- In the same time, filling changes (weaken) the resistance to decrease swelling in aggressive solutions, for example, in 20% HNO3. For low-filled composites (CBP =1 - 2 wt%) increase in swelling is not always apparent, for highly-filled influence of alumina becomes significant. The weakening of the composite resistance to swelling at high contents of BP may be explained by high-permeability (channel, porous, etc.) structure in the polymer.T In earlier our work was showed that a stage of quasi-saturation of polyepoxides swelling in dilute nitric acid[9] is possible. As you can see in 20% HNO3 (Figure4), for unfilled polyepoxide (H-composite) and for C=1 wt% quasi-saturation is observed for 20-35 and 5-20 days of exposure; then begins a new stage of activation of swelling. For H, the swelling can be considered relatively small - 2.5% after 1 month, 4% after 2 months (Figure4).Filling by C>1 wt% leads to the disappearance of quasi-saturation site. In most cases, swelling curve can be divided into the initial stage of swelling area at high speed (up to 20 days), and subsequent swelling of the stage, where the rate is reduced (after which the effective rate of swelling decreases, Figure 4). For example, for C=50 wt% first stage of swelling (up to 20 days) is characterized by the rate of V = 4 %/day, while the second V = 1,5 %/day (Figure4).Usually there is a clear regularity - with increasing of C the degree of swelling increases (Figure4, Figure5). For C=1 wt%, the nature of the swelling does not change: the curve “q-time” copies the curve for H-composite (Figure 4). However, at C=2 wt% and 5 wt%, there is intensification of swelling at all stages of aging. For C=10 wt% the degree of swelling may sometimes decrease compared to 5% by mass (for example, with 7 days exposure, Figure 5). This suggests that the structure of the composite at 5 and 10 wt% is about the same, which is expressed in the same permeability to molecules of the liquid medium. However, this conclusion seems surprising, given the dramatic differences in compressive strength (tab. 1, Figure 3) and separation (tab.2). We can suggest that in the range 5wt% a strong set, but more permeable to the solvent structure of the composite (relative to unfilled polymer). Most likely, a major role in structuring the composite play aluminosilicate framework structures. Thus, with increasing of filling of C=5 or 10 wt%, the density of the structure remains unchanged, but increases its imperfection and fragility, which leads to a drop in strength while maintaining resistance to swelling (compared to 5 wt%).The noticeable intensification of swelling occur for CBP=20 wt% and especially 50 wt% (Figure4, Figure5). At 20 wt%, the swelling increased very significantly (q(20wt%)/q(H) ≈ 3, q(20wt%)/q(5 or 10wt%) ≈ 2). This suggests a significant loosening of the structure of composite from C=10 to C=20 wt%, which is typical for nanosilica[9]. Trends to increase swelling with increasing of filling continues from 20 to 50 wt%. For C=50 wt% can see the visual differences: the composite is similar to cast stone, but when exposed to a solution of HNO3, its quickly brightens. The growth of strength at 20 and especially 50wt% shows a high-permeability formation for liquids, but resistant to the stresses of the composite frame structure.
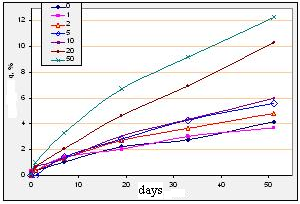 | Figure 4. The swelling curves of PE with 0-50 wt% of BP in 20% HNO3 |
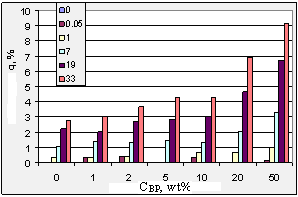 | Figure 5. Changes in the degree of swelling of PE with 0-50 wt% of BP as a function of exposure time in 20% HNO3 |
3. Conclusions
- The introduction of BP in a wide concentration range (1-50 wt%) can be an effective method to control the strength, shrinkage and durability/swelling of epoxypolymer composite.Each concentration of BP-filler is characterized by own structure of compression diagram. The introduction of BP generally has a reinforcing, structuring effect on the epoxypolymer. Also established the possibility of the existence of not only optimal, but suboptimal concentrations of BP (10 wt%) composites, in which the inherent instability and loss of original strength properties takes place.It is shown that low concentrations of BP (1-2 wt%) have weak effect on compressive strength, abrasive, swelling and shrinkage of the composite. The introduction of BP in large quantities can prevent shrinkage of the composites, and in this case - to increase the compressive strength and abrasion resistance of composites. In this case, however, starting with CBP=2 wt% resistance of the composite to an aggressive (acidic) environment is reduced. This is reflected in the growth of the swelling in the nitric acid of filling is increased, especially after CBP=10 wt%.The effect of significant changes in the properties of the composite (percolation threshold) in CBP=50%, which influences in a change in the form of diagrams, the nature of fracture, and a sharp rise in the compressive strength, abrasion, swelling and reducing shrinkage.
References
| [1] | M.Worzakovska. “Epoxy matrix composites filled with glass wastes.” , in Proceedings of Intern.Conf. “Actual Problems of Surface Chemistry”, Kiev, Ukraine, 2010. |
| [2] | V.L. Demchenko, V. I. Shtompel, V.O. Vіlensky, “Features of the structure of composites based on polymer mesh structure and oxides of Fe (III) and Al (III), formed in a constant electric fielid”, Polymer Journal (in Russian), V.31, № 3, pp.235-243, 2009. |
| [3] | Y.Y.Choi, S.H.Lee, S.H.Ryu, “Effect of silane functionalization of montmorillonite on epoxy/montmorillonite nanocomposite”, Polymer Bulletin, N 63, pp.47-55, 2009. |
| [4] | “Polymer/layered silicate nanocomposites by combined intercalative polymerisation and melt intercalation: a masterbatch process”, B.Lepoittevina, N.Pantoustiera, M.Devaickenaerea, M.Alexandrea, C.Callergb, R.Jeromeb, C.Henristd, A.Rulmond, Ph.Dubois, POLYMER, V.44, N7, pp.2033-2040, 2003. |
| [5] | I.G. Dobrotvor, P.D. Stuhlyak, A.V. Buketov, “Determination of optimal ranges of dispersed filler content in epoxypolymer composition”, Phys.-Chim.Mehanika Materials (Riga, EC), № 6, ppp.32-39, 2009. |
| [6] | D.L. Starokadomsky, “The effect of the content of the unmodified nanodispersed silica with different specific surface on the mechanical properties of epoxypolymer composites”, Journal of Applied Chemistry, № 12, pp.2045-2051, 2008. |
| [7] | V.A. Liopo, V.A. Struk, S. Avdeychik, “The mechanism of the doping nanoscale modifiers in the polymer matrix”, Plastics, 2007, № 8, pp..36-39. |
| [8] | V.A. Borisov, Y.U. Bedanokov, A.M. Karmok, A.K. Mikitaev, M.A. Mikitaev, E.R. Turaev, “Properties of polymer nanocomposites based on organo-modified Na +-montmorillonite”, Plastics, 2007, № 7, pp.30-32. |
| [9] | D.L. Starokadomsky, “The concentration and dispersity of aerosil as a factor of change in chemical resistance and durability of epoxy-based DE-20 + PEPA”, Proceedings Slavpolykom 2008, Kiev-Yalta, 2008, pp.40-44. |
| [10] | Epoxy or polyepoxide containing coating...Composition comprising thermosetting plastic resin with comminuted recycled glass powder as a filler. // Patents In Field 427/386 - patents.justia.com/field/427-386.html. |
| [11] | M.M.Fylonenko-Borodin, S.M. Yzyumov, B.A. Olysov, I. N. Kudryavtsev, L.I. Malginov, “Course of resistance of materials”, Moscow: USSR-HYTTL, 1956, 650 p. |
| [12] | NK Snytko, “Resistance of materials”, Leningrad: Edition LHU, 1975, 370 p. |
| [13] | Introduction to resistance of materials. Ed. VE Melnikov, St.- Petersburg (Russia), 1999, 160 p. |
| [14] | Stepin PA, “Resistance of materials”, Moscow, 1998, 320 p |
 Abstract
 Reference
 Full-Text PDF
 Full-Text HTML
