Maher Z. Elsabee1, Mohamed A. Nassar2, Salah E. M. El-begawy2
1Department of Chemistry, Faculty of Science, Cairo University Cairo, 12613, Egypt
2Science and Technology Center of Excellence (STCE) Ministry of Military Production, Cairo, Egypt
Correspondence to: Maher Z. Elsabee, Department of Chemistry, Faculty of Science, Cairo University Cairo, 12613, Egypt.
| Email: |  |
Copyright © 2012 Scientific & Academic Publishing. All Rights Reserved.
Abstract
Aromatic diamine and phthaloyl chloride have been copolymerized using interfacial polymerization technique. Ethylene diamine (EDA) in 20, 30, and 40% and diamino butane (DAB) with the same molar ratio were used in addition to p-phenylene diamine to prepare polyamide with aliphatic components in the chain. The copolymers were characterized by FTIR Viscosity measurements were obtained in concentrated sulphuric acid.Thermogravimetric analysis and DrTGA showed that the thermal stability of the prepared polymers decreases by increasing of the ratio of the aliphatic diamines. The aliphatic content affects the crystallinity of the prepared polymers as was shown by X-ray diffraction measurements. Scanning electron microscopy revealed that the aliphatic components cause the copolymers to have a more homogeneous appearance with a different morphology. The mechanical parameters (Longitudinal modulus, L, shear modulus, G, Young’s modulus, E, bulk modulus, K, and Poisson’s ratio, p) were calculated from ultrasonic velocities and the densities of the isotropic materials. All mechanical characteristics were found to decrease with increasing aliphatic percent.
Keywords:
P-Phenyleneterephthalamide, Aliphatic Polyamides, FTIR, Thermal and X Ray Analysis, SEM, Ultrasonic Velocity Measurements
Cite this paper: Maher Z. Elsabee, Mohamed A. Nassar, Salah E. M. El-begawy, Preparation and Characterization of Some Aromatic/ Aliphatic Polyamides, American Journal of Polymer Science, Vol. 2 No. 1, 2012, pp. 7-13. doi: 10.5923/j.ajps.20120201.02.
1. Introduction
The increased demand of synthetic polymers to replace the traditional materials, such as wood, metals and natural fibers has stimulated the research for more versatile polymeric materials having a wide range of properties. One need is for highly stiff and heat-resistant polymers which ca n replace steel or glass fibers for use as reinforcement materials in composites or in the production of robes, cables hoses and fabrics for ballistic applications. Aromatic polyamides (or aramids) successfully meet these demands Kevlar, Poly (P-phenyleneterephthalamide) (PPTA), is an organic fiber with a distinct chemical composition of wholly aromatic polyamides (aramids). Kevlar possesses a unique combination of high tensile strength, high modulus, toughness and thermal stability[1]. In air, PPTA demonstrates seven times the tensile strength of steel on an equal weight basis. In sea water, this advantage in tension increases by a factor of twenty.[2] Yamazaki et al.[3] performed the direct synthesis of aromatic polyamides employing triphenyl phosphite (TPP) as activator. Only low molecular weight Para-oriented poly aramids were obtained with their original method. Higashi et al.[4] observed a significant improvement in the inherent viscosity value of poly (p-phenyleneterephthalamide) (PPD- T) by adding to the solvent medium a salt mixture composed of CaCl2, and LiCl, instead of LiCl alonePreston and co-workers[5] found that the optimum temperature for the direct synthesis of the polymers is 115℃. They reported a systematic study of the role of several reaction parameters in order to evaluate the best experimental conditions for the direct synthesis of PPD-T[6], taken as example for AA-BB copolymers and polyamide, in particular, they studied the effect of temperature, salt type and concentration, amount of TPP and its stepwise introduction, under both Yamazaki and Higashi conditions. Sweeny et al.[7] attempted to improve the compressive modulus of Kevlar-29 by incorporating an activated aryl halogen into the molecular sequence of PPTA. Jiang et al.[8] also developed an activated form of PPTA by incorporating a benzocyclobutene-modified derivative of terephthalic acid, into the polymer backbone during pre fiber production. Hindeleh[9] reported a correlation between tensile modulus and transverse crystallinity, which is highly dependent upon hydrogen bonding. These studies illustrate the strong relationship between the tensile behavior of the PPTA fibers and its transverse and axial crystalline perfection. Accordingly, the relationship between crystallite perfection and behavior in compression must not be overlooked.Dobb and Robson[10] studied the effect of ultraviolet radiation on the tensile properties of Kevlar 149 PPTA fiber and Technora copolymerized aramid fiber. Toy and Stringham[11] reported that simulated solar radiation of Kevlar 29 aromatic polyamide fabrics in air produced oxidized low- molecular-weight polymers through fission of the amide linkages. Their results were obtained by proton NMR of the solvent extracts from the polymer samples.The present work makes use of a simple method for the preparation of several polyamides using an interfacial polymerization technique and reports the changes which follow the introduction of aliphatic diamines in the polyamide chains.
2. Experimental
2.1. Materials
Terephthaloyl chloride (C8H4CL2O2), isophthaloyl chloride (IPC, C8H4CL2O2) with minimum assay 99.0%, 1,4 Diaminobutane (C4H12N2), with minimum assay 98.0%, H2O ≥0.5%, 1,4-phenylenediamine (C6H8N2) with minimum assay 97.0%, m.p:138-143℃ were purchased from (Fluka). Ethylenediamine (EDA, C2H8N2) was obtained from (Sigma Aldrich), b.p:117-118℃, m.p: 10℃, Potassium Hydroxide (KOH) and sulfuric acid (H2SO4, 98%) were purchased from (ADWIC).Solvents:All the organic solvents used were purified according to standard procedures.
2.2. Preparation of the Polyamides
Copolyamides were prepared by condensation of aromatic diacid chloride (terephthaloyl chloride TPC or isophthaloyl chloride IPC) and diamines at low temperature by interfacial polymerization. For this purpose, a measured amount of diamines were dissolved in hot distilled water containing potassium hydroxide left to cool and then the aqueous solution was added dropwise to a chloroform solution containing a stoichiometric amount 1 mol Terephthaloyl chloride TPC (1 mole). After two hours of the reaction time, the mixture was allowed to come to room temperature, and the stirring was continued for 24 h to ensure the completion of the polymerization reaction. The mixture was stirred for two hours with cooling, filtered and dried in drying oven at 120℃ for 24 hours or until constant weight was achieved. Table 1 shows the monomer compositions of samples from 1 to 11 Elemental analysis was carried out in the Micro Analytical Unit in Cairo University
2.3. Characterization of the Prepared Polymers
Spectral analysisFourier transform infrared (FTIR) spectroscopy was measured with Nicolet Avatar 370Cs2 FTIR spectrophotometer between 400 and 4000 cm -1Thermal analysisThe thermo gravimetric analysis (TGA) for the prepared polymers were carried out with Shimadzu TG-50H analyzer at heating rate of 10℃/min at the Central Micro Analytical Unit in Cairo University.| Table 1. Elemental analysis data of the prepared copolymers |
| | Sample # (composition) | C, wt% | H, wt% | N, wt% | | 1 (1 mol p-PDA+1 mol TPC) | 64.79 | 5.10 | 10.84 | | 2 (0.2 EDA + 0.8 p-PDA + 1 mol TPC) | 65.16 | 7.06 | 9.75 | | 3 (0.3 EDA +0.7 p-PDA + 1 mol TPC) | 61.28 | 8.63 | 12.45 | | 4 (0.4 EDA +0.6 p-PDA + 1 mol TPC) | 62.72 | 5.84 | 9.96 | | 5 (0.2 DAB +0.8 p-PDA + 1 mol TPC) | 64.19 | 6.43 | 11.37 | | 6 (0.3DAB + 0.7 p-PDA + 1 mol TPC) | 68.88 | 4.71 | 10.03 | | 7 (0.4 DAB + 0.6 p-PDA + 1 mol TPC) | 62.13 | 6.85 | 8.79 | | 8 (1 mol m-PDA+ 1 mol IPC) | 62.79 | 6.15 | 10.86 | | 9 (1 mol m-PDA + 1 mol TPC) | 62.57 | 5.83 | 9.10 | | 10 (EDA + TPC) | 52.73 | 2.39 | 9.34 | | 11 (DAB + TPC) | 53.66 | 2.97 | 6.09 |
|
|
X-RayDiffraction was measured using Scintag/USA XGEN- 4000 at 45 kV and 40 mA using nickel-filtered CuK radiation. A measure of the crystallinity was obtained by comparing the area of the crystallinity peaks to the whole area.ViscosityAn Ubbelohde viscometer was used to measure solvent and solution viscosities using concentrated sulfuric acid as the solventScanning electron microscopy (SEM)The surface morphology of the copolymers was observed using SEM. The dried sample of polyamide was ground and then coated with gold under vacuum using a sputter coater. The scanning electron microscopy (SEM) was conducted using a JEOL JSM-630 J scanning electron microscope operated at 20 kVUltrasonic measurementsThe ultrasonic compression wave velocity and shear wave velocity measurements were performed using the pulse–echo technique at a frequency of 3 MHz. The ultrasonic wave velocity can be obtained from the relation, | (1) |
Where t is the transit time and d is the sample thickness.The elastic module (Longitudinal modulus, L, shear modulus, G, Young’s modulus, E, and bumodulus, K, p, Poisson’s ratio) are calculated from ultrasonic velocities and the density of the isotropic materials as given in Equations [12]. | (2) |
 | (3) |
 | (4) |
 | (5) |
 | (6) |
 | (7) |
Density measurements The density was measured using the suspended weight method based on the Archimedes principle. Repeated density measurements agreed within ±0.01%.
3. Results and Discussion
Little work has appeared in the literature regarding the structure-property relationships for polyamides. To help fill this void a series of different derivatives of diamine and dicarboxylic acid chlorides has been used to prepare various polyamides with the intenttovary the characteristics. The completely aromatic polyamides have high thermal properties but they are also very stiff molecules. The introduction of aliphatic groups can reduce the softening temperature and increase solubility by increasing the freedom of chain structures. The introduction of these aliphatic groups may increase solubility (in a polar solvent) and enhance miscibility of PPTA with other polar polymers. By changing the amounts and length of the aliphatic side groups, one can develop modified PPTAs with a wide range of structures.| Table 2. Physical data of the prepared copolymers |
| | Sample | Yield% | Densityg/cm3 | Viscosity[η] dl/g | Crystallinity% | | 1 | 98 | 1.42 | 0.538 | 59.40 | | 2 | 97 | 1.42 | 0.197 | 50.20 | | 3 | 98 | 1.42 | 0.157 | 48.15 | | 4 | 94 | 1.42 | 0.391 | 54.40 | | 5 | 96 | 1.42 | 0.354 | 51.00 | | 6 | 95 | 1.42 | 0.306 | 46.80 | | 7 | 97.4 | 1.42 | 0.2096 | 58.80 | | 8 | 93 | 1.42 | 0.446 | 25.80 | | 9 | 95 | 1.42 | 0.425 | 32.20 | | 10 | 96 | 1.41 | 0.134 | 62.80 | | 11 | 97 | 1.41 | 0.298 | 69.50 |
|
|
Table 2 depicts physical data of the different polyamide samples with different contents of the two aliphatic diamines. The introduction of up to 40% aliphatic groups did not affect much the density of the obtained polymers as evident from column three in the Table. The viscosity on the other hand has changed although its measurement was quite difficult due to the need to use concentrated sulfuric acid as the solvent which is the only solvent for these polyamides. Table 2 also shows that the viscosity of the copolymers decreases with the introduction of both ethylene diamine and 1, 4 diaminobutane.
3.1. FTIR Analysis of the Polymers
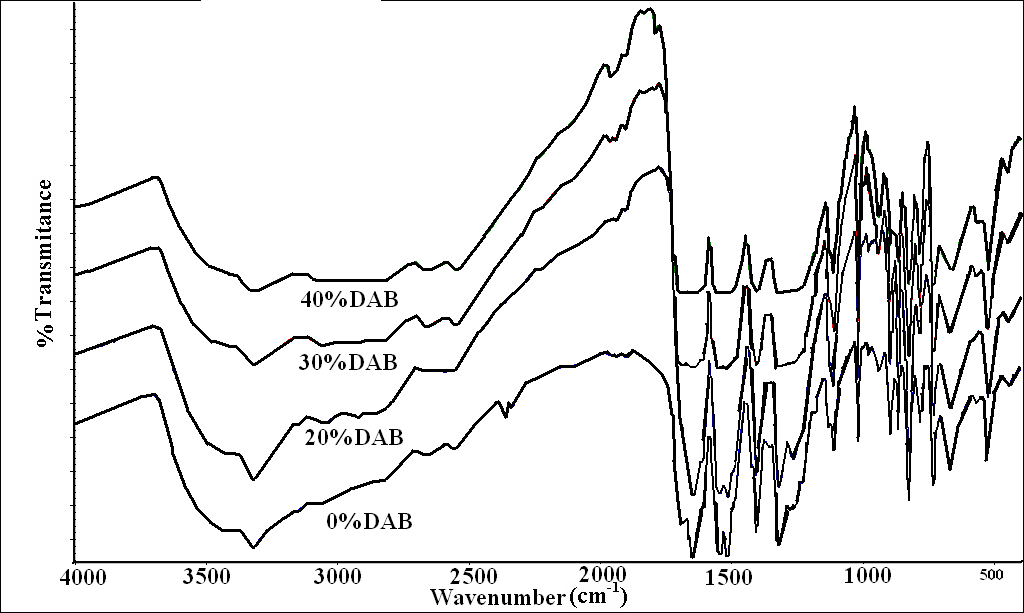
The FTIR spectra of the polymers show the N-H stretching band at around 3326 cm-1 with a broad shoulder at higher wave number probably due to the terminal –OH groups (or from traces of water molecules entrapped into the polymer matrix). The –CH and –CH2 stretching vibrations appear at 2856 and 2589 cm-1 respectively. Figure 1 shows the FTIR spectra for samples 1-4; a strong sharp single band at 1643 cm-1 for sample 1 is due to amide I (C=O group), which seems to be at lower wave number than the normal carbonyl [13] stretching possibly due to strong H-bond formation. A similar band can be seen in the spectrum of sample 2 (0.2:0.8:1 EDA:PDA:TPC). This means that the 20% content of EDA has little effect on the chain alignment. As the % of EDA in the copolymer increases (at the expense of p-PDA), a shoulder starts to be evident for the 30% and 40% EDA respectively. The higher percentages of EDA affect the chain alignment and reduce the chance for a strong H-bond formation. In order to provide additional support this argument a 1:1 copolymer of EDA and TPC was formed (10) using the same interfacial technique. In its FTIR also shown in Figure 3, the carbonyl stretching band splits into almost 10 bands spanning from 1969 cm-1 to 1635 cm-1. An intensification of the –CH2 and –CH stretching bands is also observed (not shown).The spectra in Fig 1 shows also other bands typical for polyamides: amide II at 1544 cm-1, -CH2 and –CH bending at around 1407 cm-1, amide III band at 1319 cm-1, -C-O stretching at 1018 cm-1, -NH out of plane bending around 730 cm-1.An analogous set of spectra was measured for the diaminobutane terephthalic chloride copolymers and the spectra are shown in Fig 2 using 20, 30 and 40% DAB mixed with 80, 70, and 60% p-PDA and 1 mol TPC. 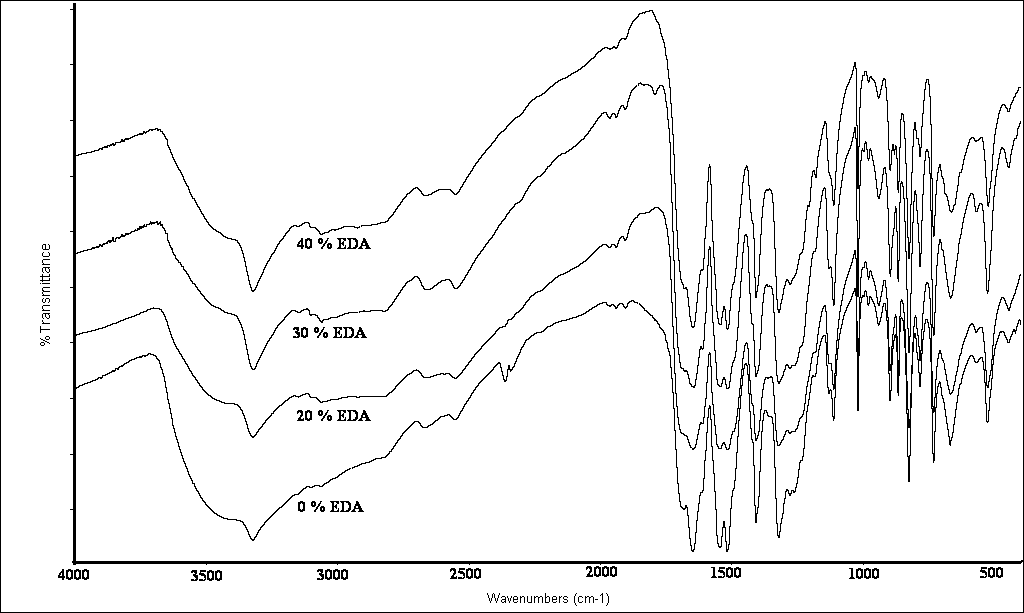 | Figure 1. FTIR spectra of PPTA and samples 1-3 with 20, 30 1nd 40% EDA |
 | Figure 2. FTIR spectra of PPTA and samples 4-6 with 20, 30, and 40% DBA |
The spectra show increased intensity of the stretching vibration of the -CH2 and –CH bands with increasing the DAB ratio in the copolymers and also the increased broadening of the carbonyl bands. However, the spectrum of pure DAB + TPC copolymer (11, Fig 2) shows some different features. Although the intensity of –CH2 and –CH bands were increased, the carbonyl band did not show the splitting pattern as in Fig 1, here the band was almost sharp with small shoulder at the lower wave number side. It seems that the longer aliphatic chain led to more ordered structure than the shorter one.In the spectrum of isophthaloyl chloride with ethylenediamine (IPC+EDA) (Fig 3, absorbance mode from 1300-1800 cm-1), (the carbonyl stretching band shows a different pattern; there is a small shoulder at high wave number (around 1780 cm-1) indicating different chain alignment and consequently different mode of H-bond formation with the NH2 groups.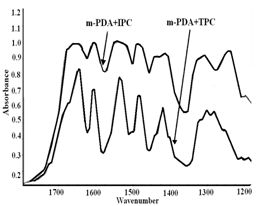 | Figure 3. FTIR spectra of m-PDA +IPC (8) and m-PDA +TPC (9) |
3.2. X-Ray analysis of the copolymers
Fig 4 illustrates the X-ray diffraction pattern of powdered sample 1, (1:1 PPDA: TPC). The spectrum shows two sharp peaks at 2θ = 20.20 and 23.20, a smaller band at around 28°-30°. The sharp peaks indicate high crystalline structure. The Fig also shows the diffraction patterns of the three EDA samples with 20, 30 and 40%EDA in which a new smaller band appears at around 16°-18° as well as a shoulder at 25°.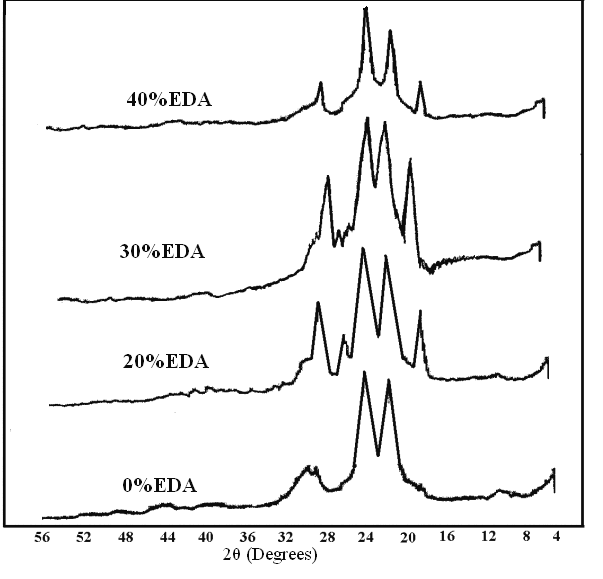 | Figure 4. X-Ray patterns for PPTA (1) and samples with 20, 30, and 40% EDA (2-4) |
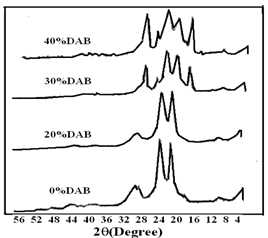 | Figure 5. X-Ray patterns for PPTA and samples with 20, 30, and 40% DAB (5-7) |
These features indicate an increase in the spacing between the polymer chains. Similar behavior can be observed in Fig 5 for 1:1 DAB: TPC. The new two bands at around 16° and 28° were pronounced with samples 10 and 11containing copolymers of pure aliphatic diamines with PPDATable 2 depicts the crystallinity values for some of the prepared copolymers. As described above, the percent crystallinity was calculated by dividing the area of the sharp peak by the total area under the curve. As expected, the % crystallinity of sample 1 (1:1 PPDA: TPC) is the highest among the series of polyamides synthesized from both aliphatic and aromatic amine. This is due to the higher probability for the alignments of the chains in more ordered structure, as corroborated by the FTIR analysis. Samples 10 and 11 in which only aliphatic amines were used with the phthaloyl chloride, showed high crystallinity, as shown in Fig 6 and Table 2. This could be due to the increased mobility of the chains in the complete absence of the aromatic amines, which may hinder easy arrangement of the crystalline formation.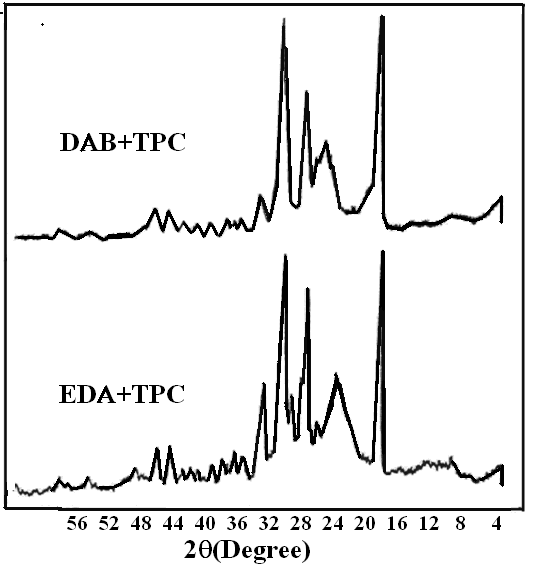 | Figure 6. X-Ray patterns for DAB+TPC and EDA+TPC copolymers (10 & 11) |
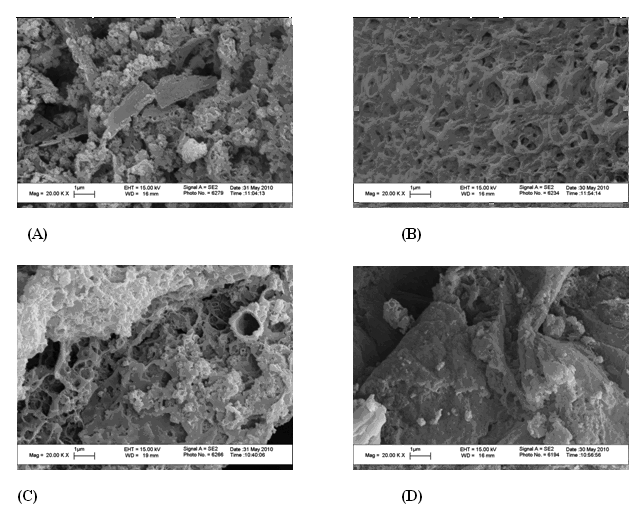 | Figure 7. SEM for samples, #(A) 1, (B) # 10, (C) # 3 and (D) # 7, magnification 20 K |
3.3. Scanning Electron Microscopy SEM
Fig 7 shows some selected SEM photos of 4 samples: (1, 10, 3 and 7) and the photo reveals a heterogeneous structure for the wholly aromatic composition (#1). However, with 30 % EDA (3) or 40% DAB (7) in addition to phenylene diamine, the structure shows more homogeneous features. With the complete replacement of the aromatic diamine with EDA (#10) the SEM photo shows a continuous and more homogeneous structure as shown in Fig 7B. The morphology of polyamide copolymers changes dramatically with the introduction of aliphatic moiety in the chain.
3.4. Thermal Behavior of the Prepared Copolymers
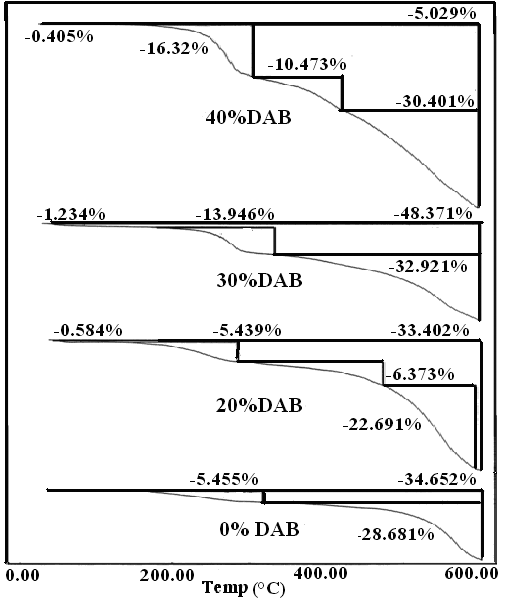
The TGA thermograms and the (DrTGA) of the modified PPTAs (prepared polymers) are presented in Fig. 8-10. The curves show the typical step degradation profile. The data reveal that the introduction of aliphatic groups reduces the softening temperature as a result of increasing the freedom of chain structures. The degradation of the fully aromatic polyamide proceeds in one major step while that of the polyamide containing aliphatic portion (whether EDA or DBA) proceeds in basically two major steps (if water evolution at the early stage of heating is excluded). In Fig 8 one observes water elimination at around 134℃ (it could be also some terminal end groups), and the first decomposition step occurs at around 270℃. This step is repeated in all copolymers containing the aliphatic portion. However, it is absent in the fully aromatic polymer, except in the copolymer made from m-PDA and TPC. It is difficult at this moment to speculate about the nature of the elimination products, more analysis is required to reveal its exact nature. The most probable explanation for this step could be the elimination of a CH2NH2- group which is associated with the aliphatic group. The second stage occurs at around 400-450℃ and is smaller than the first step. The last stages and largest stage occurs at around 569℃ with about 25% weight loss, corresponding to a drastic degradation of the polymeric chain.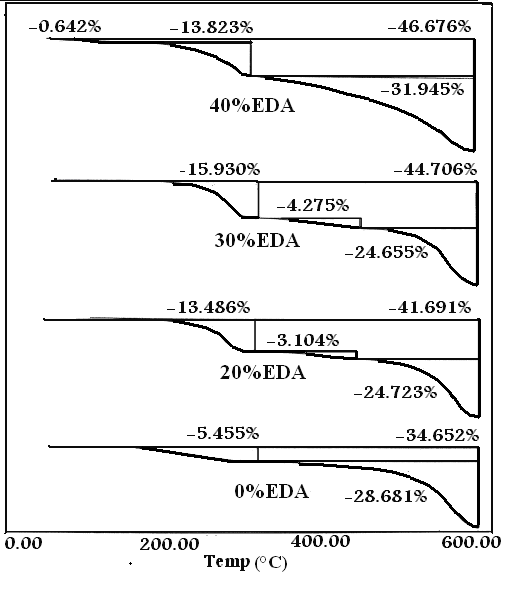 | Figure 8. TGA curves for samples 1 and 2-4 |
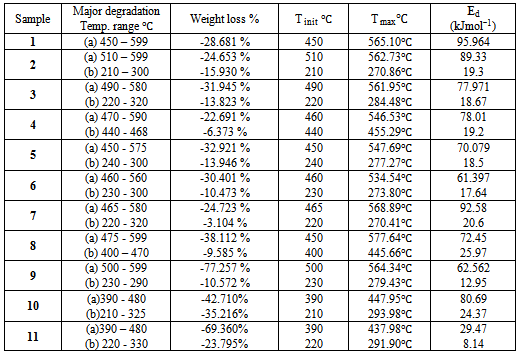
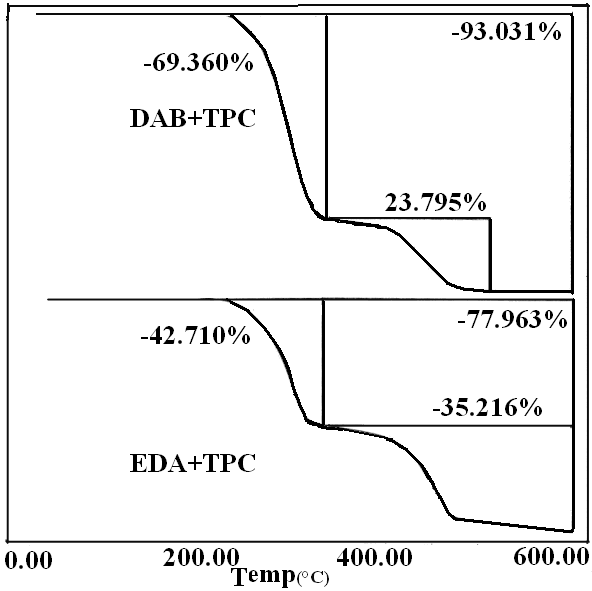
The summarized thermal data presented in Table 3 show that sample 1 (1:1 p-PDA: TPC) exhibits the highest thermal stability, since only 34% of the original polymer was decomposed at 600℃, much smaller than the rest of the copolymers. A systematic decrease in the thermal stability is almost proportional to the extent of the aliphatic portion. Samples 10 and 11 made from EDA and DBA with TPC respectively illustrate clearly that the aliphatic component decomposes at around 290℃; the first decomposition peak corresponds to about 47% for the EDA copolymer and around 67% for that of the DAB.Table 3. The values of activation energy of prepared polymers
 |
| |
|
 | Figure 9. TGA curves for samples 1 and 5-7 |
 | Figure 10. TGA curves for samples 10 and 11 |
3.5. Activation Energy Calculation
Degradation activation energy (EdkJmol−1) for the major degradation step was computed using the Dharwadkar and Kharkhanavala equation:[14] | (8) |
 | (9) |
where ms, m and mf are the initial, actual and final mass of the sample, respectively. Ed, energy of activation; R, gas constant; Ti, temperature of inception of the reaction; Tf, temperature of completion of the reaction; θ= (T- Ts) where Ts is the temperature at the point of inflection in the TGA curve; C, constant. A plot of Ln [−ln (1-α)] versus θ results in a straight line with a slope = (E/RTi2) (100/Tf–Ti), from which Ed can be calculated.The activation energy data are summarized in Table 4. The activation energy decreases with the introduction of the aliphatic groups, as indicated by the decrease in thermal stability. Samples 10 and 11 demonstrate this behavior clearly .showing much lowers activation energy for the decomposition which was observed earlier from the TGA curves shown above.Table (4): The values of activation energy of prepared polymers
3.6. Ultrasonic Measurements
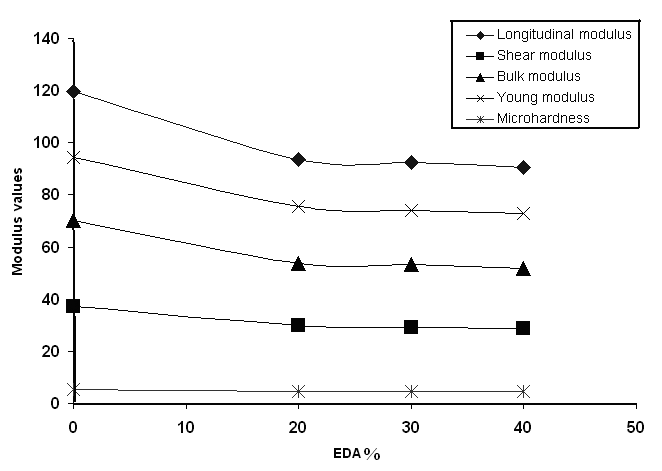
Ultrasounds have found numerous uses in a number of applications, in particular, in polymer characterization, in both the solid and the molten states. Ultrasonic methods have been used in a variety of investigations[15]. The most commonly used methods are the sing-around and pulse echo methods. An advantage of this method is that the sound velocity can be measured at the same time as the attenuation. Using an oscilloscope, such as a 60-MHz time-based oscilloscope, direct measurement of the time required for the pulses to travel twice the length of the specimen is possible, allowing calculation of the ultrasonic wave velocity as given in the experimental part. Fig 11 and 12 show the effect of the aliphatic diamines on the mechanical parameters of the copolymers using the ultrasonic propagation techniques. All parameters were found to decrease with increasing the aliphatic diamine content.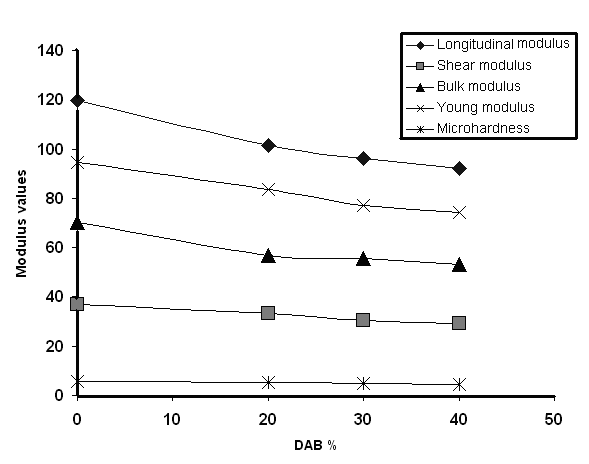 | Figure 11. Plot of Modulus values vs. DAB % |
 | Figure 12. plot of Modulus values vs. EDA % |
4. Conclusions
Para-phenylene diamine was copolymerized with phthal- oyl chloride to produce polyamide PPTA by simple interfacial polymerization method. The obtained polymer was soluble only in concentrated sulfuric acid and has relatively low molecular weight. In an attempt to increase the solubility in order to expand the polymer applicability several aliphatic diamine were used in addition to the phenylene diamine however no enhancement of the solubility was achieved. The morphology of the modified polymers differs from the original PPTA; infra red spectroscopy showed also changes in the carbonyl region indicative of changes of inter and intra-molecular interactions which were reflected in the crystallinity of the different copolyamides. SEM microscopy revealed that the surface morphology of copolymers changes with changing the composition. Thermal analysis indicated that these polyamides are thermally stable and that the degradation pattern also is affected by the percent of the aliphatic component in the chain. The intractable nature of the polymers in its present form (conversion into fibers was not possible in the present time) led us to measure some mechanical characteristics using ultrasound propagation method. Here also the mechanical parameters were lowered with increasing the aliphatic concentration.
References
| [1] | DuPont Kevlar, Technical Guide DuPont Advanced Fiber Systems (2000) |
| [2] | Tanner D.; Fitzgerald J. A.; Phillips B. R. Story of an Advanced Materials Case Study. Advanced Materials, 5, 151 (1989) |
| [3] | Higashi F. Ogata S.-I. Aoki Y. High-molecular-weight poly(p-phenylenetere phthalamide) by the direct polycondensation reaction with triphenyl phosphite J Polym Sci Part A: Polym Chem., 20, 2081 (1982) |
| [4] | Yamazaki N. Matsumoto N. Higashi F. Studies on reactions of the N-phosphonium salts of pyridines. XIV. Wholly aromatic polyamides by the direct polycondensation reaction by using phosphites in the presence of metal salts J P: Polym Chem, 13, 1373 (1975) |
| [5] | Krigbaum W.R. Kotek R. Mihara Y. Preston. J. Preparation of polyamides via the phosphorylation reaction. IX. Effect of reaction temperature on molecular weight on poly (p- phenylene terephthalamide) J Polym Sci Part A: Polym Chem, 22, 4045 (1984) |
| [6] | Alberto Mariani, Sabina L.E. Mazzanti, Saverio Russo. Role of the reaction parameters in the direct synthesis of aromatic polyamides Canadian Journal of Chemistry, 73, 1960 (1995) |
| [7] | United States Patent, Patent Number: 4,883,634, Date of Patent: Nov.28, (1989) |
| [8] | Sweeny W. Improvements in compressive properties of high modulus fibers by crosslinking J Polym Sci Part A: Polym Chem, 30, 1111 (1992) |
| [9] | Dobb M. G. Johnson D. J. Saville B. P Microvoids in aramid-type fibrous polymers Polymer, 20, 1284. (1979) |
| [10] | Hindeleh A. M. Halim N. A. Ziq, K. A. Solid-state morphology and mechanical properties of Kevlar 29 fiberJ of Macromolecular Science – Physics, 23(3) 289 (1984) |
| [11] | Dobb M.G. Robson R.M. The ultraviolet sensitivity of Kevlar 149 and Technora fibers. Journal of Materials Science, 28, 785 (1993) |
| [12] | Toy M.S. Stringham. R.S. Polymeric Materials Science and Engineering, 51, 146-8 (1984) |
| [13] | Perepechko I Acoustic Methods of Investigating Polymers, Moscow (1975) |
| [14] | Pavi D.L. Lampman G. M. Kriz G .S. Introduction to spectroscopy Thomson Learning, Inc. Third Ed pp50 (2001) |
| [15] | Hirschler M.M. (2000) Chemical aspects of thermal decomposition. In: Grand A. F, Wilkie CA, Eds. Fire retardancy of polymeric materials. Marcel Dekker New York,; p p. 61 |
| [16] | Truell R. Elbaum C. Chick B. Ultrasonic Methods in Solid State Physics Academic Press: New York and London, (1969) |


 Abstract
 Reference
 Full-Text PDF
 Full-text HTML