
-
Paper Information
- Paper Submission
-
Journal Information
- About This Journal
- Editorial Board
- Current Issue
- Archive
- Author Guidelines
- Contact Us
American Journal of Operational Research
p-ISSN: 2324-6537 e-ISSN: 2324-6545
2026; 16(1): 23-35
doi:10.5923/j.ajor.20261601.03
Received: Aug. 19, 2026; Accepted: Sep. 16, 2026; Published: Sep. 22, 2026

HACCP and FMEA for Risk Prioritization in Food Manufacturing: A Statistical Evaluation of Sour Cream Production
 Abstract
 Reference
 Full-Text PDF
 Full-text HTML
Roʻziokhunova Khilolakhon Jaloldin kizi1, Kasimov Ilyazbek Davronbekovich2, Khakimov Dilmurod Valijon ugli3
1PhD Student at Andijan State Technical Institute, Andijan, Uzbekistan
2Independent Researcher at Andijan State Technical Institute, Andijan, Uzbekistan
3Associate Professor at Tashkent State Agrarian University, Doctor of Philosophy (PhD) in Technical Sciences
Correspondence to: Khakimov Dilmurod Valijon ugli, Associate Professor at Tashkent State Agrarian University, Doctor of Philosophy (PhD) in Technical Sciences.
| Email: |  |
Copyright © 2026 The Author(s). Published by Scientific & Academic Publishing.
This work is licensed under the Creative Commons Attribution International License (CC BY).
http://creativecommons.org/licenses/by/4.0/

This study proposes an integrated HACCP–FMEA approach for identifying, assessing, and prioritizing risks in sour cream production. HACCP was applied to identify biological, chemical, and physical hazards and to determine critical control points, while FMEA was used to evaluate process-related failure modes based on severity, occurrence, and detection ratings. Eighteen risk scenarios were assessed before and after the implementation of preventive, monitoring, and corrective measures. The total Risk Priority Number (RPN) decreased from 3695 to 900, corresponding to a 75.64% reduction, while the mean RPN decreased from 205.28 to 50.00. The standard deviation of RPN values also decreased from 64.88 to 12.42, indicating improved process stability and reduced variability in risk levels. After implementation, all evaluated risks were reduced to a low-priority and manageable level. The statistical significance and robustness of the observed changes were evaluated using the Shapiro–Wilk test, paired Student’s t-test, non-parametric sign test, 95% confidence interval, and effect-size analysis.
Keywords: HACCP, FMEA, Risk prioritization, Risk Priority Number, Food safety, Sour cream production, Quality management, Statistical evaluation
Cite this paper: Roʻziokhunova Khilolakhon Jaloldin kizi, Kasimov Ilyazbek Davronbekovich, Khakimov Dilmurod Valijon ugli, HACCP and FMEA for Risk Prioritization in Food Manufacturing: A Statistical Evaluation of Sour Cream Production, American Journal of Operational Research, Vol. 16 No. 1, 2026, pp. 23-35. doi: 10.5923/j.ajor.20261601.03.
Article Outline
1. Introduction
- Food manufacturing is a complex system in which raw-material quality, technological conditions, equipment performance, personnel activities, sanitation, packaging, storage, and distribution are closely interconnected. Deviations at any of these stages may lead to product nonconformity or create conditions that compromise food safety. For this reason, modern food-safety management increasingly emphasizes preventive and risk-based approaches that enable hazards to be identified and controlled before they result in unsafe or defective products.Hazard Analysis and Critical Control Point (HACCP) is one of the principal preventive approaches used in food manufacturing. It provides a systematic framework for identifying biological, chemical, and physical hazards, determining critical control points, establishing critical limits, and organizing monitoring and corrective actions [1,2]. However, HACCP is primarily focused on food-safety hazards and does not always provide a quantitative mechanism for prioritizing technological, technical, organizational, and human-related failures that may contribute to deviations in production processes.Failure Mode and Effects Analysis (FMEA) can complement HACCP by evaluating potential failure modes according to their severity, occurrence, and detectability and by combining these parameters into a Risk Priority Number (RPN). Previous studies have demonstrated the usefulness of FMEA for identifying and prioritizing failures in food-production and storage systems [11,12]. Arslan et al. [19] also applied FMEA-based risk analysis to the food cold chain and showed that temperature deviations, equipment failures, transportation conditions, and inadequate monitoring can be systematically prioritized according to their risk significance.The combined application of HACCP and FMEA therefore provides an opportunity to connect food-safety hazard identification with quantitative process-risk prioritization. Lee et al. [10] emphasized the usefulness of applying food-safety management systems together with complementary management and risk-analysis tools, while Glevitzky et al. [24] demonstrated the potential of integrated frameworks that combine HACCP, FMEA, and other risk-assessment methods. Such integration makes it possible not only to identify critical hazards but also to determine which process failures require the highest priority for preventive and corrective action.This issue is particularly important in dairy manufacturing, where product safety and quality depend on the stable control of raw-milk reception, thermal treatment, fermentation, packaging, cooling, maturation, and refrigerated storage. Deviations in raw-material quality, pasteurization conditions, fermentation parameters, equipment operation, hygiene practices, or cold-chain conditions can affect both microbiological safety and product stability. Consequently, effective management requires a systematic approach that links critical control points with the technological and organizational factors capable of causing deviations.From an operational decision-making perspective, risk prioritization is also related to the allocation of limited resources. Food manufacturers must distribute personnel, monitoring capacity, maintenance activities, laboratory control, and financial resources among multiple process risks. Treating all identified risks with the same priority may lead to inefficient use of these resources. Risk-based assessment can therefore support management in directing preventive actions toward the most significant failure modes. The effectiveness of such actions should also be verified using measurable process and food-safety performance indicators rather than only through documented procedures [23,31]. Preventive food-safety measures may additionally reduce losses associated with defective, reprocessed, or disposed products and thereby generate economic benefits [28].Despite the growing use of HACCP, FMEA, and other risk-assessment tools in the food industry, many studies focus either on hazard identification or on the initial ranking of failure modes. Comparatively fewer studies evaluate a complete sequence that includes HACCP-based hazard identification, FMEA-based risk prioritization, implementation of preventive and corrective measures, residual-risk reassessment, and statistical verification of the resulting changes. This limitation is especially relevant for dairy production processes, where several interconnected stages contribute simultaneously to product safety and quality.Accordingly, the objective of this study is to develop and evaluate an integrated HACCP–FMEA approach for risk prioritization in sour cream production. HACCP was used to identify biological, chemical, and physical hazards and determine critical control points, while FMEA was applied to assess process-related failure modes using severity, occurrence, and detection ratings. A total of 18 risk scenarios were evaluated before and after the implementation of preventive, monitoring, and corrective measures. The effectiveness of the proposed approach was assessed through changes in RPN values and verified using the Shapiro–Wilk test, paired Student’s t-test, non-parametric sign test, 95% confidence interval, and effect-size analysis. In addition, changes in product quality, food-safety performance, process-control indicators, and economic efficiency were evaluated to determine the practical effectiveness of the proposed risk-management framework.
2. Literature Review
- Food quality and safety management has increasingly shifted from final-product inspection toward preventive and process-oriented control. Psomas et al. [9] investigated the relationship between quality systems and the competitive performance of food companies and demonstrated the importance of systematic quality management for improving organizational and production outcomes. Lee et al. [10] examined the implementation of food safety management systems together with additional management tools and emphasized that HACCP can be strengthened by complementary methods such as FMEA, HAZOP, Ishikawa analysis, and Pareto analysis. Stoyanova [11] developed a food safety management model using FMEA for the assessment of risks associated with food storage and showed that potential failures can be evaluated before they lead to undesirable consequences. Soltanali et al. [12] proposed a fault-diagnosis and risk-assessment approach for sustainable food production and emphasized the role of risk prioritization in directing improvement activities toward critical failures. Rihawi [13] investigated the impact of ISO 22000:2018 on the performance of food facilities with multiple production lines and demonstrated improvements in operational efficiency, product quality, and compliance following implementation of the food-safety management system.Recent research has also focused on the broader development of food quality and safety management systems. Zhu et al. [14] conducted a bibliometric and systematic review of quality and food-safety management research and identified risk management, quality management, supply-chain resilience, and food-safety practices as important areas of contemporary research. Okpala and Korzeniowska [15] examined quality management in the agro-food industry in relation to food hygiene, safety, quality assurance, HACCP, and associated management processes, emphasizing the importance of maintaining and continually improving food-safety and quality systems. Trafialek and Kolanowski [16] compared the implementation and functioning of HACCP principles in certified and non-certified food businesses and indicated that the existence of formal HACCP documentation alone does not guarantee its effective operation. Kafel and Sikora [17] investigated management-system maturity in the Polish food sector using the ISO 9004 self-assessment concept and examined its relationship with organizational financial performance. Vanichchinchai [18] analysed the relationship between quality management and supply-chain management frameworks and showed that product quality is influenced not only by internal manufacturing activities but also by suppliers, logistics, and other supply-chain processes.The management of risks associated with food storage, transportation, and production has been examined using different forms of FMEA. Arslan et al. [19] applied decomposed FMEA to food cold-chain risk analysis and assessed risks associated with temperature deviations, equipment failures, transportation conditions, and inadequate monitoring. Gianni et al. [20] investigated integrated management systems in the dairy industry and showed the importance of coordinating quality, food safety, operational, and management processes instead of managing them as separate systems. Psomas et al. [21] studied total quality management practices in food companies and associated organizational performance with leadership, employee participation, customer orientation, and continuous improvement. Kourtis and Arvanitoyannis [22] examined the implementation of HACCP in the non-alcoholic beverage industry and demonstrated the application of process-flow analysis, critical control points, critical limits, and preventive and corrective actions for food-safety control. Forte et al. [23] evaluated certified food safety management systems through a risk-based approach and argued that their actual effectiveness should be assessed according to their ability to identify and reduce food-safety risks.The integration of several risk-assessment techniques has received increasing attention in recent studies. Glevitzky et al. [24] proposed an integrated risk framework connecting different assessment tools used in food safety and quality management and demonstrated the potential benefits of combining HACCP, FMEA, and risk-matrix techniques. Kafetzopoulos and Gotzamani [25] investigated the critical factors affecting the effective combined implementation of ISO 9001 and HACCP systems and demonstrated their relationship with organizational performance in food companies. Henson and Caswell [26] examined food-safety regulation from a risk-management perspective and emphasized the need to base regulatory and managerial decisions on scientific risk assessment. Unnevehr and Jensen [27] investigated HACCP as a regulatory innovation in the food industry and showed the importance of moving from final-product control toward preventive process control. In another study, Unnevehr and Jensen [28] analysed the economic implications of HACCP implementation and demonstrated that preventive control can influence both food-safety performance and the economic consequences associated with nonconforming products.Quantitative risk assessment represents another important direction in food-safety research. Lammerding and Fazil [29] studied hazard identification and exposure assessment for microbial food-safety risk analysis and emphasized that the presence of a hazard should be considered together with the probability and degree of exposure. Ross and Sumner [30] developed a simplified spreadsheet-based food-safety risk-assessment tool intended to support practical decision-making and prioritization. Jacxsens et al. [31] proposed food-safety performance indicators for benchmarking the output of food-safety management systems and linked management-system performance with measurable food-safety results. Attrey [32] investigated the role of risk analysis and risk communication in food-safety management and emphasized that risk-assessment results must be effectively transformed into managerial decisions. Ranta et al. [33] applied a Bayesian approach to the evaluation of risk-based microbiological criteria and demonstrated the usefulness of probabilistic methods in supporting microbiological safety decisions.The development of microbial risk analysis has further strengthened the role of quantitative evidence in food-safety management. Fetsch et al. [34] examined modern approaches to microbial risk analysis and emphasized the need to connect microbiological hazards with exposure, probability, and potential health consequences. Sampaio et al. [35] reviewed research on ISO 9001 certification and indicated that organizational benefits depend considerably on how deeply quality-management requirements are incorporated into actual business processes. Terziovski and Power [36] investigated the benefits of ISO 9000 certification from a continuous-improvement perspective and found that internal quality culture and managerial commitment are important for obtaining sustainable results. Bravi et al. [37] analysed the drivers, benefits, and barriers associated with ISO 9001:2015 and emphasized the increasing role of organizational context, interested parties, process management, and risk-based thinking. Rusjan and Alič [38] examined the strategic benefits of ISO 9001 and indicated that quality-management information can contribute to organizational learning and decision-making when it is actively used by management.Quality-management practices in agrifood and food-manufacturing companies have also been extensively investigated. Wilcock and Boys [39] examined ISO 9001 implementation in agrifood firms and identified potential benefits related to production efficiency, supplier relationships, internal management, and market performance. Kim-Soon et al. [40] compared quality-management practices among small, medium, and large food manufacturers and demonstrated that implementation effectiveness may depend on company size, available resources, employee competence, and managerial capability. Gremyr et al. [41] studied the roles of quality departments and their influence on business results and emphasized that quality functions should contribute to process improvement and value creation rather than concentrate solely on documentation and compliance. Boiral [42] critically examined ISO 9000 implementation and showed that certification can sometimes become focused on external legitimacy rather than actual quality improvement. In a subsequent study, Boiral [43] further analysed the symbolic and practical dimensions of ISO certification and highlighted the difference between formal certification and the actual functioning of management systems.The integration of standardized management systems has therefore become particularly relevant for food manufacturing. Bernardo et al. [44] examined the integration of quality, environmental, and other standardized management systems and found that separate management structures may create duplicated procedures, documentation, and resource requirements. Escanciano and Santos-Vijande [45] investigated the reasons and constraints associated with ISO 22000 implementation and identified regulatory compliance, customer confidence, and competitive benefits among the important motivations for adopting food-safety management systems. Susanto et al. [46] developed a quality management system model specifically adapted to food-sector SMEs and emphasized the importance of aligning quality-management practices with the limited resources and operational characteristics of smaller enterprises. Taken together, these studies indicate that effective food-safety management requires the coordination of quality-management principles, risk assessment, operational monitoring, employee competence, and continuous improvement rather than the isolated application of individual tools [42–46].The reviewed literature confirms the effectiveness of HACCP for identifying biological, chemical, and physical hazards and establishing critical control points, while FMEA provides an additional quantitative mechanism for assessing technological, technical, organizational, and human-related failure modes. Studies using FMEA in food production and cold-chain processes demonstrate its usefulness for risk ranking, whereas research on integrated risk frameworks supports the combined application of different assessment methods [10–12,19,24]. At the same time, studies of food-safety performance indicators and quantitative risk assessment show that the effectiveness of preventive measures should be demonstrated using measurable results rather than only through the existence of procedures and documentation [23,30–34].However, despite the considerable number of studies on HACCP, FMEA, food-safety management systems, and quantitative risk assessment, several methodological issues remain insufficiently addressed. Existing studies frequently apply HACCP primarily to identify hazards and critical control points, whereas FMEA studies often concentrate on ranking individual failure modes. Comparatively fewer studies establish a complete analytical sequence in which HACCP-based hazard identification is directly connected with FMEA-based risk prioritization, implementation of preventive and corrective actions, reassessment of residual risks, and statistical verification of the changes obtained. This research gap is particularly important in dairy manufacturing, where raw-material reception, pasteurization, fermentation, cooling, packaging, and storage processes are closely interconnected.Therefore, the present study integrates HACCP and FMEA into a unified risk-prioritization approach for sour cream production. HACCP is used to identify food-safety hazards and critical control points, whereas FMEA quantifies the associated process failure modes through severity, occurrence, and detection ratings. The resulting Risk Priority Numbers are used to identify priority areas for intervention, after which preventive, monitoring, and corrective measures are implemented and the residual risks are reassessed. In contrast to approaches limited to initial risk identification, the present study also statistically evaluates the differences between the risk levels before and after intervention, thereby linking hazard identification, risk prioritization, improvement actions, and quantitative verification within a single decision-support framework.
3. Research Methodology
- The study was conducted using the sour cream production process at “Rojn milk” LLC, Andijan region, Uzbekistan, as the empirical case. The technological process from raw-milk reception to refrigerated storage was examined using process observations, production and monitoring records, laboratory and quality-control results, internal control data, and expert assessments.A multidisciplinary working group involving specialists in quality management, food technology, laboratory control, and production participated in the HACCP and FMEA assessments. The FMEA assessment was carried out by a multidisciplinary expert group consisting of five specialists: one food technologist, one laboratory specialist, two quality managers, and one production specialist. For each of the 18 identified risk scenarios, the experts jointly discussed the available production, monitoring, laboratory, and quality-control information. Severity (S), occurrence (O), and detection (D) were evaluated using a 1–10 scale. Rather than assigning independent individual scores, the experts discussed each criterion collectively and established a single consensus score for S, O, and D for each risk scenario. The agreed scores were then used to calculate the Risk Priority Number (RPN).For decision-support purposes, the identified failure modes were classified into three study-specific RPN priority categories: low priority (RPN 1–99), medium priority (RPN 100–199), and high priority (RPN ≥200). These thresholds were established as internal managerial decision criteria to provide a clear and consistent basis for prioritizing corrective and preventive actions within the investigated production process. Risks with RPN values below 100 were considered manageable through routine operational control and monitoring. Risks with RPN values from 100 to 199 required strengthened monitoring, preventive measures, and closer managerial attention. Risks with RPN values of 200 or higher were treated as priority risks requiring prompt corrective and preventive action. The selected thresholds were therefore used to differentiate the required level of managerial response and to support the allocation of monitoring, maintenance, personnel, and control resources. They were not interpreted as universal FMEA acceptance limits or as regulatory food-safety criteria. Following the implementation of measures including strengthened incoming control, improved monitoring of technological parameters, instrument verification, preventive maintenance, sanitation control, and personnel training, the same 18 risk scenarios were reassessed to determine residual RPN values.The Risk Priority Number was calculated as follows:
 | (1) |
4. Results
- The application of the HACCP approach to the sour cream production process made it possible to identify the stages at which deviations could have a direct effect on product safety. The analysis covered the technological sequence from raw-milk reception to finished-product cooling and storage and considered biological, chemical, physical, technological, and information-related hazards (Figure 1). Four critical control points (CCPs) requiring enhanced monitoring were identified: raw-milk reception (CCP-1), pasteurization (CCP-2), fermentation (CCP-3), and cooling and maturation of the finished product (CCP-4). For each CCP, critical or operational control limits, monitoring procedures, monitoring frequency, and corrective actions were defined based on the technological requirements and internal production specifications applied at the investigated enterprise. These parameters are summarized in Table 1.
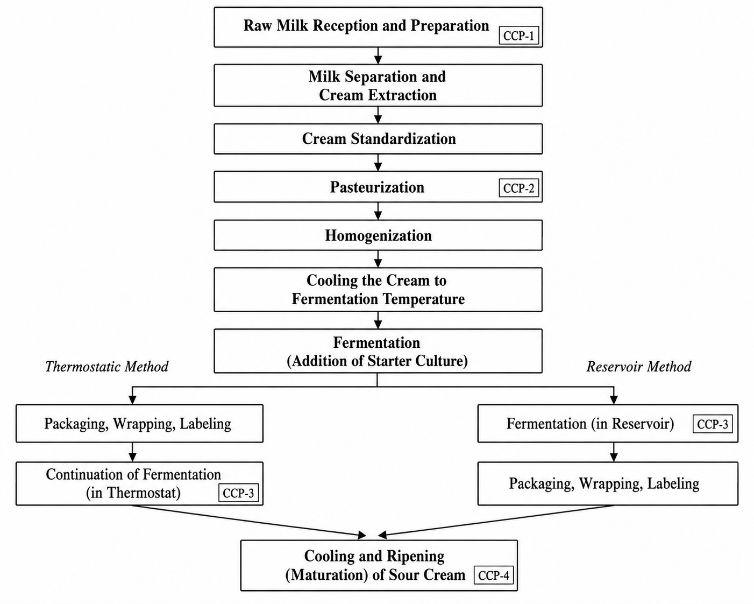 | Figure 1. Technological Scheme of Sour Cream Production and Critical Control Points |
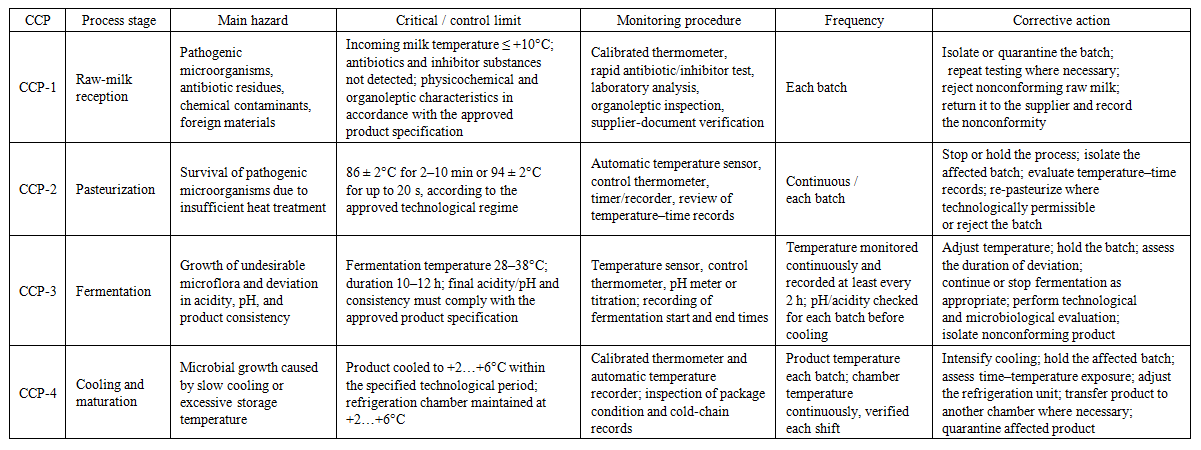 | Table 1. HACCP Critical Control Points, Control Limits, Monitoring Procedures, and Corrective Actions in Sour Cream Production |
|
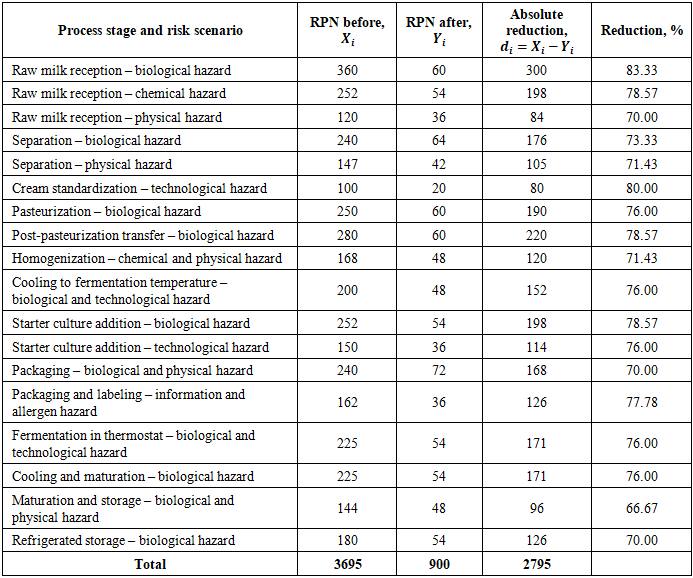
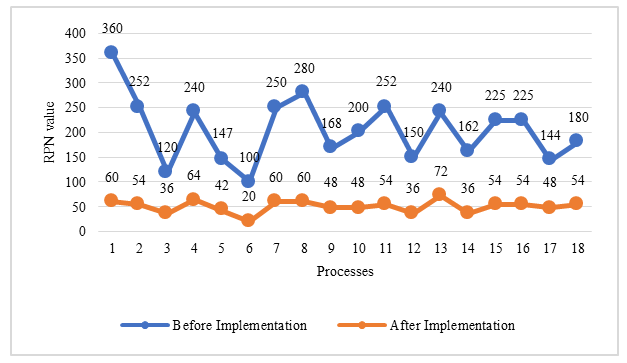 | Figure 2. Comparison of RPN Values for the 18 Risk Scenarios Before and After Implementation of Risk-Reduction Measures |
|
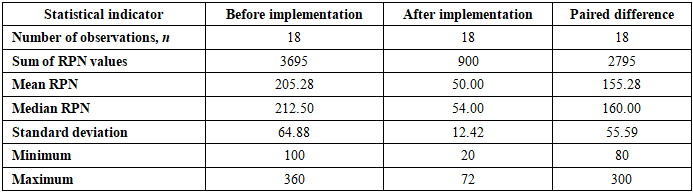
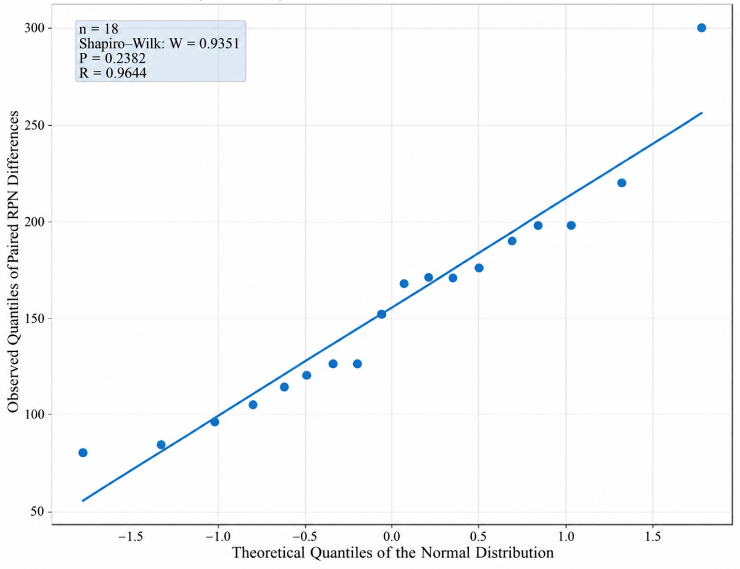 | Figure 3. Quantile–Quantile Plot of Paired RPN Differences for the Assessment of Normality |
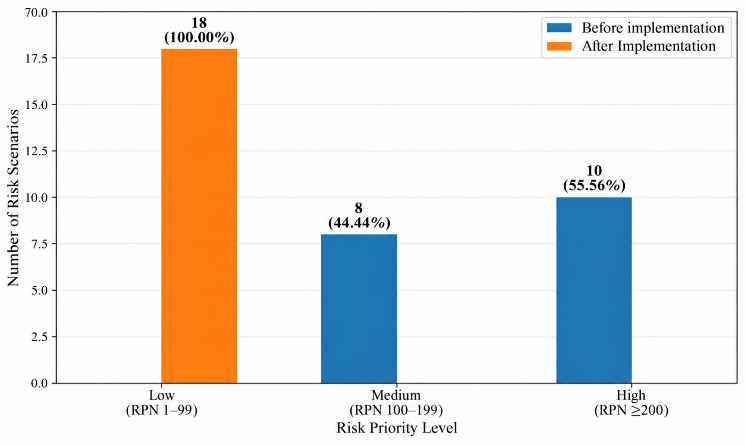 | Figure 4. Distribution of FMEA Risk Priority Categories Before and After Implementation |
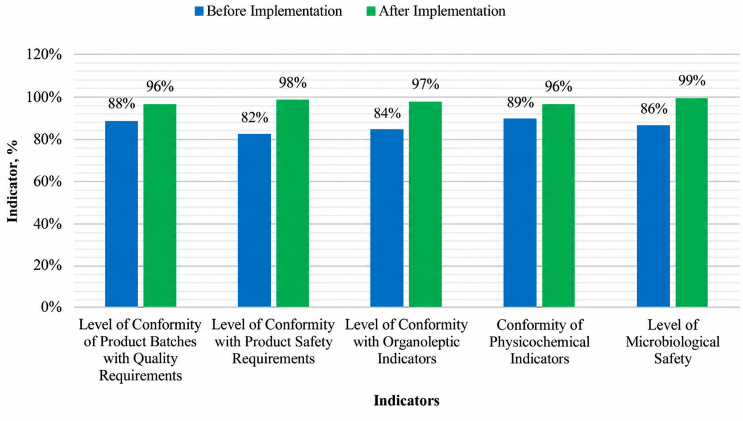 | Figure 5. Comparison of Key Quality and Food-Safety Performance Indicators Before and After Implementation |
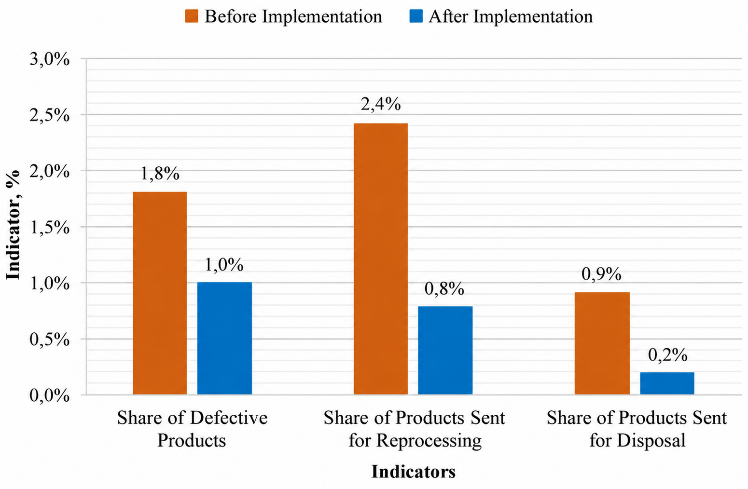 | Figure 6. Changes in Product Nonconformity Indicators Before and After Implementation |
4.1. Economic Efficiency of the Risk-Reduction Measures
- The economic efficiency of the implemented measures was evaluated based on the reduction in defective, reprocessed, and disposed products. After implementation, the defective product rate decreased from 1.8% to 1.0%, the reprocessing rate from 2.4% to 0.8%, and the disposal rate from 0.9% to 0.2%. Thus, total product losses were reduced by 3.1 percentage points. Based on an average daily production volume of 900 kg, an average product value of 17,875 UZS/kg, and 300 operating days per year, the annual gross economic benefit was estimated at 149,613,750 UZS. The total implementation cost was 93,250,000 UZS, resulting in an annual net economic benefit of 56,363,750 UZS. The economic return coefficient was 1.60, the profitability level was 60.4%, and the estimated payback period was approximately 7.5 months. These results indicate that the implemented HACCP–FMEA-based risk-reduction measures were not only effective in improving process control and product safety but also economically feasible.
5. Discussion
- The results confirm that the integrated use of HACCP and FMEA provides a comprehensive approach to risk management in sour cream production. HACCP identified the critical control points associated with raw-milk reception, pasteurization, fermentation, and cooling, while FMEA enabled quantitative prioritization of technological, biological, chemical, physical, and organizational risks. This complementary use of the two methods is consistent with previous studies emphasizing the benefits of combining food-safety management systems with FMEA and other risk-assessment tools [10–12,24].The effectiveness of the proposed approach was demonstrated by a reduction in the total RPN from 3695 to 900, corresponding to 75.64%, while the mean RPN decreased from 205.28 to 50.00. In addition, all 18 evaluated risks were reduced to the low-priority category. Statistical analysis confirmed that these changes were significant and practically meaningful, indicating that the observed improvements were not the result of random variation.The reduction in risk levels was accompanied by measurable improvements in process and product performance. Food-safety conformity increased from 82.0% to 98.0%, microbiological safety from 86.0% to 99.0%, and CCP monitoring completion from 60.0% to 98.0%, while CCP deviations decreased from 15.0% to 3.0%. These findings support previous research emphasizing that the effectiveness of food-safety management systems should be assessed not only through documented procedures but also through measurable operational results [23,31].The proposed risk-reduction measures also generated economic benefits. The decrease in defective, reprocessed, and disposed products reduced total product losses by 3.1 percentage points, resulting in an estimated annual gross economic benefit of 149.61 million UZS and an annual net benefit of 56.36 million UZS. The profitability level was 60.4%, and the estimated payback period was approximately 7.5 months. Therefore, the integrated HACCP–FMEA approach can be considered both operationally effective and economically feasible.Overall, the main contribution of the study is the integration of hazard identification, risk prioritization, corrective and preventive actions, residual-risk reassessment, statistical verification, and economic evaluation within a single decision-support framework. This approach enables food manufacturers to direct limited resources toward the most significant risks and evaluate the effectiveness of implemented measures.
5.1. Limitations and Future Research
- The study was conducted using sour cream production data from a single dairy enterprise over two consecutive six-month observation periods; therefore, the obtained RPN values, process-performance improvements, and economic results should be generalized with caution. In addition, FMEA ratings partly depend on expert judgment, which may introduce subjectivity into severity, occurrence, and detection assessments. Because the present study used consensus-based expert scoring, individual differences among expert judgments could not be quantified statistically. Although observation periods of equal duration and the same sample sizes were used for the before–after comparison and no major operational changes occurred, the observational design cannot completely exclude the possible influence of routine production variability and seasonal changes in raw-milk characteristics.Future research should validate the proposed HACCP–FMEA framework across several dairy enterprises with different production capacities and operating conditions, as well as across other food products. Longer observation periods are required to assess the stability and reproducibility of the achieved risk reductions over time. Future studies should also involve larger expert groups and collect independent individual S, O, and D ratings before consensus discussion to enable formal assessment of inter-rater agreement. The integration of real-time monitoring data for temperature, pH, processing time, and storage conditions may further improve the framework and support dynamic risk-based decision-making.
6. Conclusions
- This study demonstrated that the integrated application of HACCP and FMEA provides an effective framework for identifying, prioritizing, and reducing risks in sour cream production. HACCP enabled the identification of critical control points related to raw-milk reception, pasteurization, fermentation, and cooling, while FMEA provided a quantitative basis for ranking process-related risks and selecting appropriate preventive and corrective measures.The implementation of the proposed measures reduced the total RPN of 18 evaluated risk scenarios from 3695 to 900, corresponding to a 75.64% reduction, while the mean RPN decreased from 205.28 to 50.00. All evaluated risks were ultimately transferred to the low-priority category, and statistical analysis confirmed that the observed reduction was significant and practically meaningful.The improvement in risk control was accompanied by better product and process performance. Food-safety conformity increased from 82.0% to 98.0%, microbiological safety from 86.0% to 99.0%, and CCP monitoring completion from 60.0% to 98.0%, while the proportion of CCP deviations and nonconforming products decreased. These results indicate that the proposed approach improved both preventive control and the stability of production processes.The economic assessment also confirmed the practical feasibility of the approach. The reduction in defective, reprocessed, and disposed products generated an estimated annual gross economic benefit of 149.61 million UZS and an annual net benefit of 56.36 million UZS, with a profitability level of 60.4% and a payback period of approximately 7.5 months.Overall, the proposed HACCP–FMEA framework integrates hazard identification, risk prioritization, preventive action, residual-risk assessment, statistical verification, and economic evaluation within a single decision-support process. The approach can therefore serve as a practical tool for improving food safety, process reliability, and resource allocation in dairy manufacturing.
ACKNOWLEDGEMENTS
- The authors gratefully acknowledge the management and staff of “Rojn milk” LLC for their support in conducting the practical study, providing access to the sour cream production process, and assisting with data collection. The authors also thank the specialists and experts who contributed to the HACCP and FMEA risk assessment and evaluation of the study results.
DISCLOSURE
- The authors declare that they have no known financial or personal conflicts of interest that could have influenced the work reported in this study. No commercial organization had any role in the design, analysis, interpretation, or reporting of the research.