Emmanuel Siyawo Mvere1, Devkumar Shahill Callychurn1, Dinesh Kumar Hurreeram2
1Mechanical and Production Engineering Department, University of Mauritius, Moka, Mauritius
2University of Technology Mauritius, La Tour Koenig, Pointe aux Sables, Mauritius
Correspondence to: Emmanuel Siyawo Mvere, Mechanical and Production Engineering Department, University of Mauritius, Moka, Mauritius.
| Email: |  |
Copyright © 2024 The Author(s). Published by Scientific & Academic Publishing.
This work is licensed under the Creative Commons Attribution International License (CC BY).
http://creativecommons.org/licenses/by/4.0/

Abstract
The Republic of Mauritius has been generating some 1100 tons of Used Lead Acid Batteries (ULABSs) annually, and it keeps on increasing over the years. This can be very damaging and risky to the environment and the community at large. This research considers the practical scenario of a near optimal reverse logistics network of Hazardous Waste (Used Lead Acid Batteries (ULABs)) in the country. To the best of our knowledge for two decades now, there has not been enough research about the level of lead poisoning contamination from the ULABs in the Mauritian environment. Research or efforts to cautiously eliminate ULABs, which are one of the main causes of lead poisoning, are missing in literature. A heuristic solution technique, an Integer binary linear program that solves the Uncapacitated Facility Location Problem (UFL) is developed. It is used to develop a near optimal reverse logistics network to facilitate the simulation of optimal siting of ULAB collection facilities. The formular of the UFL problem is extended with the Euclidean distance formula thus replacing the use of the common and laborious distance matrix, to the use of GPS co-ordinate point input. To the best of our knowledge all known prior algorithms solving the UFL problem, k-median and p-median problem used the input of a distance matrix. A real-world case in which the newly developed algorithm solution is simulated using real world data, while an actual realistic instance is created and used while the results are illustrated using ArcGIS maps, is the main contribution of this paper. It has proved useful in establishing a near optimal reverse logistics network for ULABs.
Keywords:
UFL problem, TSP problem, P-median problem
Cite this paper: Emmanuel Siyawo Mvere, Devkumar Shahill Callychurn, Dinesh Kumar Hurreeram, The Near Optimal Siting of Hazardous Waste (Used Lead Acid Battery (ULAB)) Collection Facilities in the Republic of Mauritius Using the ESMVERE CPLEX UFL Problem Solver Algorithm, American Journal of Operational Research, Vol. 14 No. 1, 2024, pp. 12-27. doi: 10.5923/j.ajor.20241401.02.
1. Introduction
The Republic of Mauritius generates 17,000–18,000 tons of Hazardous Wastes (HW) annually as per the hazardous waste inventory study [12], of which ULABs constitute 1100 tons. The annual 1100 tons of ULABs that are generated each year are a very dangerous health risk to the community and the environment if they are not safely collected and properly disposed. Public awareness of the risks of environmental damage and the health risks of lead exposure is needed in every society. Innocent users might not even be aware of the dangers of, and the harmful risks of handling a leaking ULAB or of the long-term storage of ULABs. Lead poisoning can cause liver and kidney damage, anemia, retardation, brain damage, hyperactivity, hearing loss and even death in children [21]. A long distance to collection facilities increases the risk of spillage or leakage to the environment and increases the risks associated with long term storage. If there is no ULAB collection facility nearby, users store the dangerous waste in their garage, or in the back yard for the whole year, where children might play with the harmful ULABs. The Basel Convention classifies ULABs as a hazardous waste [21]. Section 75(1) of the Environmental Protection (Hazardous Waste Standards) Regulations 2001 of the Environmental Protection Act 1991 of the Republic of Mauritius, provides that no individual shall use, store, transport or otherwise deal with hazardous waste except when that hazardous waste is stored in a container or package - (a) built and constructed to prevent spillage or leakage into the environment (b) materials from which the waste is not susceptible to attack or which are liable to form harmful compounds with the waste; and (c) materials from which the waste is not susceptible to attack; and (d) materials designed to ensure safe, full or partial emptying of the waste [15]. The law has provisions to ensure the safety of the environment and reduces the pollution that results from the handling of all hazardous waste, including ULABs. However, the absence of an appropriate collection system does not help in the enforcement of the regulation.A vehicle battery is not a biologically degradable product. ULABs contain lead, lead oxide, Sulphuric acid and plastic products [18]. The lead storage battery cell consists of alternate lead plates coated with lead dioxide (anode) and lead (cathode) immersed in sulfuric acid solution electrolytes [7]. A chemical reaction releases electrons during discharge, allowing them to flow to create electricity through conductors. The electrolyte acid interacts with the materials of the plates when the battery discharges, moving their surface to lead sulphate. The chemical reaction is reversed when the battery is recharged: the lead sulphate turns into lead dioxide and the plates are returned to their original state [6].The atrocious dangers and the adverse health problems associated with ULABs developed the need to study where and how they are being disposed of, in the Republic of Mauritius, to reduce or eliminate the contamination of the environment, and to avoid the harmful health effects associated with lead exposure.Thus, the following objectives were formulated for this research study:1. To investigate the disposal of ULABs in Mauritius. 2. To investigate the impact of the disposal of ULABs on the Mauritian environment. 3. To model the collection of ULABs for the purpose of exportation. 4. To develop a model of reverse logistics that utilizes the Uncapacitated facility location problem to locate collection points for ULABs.
2. Literature Review
2.1. The Impacts of Lead Exposure from ULABS in the Republic of Mauritius
[17] conducted a survey of population exposure to vehicular lead. To evaluate the lead burden of the Mauritian population, 312 people were chosen as selected occupational and residential subgroups for preliminary sampling. Blood samples from these individuals showed a high blood lead in certain population groups in Mauritius, such as traffic policemen, paint sprayers and petrol station attendants, with levels averaging 12-15 mcg dl ^(-1) [17]. There were very high blood lead results detected in the vicinity of a lead battery factory on the outskirts of the capital city Port Louis in which 4 children living adjacent to the battery factory were found to have blood lead in the range 30-66 mcg dl ^(-1) [17]. This survey proved the dangers that some members of the population were facing due to the ULAB contamination, 30-66 mcg dl ^(-1) is very high and at a level harmful to the developing brain of young children. Following the high blood lead found, the four children were admitted to hospital for chelation therapy. Since [17] there is a wide gap in research and not much data on the subject. Journal articles and reports on this danger are scarce.
2.2. Uncapacitated Facility Location Problems
The Uncapacitated Facility Location Problem (UFL) is operational research, or a location science problem in which the objective is to locate a set of facilities in the optimum locations. The optimum locations are those that achieve the minimum cost of opening the facilities for the whole set of facilities, and locations that also minimise the distance to the nearest open facility for the whole set of clients.In the UFL problem, a set of potential facility locations are given, F which is a set of potential collection points for used up or failed vehicle batteries, each facility or collection point i is an element of the larger set of facilities i∈F, with a facility opening cost fi, a set of clients C which is a set of people with used up or failed vehicle batteries that need to be collected and a metric space d over F∪C, which unites the set of facilities and the set of clients on a measurable distance. The objective of the (UFL) problem is to jointly, simultaneously, minimize the sum of the opening costs of the facilities AND to minimize the sum of the distances between each client and its closest open facility. It is termed an Uncapacitated problem because there is no restriction on the number of clients connected to a single facility [2]. The metric space d is analogous to the bipartite graph G and the bipartite space (F, C), where F is the set of facilities, and C is the city or client set [10]. There is always an assumption, except when otherwise specified, that a metric can be formed from the distances this is also often referred to as the metric UFL, that means the distances are symmetrical and meet the triangle inequality [20].The objective function is to open F’, the set of open facilities and assign each client to an open facility such that the amount of the total opening cost of the facilities and the total assignment costs of clients to facilities is brought to a minimum [11]. A solution to the UFL problem is characterized by a set of open facilities, once the set of facilities to open is determined it becomes trivial to assign the clients. All the clients are just assigned to their nearest open facility.The problem is finding the subset F’ ⊆ F of the facilities to be opened, and the function φ: C → F’ of the facilities to be opened, such that the overall cost of opening facilities and linking clients to open facilities is minimized [9]. An instance of UFL could have different opening costs for all the potential facility locations thus the objective is to find the minimum cost set, the lowest value set from a set of potential facility locations, while simultaneously considering the minimum cost set, the lowest value set from a set of connections that involve distances from every client its nearest open facility.
2.2.1. Notations
i is used to denote a potential facility location. A potential facility location is a location on which a facility can be located to achieve an optimum cost and an efficient distribution of the facility’s resources.j is used to denote a client. A client is the area which needs or requires the services of a nearby facility. It can be a city, region, a society or an individual customer.xij is a decision variable which denotes whether facility i is connected to client j or not. xij is a binary variable, which becomes 1 if facility i is connected to client j or 0 if facility i is not connected. Being connected means the client receives its services from the open facility.yi is a decision variable which denotes whether facility i is open or not. yi is a binary variable, which becomes 1 if facility i is open to receive clients or 0 if facility i is not opendij denotes the distance from client j to facility i. The distance determines the cost which must be minimized. The distance is only a significant cost if the facility i is open and connected to client j, that is if xij is 1.F is the larger set of potential facility locations. The goal is to open the best located set of facilities, which serve all the clients with a minimum cost. The best located set of facilities is chosen and opened from the larger set of potential facility locations. There is the choice to select the best located, open them, and let the rest remain closed.C is the set of clients. All the clients must be served. All the clients must be connected to its closest open facility. Unlike facilities where there is a choice to select the optimum located, open them, and let the rest remain closed.F’ is the set of open facilities. This is when the best set of facilities is chosen and opened from the larger set of potential facility locations.fi the costs of opening facility i. The facility opening cost is one of the variables that determines the final value of the objective function. The objective is to minimize the sum of the facility opening costs.
2.2.2. Mathematical Formulation of the UFLP Model
The formulation of the metric UFL problem as an integer program proposed by [9] is the same as equation 1-5: | (1) |
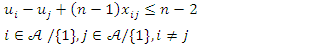
Subject to the constraints:  | (2) |
 | (3) |
 | (4) |
 | (5) |
The scope of the UFL problem for this study is nationwide, the ULABs need to be safely collected from everywhere in the republic of Mauritius. There is a need to optimally locate ULAB collection facilities efficiently near all the potential clients who would want to dispose them. The reason is to cover all the clients efficiently. Due to the complexity and the combinatorial nature of the UFL problem, the problem is NP-hard which implies that if P≠NP there is no algorithm known, which can find an optimal solution in polynomial time. The most common approach to overcome this difficulty, known as approximation algorithms, is by relaxing the requirement of finding optimal solutions [13]. Instead, one can only hope to efficiently find a good approximate solution, one that is not optimal, but is within a small factor away from optimal [19]. Many of these problems in optimization turn out to be computationally intractable, so a rational strategy is to settle for approximation algorithms, that is, algorithms that run in polynomial time and always have known near optimal possible solutions [20].
2.3 The Gap is in the Real-World Application of the UFL Algorithm
The gap in existing literature is in the real-world application of the theoretical UFL algorithm. Many of the UFL algorithms have not yet been applied to realistic, real-world scenarios. The real-world application has multiple factors that might alter the approximation factors of these algorithms per instance. The main reason for solving the metric facility location problem is to serve a set of clients or cities by opening facilities in optimum locations, the optimum locations being those that achieve a minimum cost at opening and serving all the clients. To the best of our knowledge all known prior methods are targeted to achieve the fastest, most efficient, and optimal method of solving the computationally intractable UFL problem using a distance matrix as data input in their calculation. However, as close to the approximability lower bound [8] of the UFL problem the algorithms may achieve, which is approximately the closest level ever possible to an optimum solution, practical examples are missing and still needed for the real-world application of the algorithms. Case studies in this field are scarce and very rare.Instance creation is somewhat easy when instances are created artificially, or when they are generated randomly using software. However, when this is done on a practical scenario, a lot of unforeseen complications may unravel. The algorithms are effective when they are applied to an instance which has already been created, the bipartite graph G with bipartition ( ,
,  ), where
  is the set of facilities and
  is the set of cities [8]. However, in the real world this instance is not yet created. This could be one of the most time-consuming and complex steps in solving this problem practically.Cases in which these algorithms have been used to solve real world problems, and in which they have been analyzed confronting the real challenges in the world and achieving satisfying results that prove their guarantees are missing. The application of these algorithms in a real-world setting will achieve more in terms of revealing the limitations and boundaries of the algorithms. When they are analyzed from the basis of reality a further extension of the qualities of the algorithms may give way, and be revealed, this gives a chance for modifications and improvement.When solving the problems practically this instance has got to be created, and for the algorithms to work on the instance, the instance would have to fit the model and the assumptions under which the algorithm was developed. This could give rise to cases were an instance might be too complex to develop accurately to solve the problem. The choice of data which constitutes the set of facilities and the data which constitutes the set of clients in a real-world environment must be carefully determined from multiple possible of choices to accurately solve the problem. The worst-case analysis might prove to have an even worse case where an instance cannot be created for the specific case, thus the need for worked solutions. Appendix C to E displays the journey that was taken to create the right instance using ArcGIS.
2.4. Contribution of the Euclidean Distance Formular to the UFL Problem in CPLEX Opl
To the best of our knowledge, all known prior algorithms use the input of a distance matrix, as input in the calculation. The removal of the distance-matrix in the calculation is the main difference between the model solution developed to solve the UFL problem in this case, and all known prior methods of solving this problem. For example, [5] use the distance matrix below (a), in a small nine warehouse example. Even in their short example, to ensure that the distance of each point to the other remaining eight points is combinatorically considered, is a big combinatorial task. This becomes even more complex when you must gather the data between all possible combinations of distances, for example if there are 50 locations: From the first location we label it L 1 to the last location L 50L 50 -> 249 lists all the possible pairs L 49 -> 248 lists all possible pairs (same as above, excluding L 50)249+248+…+20=250–1Continue with this to the last location L1 then add them up we have 1.1258999e+15 location distances to place in a distance matrix. This is somewhat easy when it is randomly generated by software, however, in real world practice this is extremely complex. Below is a distance matrix of only 9 locations.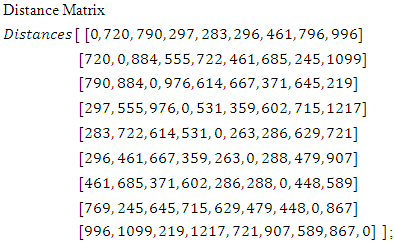
 (a)This would be impractical in many cases in the real world where there might be hundreds or thousands of location points, and the distances that make each pair of distances. Thus, a new model is developed that does not need the input of the distance matrix but uses the formular for the Euclidean distance between two points and the input of actual GPS coordinate location points to solve the UFL problem. The formular for the Euclidean distance between two points is:
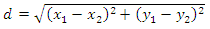
 (b)The Esmvere UFL Cplex Opl Euclidean distance formular developed for this study
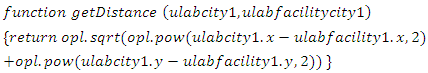
 (c)The new method solves the UFL problem by making a choice between 7 facility locations and 125 client locations, without considering the distance between all the points as a distance matrix. The newly developed method only requires the GPS coordinate location points. This means that it opens the best out of 7 potential facility locations and assigns only 125 clients to these open facilities per calculation. It is a heuristic solution technique, an Integer binary linear program with binary variables that solve the UFL problem in small cases. The new method could also be a useful contribution in UFL approximation algorithms, where it could contribute to a faster approximation algorithm for the UFL problem.
3. Methodology
To achieve the first two objectives, quantitative research, which sought to describe the existing structure and network of the ULAB life cycle, from the importation to the disposal was chosen. Numbered data was analysed using statistical procedures and techniques. The results showed that 55% of the respondents strongly agreed that there is a need to develop a new collection system. Survey research was conducted which involved raw data collection and statistical analysis on published health data from the Mauritius Institute of Health and Metrics Evaluation.There were also some qualitative findings from the face-to-face interviews, which were compared and analysed. An unsafe, market controlled, nationwide, yearly collection system was found to be in place and mentioned by many respondents to the survey. Respondents strongly agreed that the collection system in place is not safe and risks the lives of the employees collecting them and their families. The public is also at risk from the yearly in-house storage before the collection and exportation. Members of this industry disclosed that the public is not informed of the dangers of this industry, thus there is a lack of public awareness. During face-to-face interviews and in the questionnaires, many members of the automotive industry and those of the health industry disclosed the need of a new and a safer system for the collection of ULABs. The first two objectives of this study established the mandatory need to model a new and a safer system for the collection of ULABs in the republic of Mauritius. ULAB collection points being a type of facility, the third and fourth objectives of this study sought to model the collection of ULABs for the purpose of exportation, and “more specifically” to develop a model of reverse logistics that utilizes the Uncapacitated facility location (UFL) problem to locate collection points for ULABs.
3.1. Mathematical Formulation of the New Solution UFL Model
Prior work on the Travelling Salesman Problem (TSP) Opl model by [4], and the p-median problem Opl model by [5] was combined, modified, and reconstructed to invent a new UFL software model. An experimental software analysis of [4] revealed the similarity in the objective functions and the constraints of the TSP, p-median and UFL problems. This lead to a deeper analysis of the objective functions and the constraints of these three problems in the CPLEX Opl programming language. The formulation of the equations 1-16 show changes that were made to the TSP and p-median formulation to develop a UFL formulation in CPLEX Opl which combined the two formulations. This eliminated the subtour elimination constraint of the TSP and changed the non-negativity constraints. However, the functionality of the TSP by [4], which required the use of the Euclidean distance formular was then usable when solving the UFL problem.The mathematical formulation of the TSP problem, as cited from [4] is: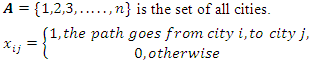 | (6) |
 | (7) |
Subject to the constraints: | (8) |
 | (9) |
 | (10) |
In general, the objective of the UFL equation (eq1) involves the summation of the opening costs of the facilities added to the summation of the total distances, from each client to the open facility nearer to it .The TSP equation (eq7) only carries the summation of the distances from one j client to the nearest client i. The opening costs are not part of the calculation. Thus, for the TSP, the medium equation of the lower limit of the summation of the distances must specify that the starting point j is a client but is not the same as or is not equal to the ending point client i . Otherwise, that would be the shortest distance from j to i on the same point. Thus, it is specified in the lower limit of the summation of the TSP objective as **(j≠i). The removal of this equation in the CPLEX Opl code is a first step when converting a TSP algorithm to a UFL algorithm.In the objective function of the UFL equation (eq1) there are two separate sets of location points  where
where  is an element of the set of Facilities
  and
and  is an element of the set of client location points
  . While for the TSP problem (eq7) there is only one containing set of location points
  where
where  is an element of the set of start points location for the path of an edge and
  is an element of the set of the end point locations of an edge. These are all contained in the same set of locations
  however in an iteration the same location picked for the beginning point of an edge, node or path cannot be the same location picked for an ending point of the same edge at the same time, there would be no distance, “zero distance” because it starts where it ends**(j≠i). Thus, the objective is to derive the shortest possible distance that runs through all the locations from all the edge distances, these being in the same set. The observations above lead to an experiment in which the Location set A, of the TSP by [4], in which
  was separated into two arrays that conform to the UFL problem. Location sets
  in which
  are on Figure 2 renamed to ulabfacilitylocation for
  while the array
  is labeled ulabcitylocation.The first constraint of the UFL problem (eq2), which states that every client must be connected to a facility, is comparable to the first constraint of the TSP (eq8) which states that every starting point location must be connected to an ending point location. From the similarity and the prior changes made to the sets of location points, it is possible to convert these constraints to the other in the CPLEX Opl language.The second constraint of the UFL problem (eq3), which states that every client must be connected to an open facility, is comparable to the second constraint of the TSP (eq9) which states that every ending point location must be connected to a starting point location which simply reverses the same connection as the first connection . Thus, for the TSP every starting location point in the set must be connected to its closest location ending point while each location ending point must be connected to a starting point through all the locations in the set. The TSP subtour elimination constraint (eq10) is completely removed when converting an algorithm to the UFL problem because it is not relevant or applicable in this case. Thus, remaining only, the non-negativity constraints (eq4) and (eq5) can be included. The similarity in the calculation is that both the UFL and TSP seek to minimize the distance between location points. Thus, from the similarity and the prior changes made to the sets of location points, it is possible to convert these constraints either way as algorithms in the CPLEX Opl language. Arrays of the facility locations and opening costs were added, these enabled the costs of the edges to be computed from each facility to each client. The changes have developed an entirely new software solution to the UFL problem.The mathematical formulation of the p-median problem is [5]:
 | (11) |
Subject to the constraints: | (12) |
 | (13) |
 | (14) |
 | (15) |
 | (16) |
In the objective of the p-median problem equation (eq11) there are two separate sets of location points  where
where  is an element of the set of Facilities
  and
and  is an element of the set of client location points
  Thus, the objective of the p-median problem equation (eq11) and that of the UFL problem equation (eq1) are identical in that respect. The two objectives differ in that the objective function of the UFL equation (eq1) involves the summation of the opening costs of the facilities added to the summation of the total distances from each client to a facility nearer to it, whereas the p-median (eq11) only considers summation of the total distances from each client to a facility nearer to it. However, in this special case by [eq2] they include the demand from each client. The demand in the case of ULABs is unknown as this is the first time that this project is proposed hence in this case it is irrelevant, hence it is removed from the objective of the p-median in CPLEX Opl. Thus, the remaining are the variables are
  which calculate the total distances from each client to a facility nearest to it, and the decision variable
  which indicates if a facility is open or not.The first constraint of the UFL problem (eq2), which states that every client must be connected to at least 1 facility, is comparable to the first constraint (eq12) for p-median which also states that every client must be connected to a facility. The second constraint of the UFL problem (eq3), which states that every client must be connected to an open facility, is comparable to the second constraint (eq14) of the p-median which states the same. They are identical in that if a client is connected to a facility the decision variable
  then that facility must only be open
  Thus, in both cases the client cannot connect to a closed facility because a facility only opens if it is in the minimized solution set of facilities.The remaining constraint for the p-median equation (eq13) is not relevant to the UFL problem. This constraints force the p-median exactly p number of facilities. Thus, a solution can be developed which combines the p-median and the TSP problem solution algorithms developed in CPLEX Opl and converts part of their code to produce a UFL problem solution.The p-median constraints where then modified to suit the UFL constraints as shown in Appendix A. Array of opening costs was then added to the data as fi=[…] as shown in Figure 2, to conform to the UFL Problem. Appendix A shows the newly developed algorithm that draws from the data file on Figure 2.
3.2. The ESMVERE CPLEX UFL Model
This section tests this solution for accuracy and efficiency in locating facilities, or in the design of a facilities network.To test the solution model for accuracy, an instance of the UFL problem, a diagram was used, Figure 1. The x and y coordinates of the clients and facilities were plotted and measured on all the points on plane to produce the data on the diagram Figure 2 which shows the arrays of these coordinates. The instance hosts 7 potential facility locations and 21 clients. Although in the diagram the potential facility locations are displayed with different colors. The meaning of this is trivial in this case, as it is just displayed to describe an instance with a solution in that section. 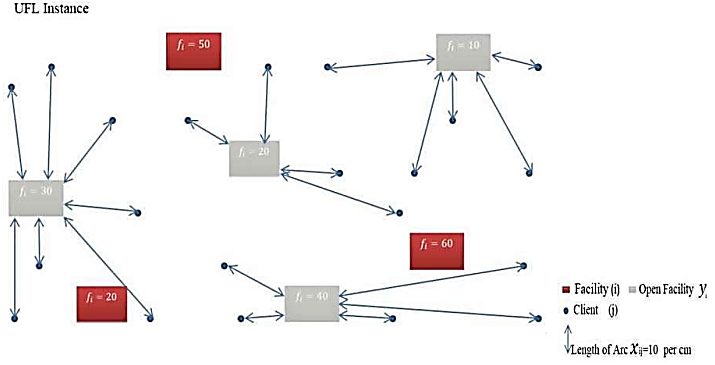 | Figure 1. UFL problem instance |
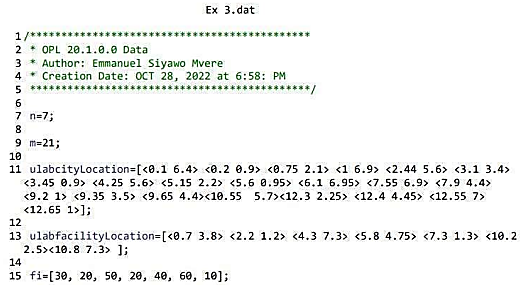 | Figure 2. Prototype data |
However, in this case it is now used again to compute the solution to the data instance diagram as Figure 2. The potential facilities in this example diagram are read from the left to the right as facilities 1,2,3,4,5,6 and 7. These facilities are displayed with opening costs of 30, 20, 50, 40, 60 and 10 respectively. The clients, also called the cities or in this case called the (ulabcities), are displayed on the diagram as small dots. The clients are also read from the left to the right; however, they are 21 clients that are identifiable with their x and y coordinates.The diagram, Figure 2 displays the CPLEX data file, which contains the data values which have been input manually to test the application. The value of  the number of (ulabfacilities) is 7 in the test case, and the value of
  the number of ulabcities is 21 in this test case. It also contains the values of the two arrays, ulabcityLocation and ulabfacilityLocation which host the
  and
and  coordinates of ulabcity locations and ulab collection facility locations. To develop the test coordinates an x axis and a y axis were placed on a printed copy of the diagram using a 30-centimeter ruler.It also contains the values of the array
  in which is the input of the opening cost values of the ulab collection facilities. The facility opening costs are given on the diagram for the 7 facilities read from the left to the right as [30, 20, 50, 20, 40, 60, 10]. Thus Figure 2 is the data from the diagram on Figure 1 after it has been entered manually in the data file to compute the solution.Diagram Figure 3 displays the solution to the decision variable
  After running the data on Figure 2 in the CPLEX Optimization Engine, the solutions to the decision variables are displayed as on Figure 3. On the left half side of the diagram the CPLEX Engine displays a Solution with objective 108.882, this is the minimum cost solution of the UFL Problem calculation.
 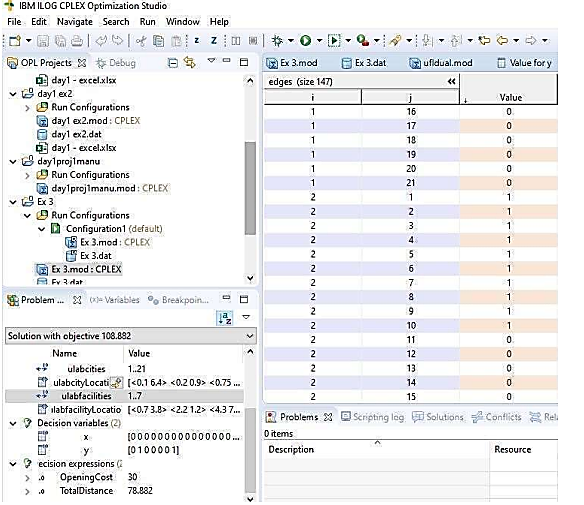 | Figure 3. Variable x |
On the lower left half of the diagram is displayed the minimum opening cost OpeningCost of 30 and the minimum TotalDistance of 78.882 centimeters. The solution to the decision variable  is displayed on the right half of the diagram Figure 3. This side displays a list of all the edges
  This displays edges (size147), meaning in combination there are 147 edges between the facilities and the clients. Thus, from all the possible combinations of edges, after the calculation, the least cost edges, edges that give a minimum distance when connected to clients, are displayed with Boolean values of 1, while connected to the open facility. The edges which are connected to open facilities have Boolean values 1 and those not connected display Boolean values 0. Figure 3 displays how the cities 1 to city 10 are connected to the open ulabfacility 2. All the cities in the solution are connected to only 2 open facilities which are facility 2 and facility 7. Thus, the remaining ulabcities, 11-21 are connected to ulabfacility 7.The diagram Figure 4 displays the solution to the decision variable
  . The solution to the decision variable
  is displayed on the left half of the diagram Figure 4 as an array with seven numbers or seven locations
  Thus
Thus  is a boolean decision variable, which places a 1 on an open facility and a 0 on a closed facility. Thus, the solution in Figure 4 opens the ulabfacility locations 2 and 7.
 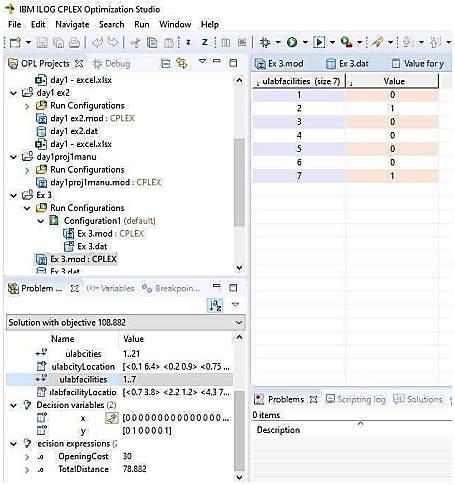 | Figure 4. Variable y |
This clearly is a minimized set of open facilities, as the facility opening costs of facility 2 is 20, whereas the facility opening cost of facility 7 is 10 thus an optimum minimized solution of 30 for the Total OpeningCost of the facilities in the test case. The solution to the decision variable  is also displayed on the right half of the diagram Figure 4. This side displays a list of all the facilities
  , this displays ulabfacilities (size7), meaning there are 7 facilities listed down from facility 1 down to facility 7. The corresponding boolean value of the facility is displayed to the right side as either a 0 or a 1, for a closed or open facility respectively. The right half of the diagram Figure 5 displays the list of each edge, this displays edges (size147) and its value value in terms of its size or distance to the facility it is connected to. This is a list of all the possible combinations of distances from the ulabcities to the ulabfacilities.
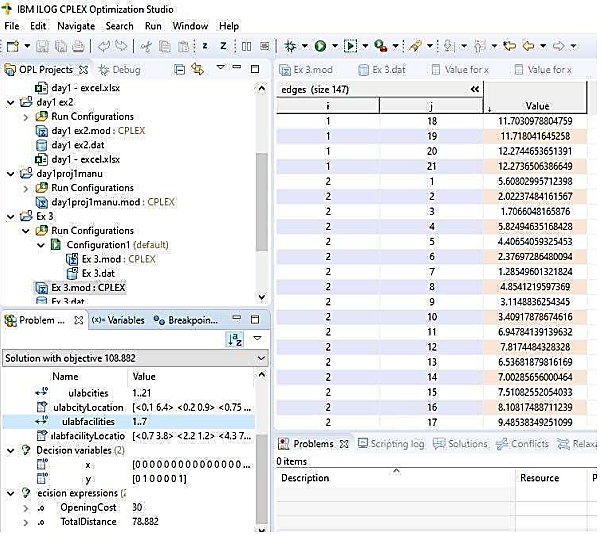 | Figure 5. Cost of each edge |
This value is critical in the calculation of the distances, to the point of the selection of the minimized cost set of distances from the clients to the facilities, which then results in the solution of which set of facilities to open. This is a very high level of accuracy as also evidenced by the values of each edge given on the diagram Figure 5.
4. Results and Discussions
This chapter gives evidence of the usefulness of the newly developed software model. The model is used in the real world, on a practical case to develop the ULAB collection network in the republic of Mauritius. The solution proves how it guides management in selecting the optimum locations to place the ULAB collection facilities, while minimizing all the costs and distances.
4.1. Results
4.1.1. Sensitivity Analysis
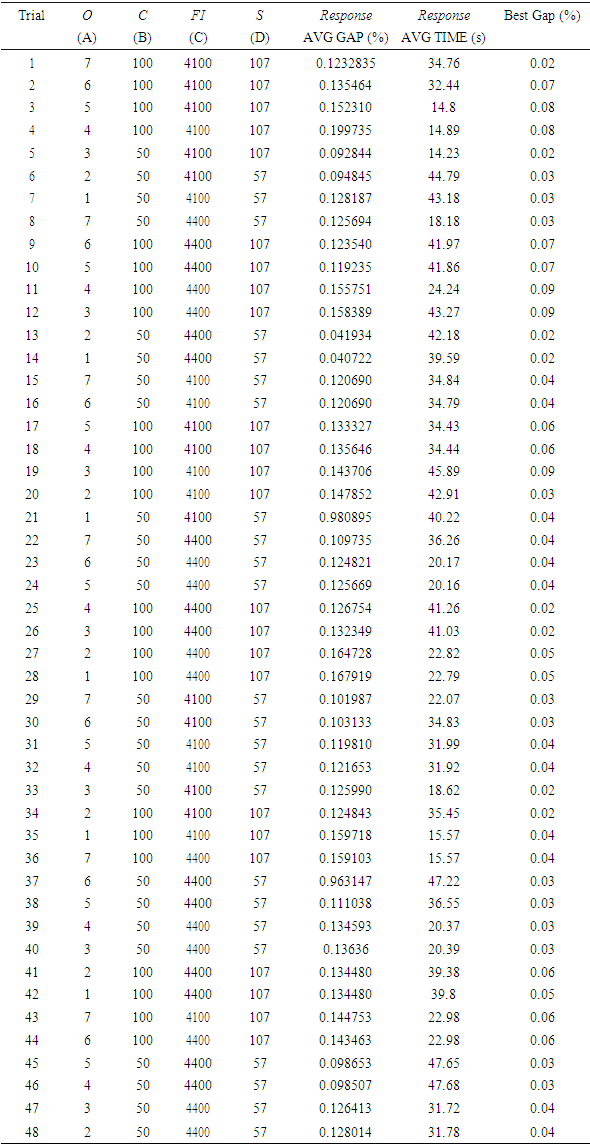
The quality of the algorithm in terms of worst-case analysis and computation, time, were tested. The initial software used to develop the algorithm developed for this study had a limitation on instance input size, it was only reliably usable in cases where there were 7 Facilities and 125 clients. This meant that it opened the best out of 7 potential facility locations and assigned only 125 clients to these open facilities per calculation. This limitation was with IBM ILOG CPLEX Optimization Studio 22.1.2 community edition. The MED set of instances were used to test the algorithm in small cases as well as in large international test cases. The response variable AVG GAP (%) is the average gap of 30 different independent runs compared to the optimal solution obtained with CPELX Opl for the generated small case test problem [16]. The response variable AVG TIME is the average execution time for the 30 independent runs [16]. To allow a direct mapping and a clear visual comparison of the performance of the algorithms developed for this study compared to the [16] a total of 1440 trials were performed.The number of clients and the size of the instance affect the running time. If an instance has many clients ( C ) or a size larger than 107 this affects the execution time. The AVG TIME shows that the number of open facilities (O) must be higher than three.
Table 1
 |
| |
|
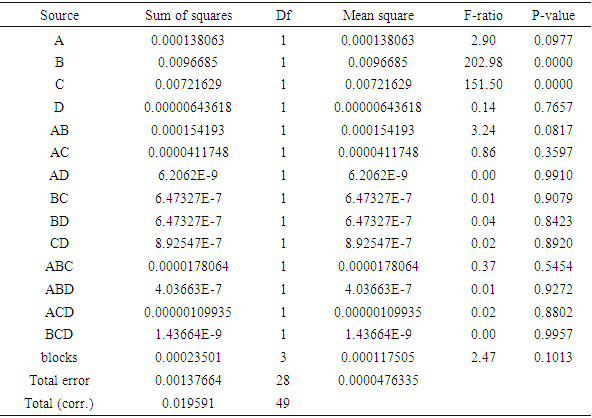
The ANOVA results of the response AVG GAP (%) show that parameters C and Fi are the only statistically significant parameters. To find the best parameters for the algorithms, we focus on the response AVG GAP (%) [16]. The best parameter settings on 0, C, Fi and S, according to AVG GAP(%), are 3, 50, 4100 and 107, for the ESM UFL respectively. C and Fi prolong the computation time.
4.2. Analysis of Variance
Table 2
 |
| |
|
The MED set of instances from [16] [1] [3] [23] are compared and used to analyze the quality and performance of the ESMvere UFL algorithm on the larger cases. The sets contain 18 large-scale problems used by [3] in the context of UFLP. IBM ILOG CPLEX Optimization Studio 22.1.2 Developer Edition was to test and compare the performance of the algorithm in larger instances used, which has no input size limitations. This enabled the algorithm to solve larger instances of sizes, up 1000 facilities and 3000 clients. ESMVERE CPLEX UFL compared to the MED set of instances [23]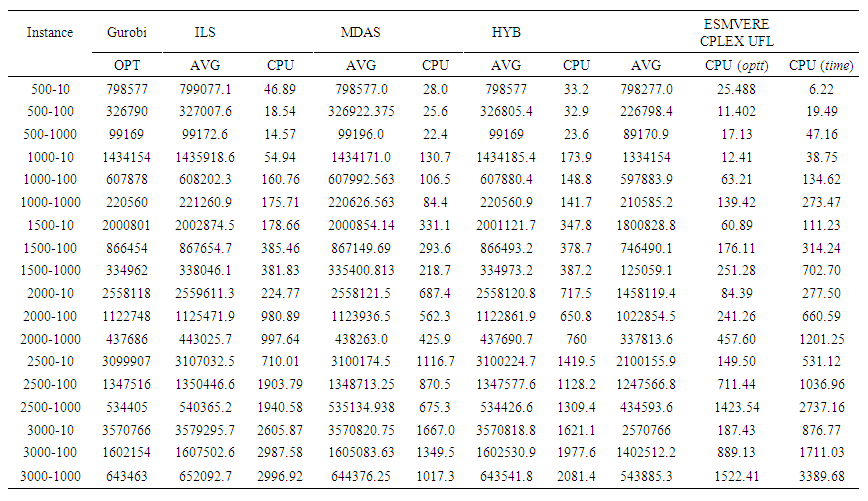 | Table 3 |
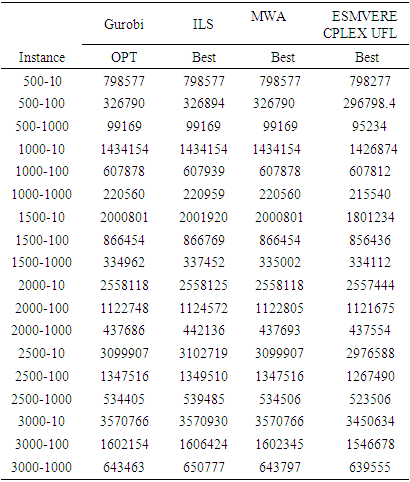
In the larger instance experiments are given the CPU-times for the ESMvere CPLEX UFL. Columns optt stands for the CPU-time needed to find the best solution in the execution and, Column time stands for the full CPU-time of the execution [3]. Compared to ILS, MDAS, HYB the ESMvere CPLEX UFL method finds better solutions to all problem instances and requires smaller average CPU-time in all the cases. This has proved the effects of removing the distance matrix, the ESMvere CPLEX UFL algorithm has shorter running time.ESMvere Cplex UFL best solutions compared to the MWA, ILS, Gurobi best solutions for MED test problems [3]Table 4
 |
| |
|
The ESMvere CPLEX UFL obtains higher quality best solutions for all MED instances. A reverse supply chain takes a long time to implement, thus, the case was more about bringing out that process in a realistic case and solving it accurately using the newly invented solutions. The creation of a real-life instance that is solvable accurately using the algorithm that fits this concept was the focus. A thorough emphasis was placed on the instance creation process in the real world and the accuracy of the algorithms in solving the single instance created for the problem. Cases of this are rare or missing in literature.
4.3. Implementation Results
For a company that is in the business of recycling or exporting ULABs, the optimum locations for them to place ULAB collection facilities, could be given as a map with triangles and dots (Figure 6), or a list of geographic coordinate points. The map and the list give the optimum locations to open all the ULAB collection facilities, to have an optimum least cost ULAB collection network. The map and the list of coordinate points were established, and the calculation of the model returned twenty-six optimum locations according to the UFL problem.
4.3.1. The Facility Opening Costs
The Facility opening costs where determined by face-to-face interviews of the 4 brands of Gas stations in the Republic of Mauritius. The management would determine the estimate price they would charge to open a ULAB collection facility on their brand of Gas stations.The twenty-six optimum locations are listed in the following sections according to their districts. The 152 gas stations in the whole Republic of Mauritius [8], were all considered as potential facility locations. The optimum set F’, out of the whole 152 gas stations (ulab collection facilities) was calculated against the 144 (ulab cities).The goal was to develop a minimum cost reverse logistics network, hence the computation of the models left out some locations and picked up some locations from the large set F of 152 potential facility locations, to the optimal set F’ of twenty-six facilities which was calculated by the ESMvere CPLEX UFL Solver Model. The twenty-six coordinate points can be tested, they can be input on ArcGIS (Figure 6) or Google Maps to verify the accuracy of the solution visually.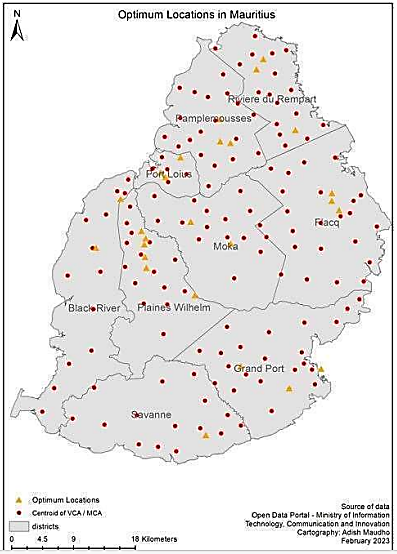 | Figure 6. UFL Optimum Solution [14] |
The centroid of each district (red dots Figure 6) was taken to be the client location, these together were 144. However, because of the magnitude or size of the calculation (152x144) and since it is a computationally intractable combinatorial problem, the calculation could not be made all at once.The ESMvere CPLEX UFL Solver Model can calculate a limit of 7 facilities and 125 clients per calculation.Thus, the whole map of Mauritius was divided into 9 districts namely Port Louis, Pamplemousses, Riviere du Rempart, Flacq, Grand Port, Savanne, Plaine Wilhems and Moka districts. Thus, the coordinates of the Gas stations in each of the 9 districts were calculated against the coordinates of the clients in each district.Figure 6 shows the ArcGIS display of the optimum ULAB collection network. The network considers and minimizes the opening costs of the facilities as well as the distances from all clients to the lowest-cost facility opened and minimum distance to opened facilities network.The pattern of the opened facilities in the solution appears accurate in terms of how it opens facilities that are in the median of all the client points in the district. By mere observation, it is visible that most facilities being opened are in the median center of the district for all the clients displayed on the map. However, it is worth noting that the solution also considers the opening costs of facilities and not just the distance.However, because the solution inputs the same client coordinates for the whole district this calculation in series means many facilities are being opened in the same median area of the district. Plaines Wilhems is a clear example of this, where there are many collection points centrally located in the median of the district. In some areas to a greater extent, the visual appearance of the distribution of the opened triangle facilities is not careful, even, or fair in terms of access of the collection facilities to the clients. This clustering of many facilities around the same area in the districts of Riviere du Rempart, Pamplemousses, Flacq and Plaines Wilhelm were corrected. The correction of this is displayed in Figure 7.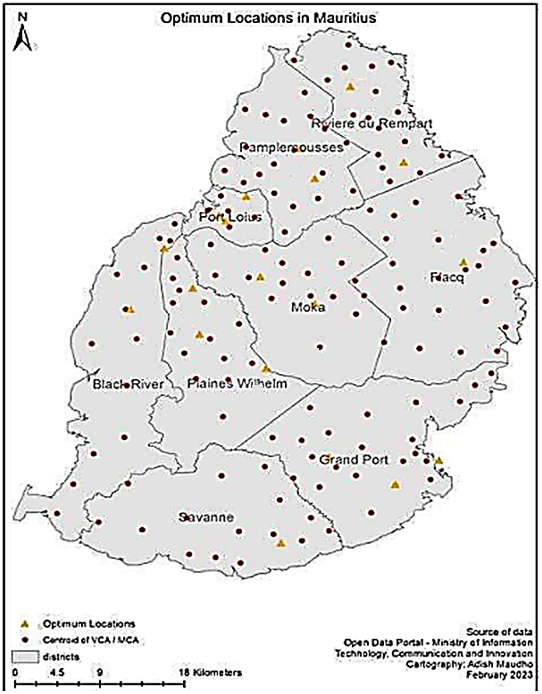 | Figure 7. Corrected UFL Optimum Solution [14] |
Figure 7 shows the final corrected optimum solution which hosts nineteen facilities. The facilities were removed from the districts of Riviere du Rempart, Pamplemousses, Flacq and Plaines Wilhelm. This reduced the cost of opening facilities from approximately 111 800MUR to approximately 77800MUR.Plaines Wilhems (Figure 6) is a clear example of this, where there are many collection points centrally located in the median of the district. This can be compared to Plaines Wilhems (Figure 7), which now opens three facilities. In some areas, to a greater extent, the visual appearance of the distribution of the triangle facilities opened was not fair in terms of access of the collection facilities to the clients.
5. Conclusions
A model of reverse logistics that utilizes the ESMvere Cplex UFL problem to locate collection points for ULABs was simulated and designed to accommodate nineteen ULAB collection points. The nineteen coordinate points can be tested, they can be input on google maps to verify the accuracy of the solution visually. The location solutions were tested using ArcGIS and google maps. The results were sound in that they gave truthful real live coordinates of the best locations, the minimum cost locations Figure 7 which were located generally at the minimized distance and cost locations.The solutions developed in this study are all usable in other industries and for other purposes besides the purpose of this study. This is because the models are separated from the data. A simulation solution was developed that helps in the safe collection and disposal of ULABs. A reverse logistics network was modeled that has the coordinate points of the nineteen optimum locations to establish the collection facilities for ULABs.
Conflicts of Interest
The authors declare no conflicts of interest regarding the publication of this paper.
Appendices
Appendix A The Emmanuel Siyawo Mvere CPLEX UFL Problem Solver ModelThe Emmanuel Siyawo Mvere CPLEX problem solver model, is a software invention that solves the UFL problem. It is a tool that aids, and guides management in making sound decisions on where to locate facilities. It aids management in the decision of where the best places are, lowest cost places, to locate facilities considering the opening costs and the Euclidean distances of GPS coordinate points?The CPLEX Opl Code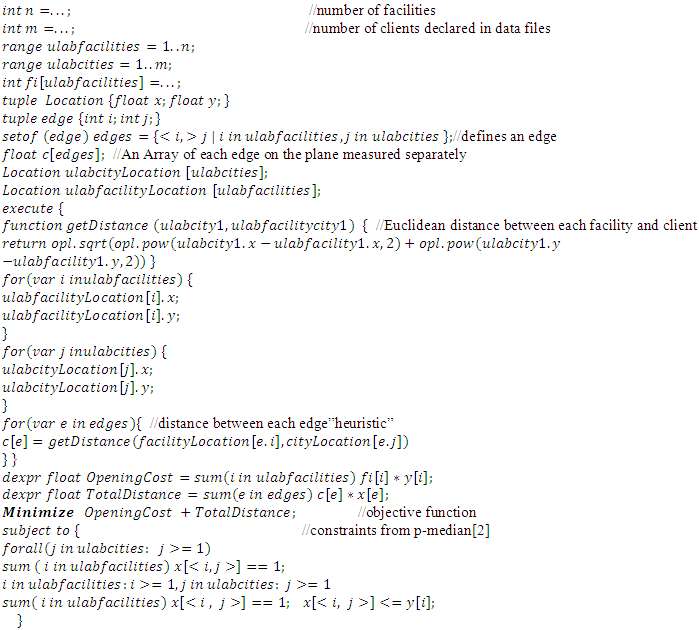 Appendix B The Emmanuel Siyawo Mvere CPLEX UFL Solution Model test demonstration.The model of the CPLEX software used, the (IBM ILOG CPLEX Optimization Studio, Version: 20.1.0.0, Build id: Community Edition) is limited to 7 facilities (ulab collection facilities) and 125 clients (ulab cities). Based on this limitation on the software, a choice can only be made between a maximum of 7 facilities and 125 clients at any time. A way to overcome this limitation in this case was to perform the computations in a series. Out of 144 client locations, 125 locations were selected from the Northen densely populated areas, whereas 19 client locations were dropped from the southwest, spacey populated areas. The 152 potential facility locations were computed in series making a choice of the best locations within each region, using the same set of clients. The ESMvere UFL solution model in this case can compute the solution in regional cases only that do not exceed the size limits of (7 facilities and 125 clients) the software version. Hence the possible solution was to perform the computation in series, for each region. Thus, the densely populated regions such as Port Louis were computed first. The division of the whole Republic of Mauritius map into regions was sensible and effective in that some regions to the southwest of Mauritius are too spacey populated, thus in these regions it would be more feasible to open all the ulab collection facilities. Whereas in areas that are too densely populated it would be more effective selecting the few facilities that would serve all clients with a minimum cost.The other method which was adopted as the more efficient and accurate method, was to divide the whole country of Mauritius into districts. The division of clients and facilities into districts meant that the calculation would be more accurate as it would be between the facilities and the clients that are in that district. In this method the computation to establish the optimum network would again, have to be computed in series.The capital city Port Louis has a total of 17 gas stations. The company Total service stations owns 7 gas stations, whereas the company Shell service stations also owns 7 gas stations, 2 gas stations belong to Engen and 1 gas station belongs to Indian Oil. Figure 8 displays the solution to the decision variable
  . The solution to the decision variable
  is displayed on the left half of the diagram Figure 8 as an array with seven numbers or seven locations
  Thus
Thus  is a boolean decision variable, which places a 1 on an open facility and a 0 on a closed facility. Thus the solution in Figure 8 opens the ulabfacility location 7 only. This clearly is a minimised set of open facilities, as the facility opening costs of facility 7 is 4000. Thus an optimum minimised solution of 4000 for the Total OpeningCost of the facilities in the case and a minimised TotalDistance value of 22.675. The solution to the decision variable
  is also displayed on the right half of the diagram Figure 8. This side displays a list of all the facilities
  , this displays ulabfacilities (size7), meaning there are 7 facilities listed down from facility 1 down to facility 7. The corresponding coordinates of facility 7 are also displayed on the right half of the diagram Figure 8.
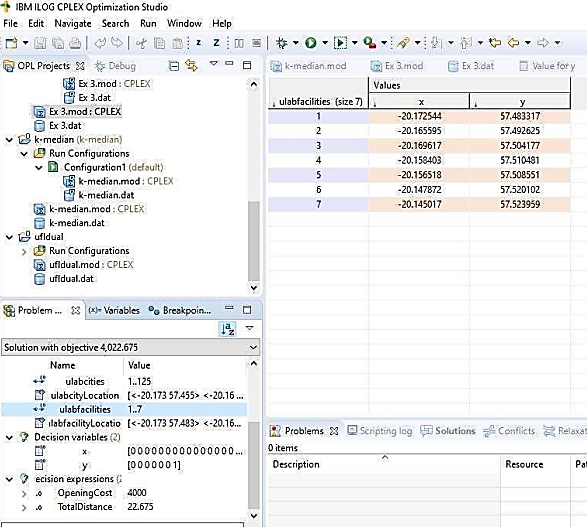 | Figure 8. Total Gas in Port Louis |
Out of the Seven Total service station facilities in the capital city of Port Louis, the best facility to open would be the facility 7 with coordinates -20.145017 57.523959. Typing the solution coordinates on google maps reveals the real and live, location of the feasible gas station Figure 9. The other six Total gas stations in Port Louis are dropped to minimize costs, while a (ulab collection facility) is built on this gas station. 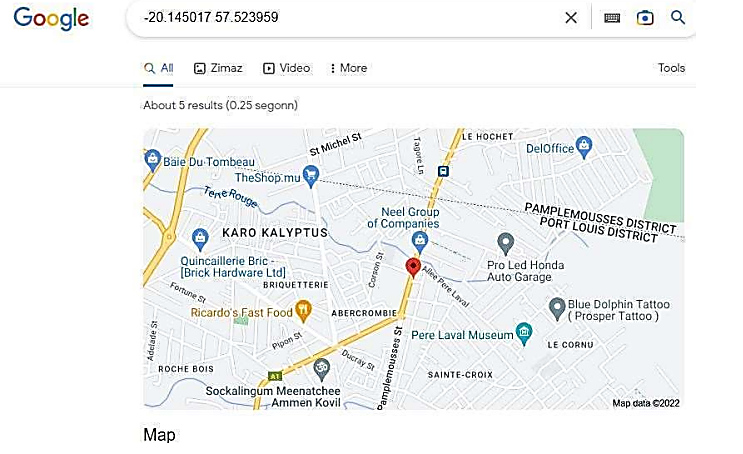 | Figure 9. Total UFL Solution |
The objective function value of 4 022. 675 is displayed with a TotalDistance of 22.675. These values involve distances from 125 clients (ulab cities), of which some of the clients are not in the Port Louis Region. Hence a more accurate solution will involve reducing the clients (ulab cities) to those that are only within the Port Louis area. How ever dividing the (ulab cities) into regions would be complex and can distort the data.Appendix CAn instance was drawn from a Map of the republic of Mauritius and scaled using ArcGIS software. The list of the coordinates for the gas stations were plotted using ArcGIS on the Map of the republic of Mauritius, these are shown in the diagram.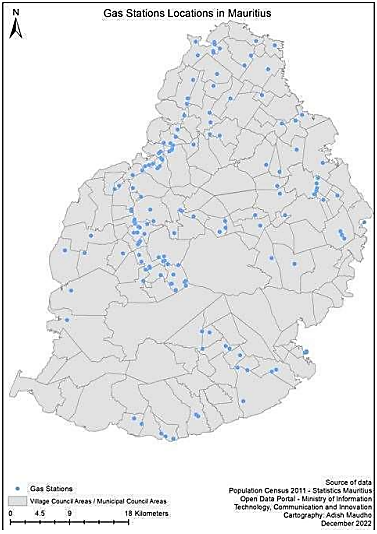 | Figure 10. ArcGIS Gas Station Map [14] |
Appendix D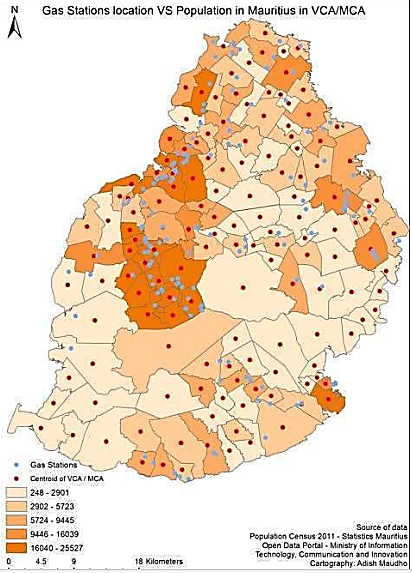 | Figure 11. ArcGIS Population Size [14] |
The data for the client population areas, or the (ulab cities), is the data of those who need to dispose the ULABs at the (ulab collection facilities). These are the clients, that require a minimum distance to a (ulab collection facility), to motivate them to easily dispose the waste safely. The centroid of the population size, density and distribution regions of the Republic of Mauritius was used to represent the particular center of a region. The Map displays the population centroid as a red dot. The differences in the population size, or in the population density, or in the population distribution, are not being considered. However, the center of a region which is populated is shown with a red dot.Appendix EFigure 12 is the best representation of the data as it considers the (ulab collection facilities) plotted against the (ulab cities). As the Euclidean distance is the only metric being considered, ArcGIS was used to visually display the coordinate data, from the two sets of data, the client data and the facility data. 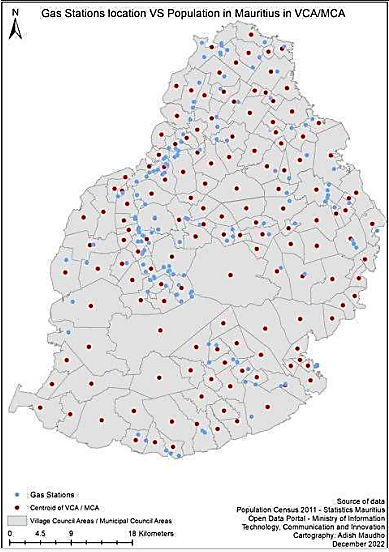 | Figure 12. Facilities vs Clients [14] |
References
| [1] | Ahn S, Cooper C, Cornuejols G, Frieze A (1988). Probabilistic analysis of a relaxation for the k-median problem. Mathematics of Operations Research, 13(1): 1–31. |
| [2] | Byrka, J., Ghodsi, M. R. & Srinivasan, A. (2010). ‘Lp-rounding algorithms for facility-location problems. 26th Annual ACM-SIAM Symposium on Discrete Algorithms (SODA) pp. 736-756. |
| [3] | Barahona F, Chudak F (1999). Near-optimal Solutions to Large Scale Facility Location Problems. Technical Report RC21606, IBM, USA. |
| [4] | Caceres, H. (2014). CPLEX Seminar Getting started with CPLEX Studio (part 2). https://www.youtube.com/watch?v=URHDTzzDJak pp. 2022–02–17. |
| [5] | Cacioppi, P.& Watson, M. (2014). A Deep Dive into Strategic Network Design Programming: OPL CPLEX Edition. Northwestern University Press. |
| [6] | Czerwinski, A., Wrobel, K., Podsadni, P. & Lach, J. (2018). The charging-discharging behavior *-*of the lead-acid cell wit electrodes based on carbon matrix. Journal of Solid-State Electrochemistry pp. 1433–0768. |
| [7] | Elert, G. (2019). Voltage of a car battery. pp. 2020–05–13. https://hypertextbook.com/facts/2001/ThiMeaganLe.shtml. |
| [8] | Gasstationmauritius (2022). Gas station data Mauritius. pp. 2022–12–05. https://data.govmu.org/dkan/?q=dataset/gas-stations. |
| [9] | Jain, K. & Vazirani, V. (1999). Primal-dual approximation algorithms for metric facility location and k-median problems. in ‘Proceedings of the 40th Annual Symposium on Foundations of Computer Science’. FOCS ’99. p. 2. |
| [10] | Jain, K. & Vazirani, V. (2001). Approximation algorithms for metric facility location and k-median problems using the primal-dual schema and Lagrangian relaxation. Journal of The ACM - JACM. |
| [11] | Jiang, H. (2018). An attempt to design a better algorithm for the Uncapacitated facility location problem. arxiv. |
| [12] | Kowlesser, P. (2017). Overview of solid waste management in Mauritius. Environment. |
| [13] | Li, S. (2014). Approximation Algorithms for Network Routing and Facility Location Problems. PhD thesis. Princeton University. |
| [14] | Maudho, A. (2023). ArcGIS Cartography Open Data Portal, Ministry Of Information Technology Communication and Innovation Mauritius. |
| [15] | PAGE, (2017). Industrial Waste Assessment in the Republic of Mauritius: Opportunities for Industrial Symbiosis. Partnership for Action on Green Economy. |
| [16] | Peidro, D., Martin, X., Panadero, & Juan, A. (2024). Solving the Uncapacitated facility location problem under uncertainty: a hybrid tabu search with path-relinking simheuristic approach. |
| [17] | Phoolchund, H. (1995). Occupational and environmental health in Mauritius: a review of trends and recent studies. Elsevier Science Ltd pp. pp.251–255. |
| [18] | Prajapati, S. (2016). Lead acid battery recycling in India. IOSR Journal of Electrical and Electronics Engineering pp. 99–101. |
| [19] | Svensson, O. (2009). Approximability of Some Classical Graph and Scheduling Problems. PhD thesis. University of Lugano. |
| [20] | Swamy, C. (2004). Approximation Algorithms for Clustering Problems. PhD thesis. Cornell University. |
| [21] | Voynick, S. (2011). Trade and environment a teaching case: The Basel ban and batteries. Institute for trade and commercial diplomacy. |
| [22] | Glover, F., Hanafi, S., GuemrI, O. & Crevits I, (2018) A simple multi-wave algorithm for the Uncapacitated facility location problem. |

 Abstract
 Reference
 Full-Text PDF
 Full-text HTML