Raghad Hemeimat1, Osama F. Abdel Aal2
1Industrial Engineering Dept., University of Jordan, Amman, Jordan
2Mechanical Engineering Dept., University of California Merced, Merced, USA
Correspondence to: Raghad Hemeimat, Industrial Engineering Dept., University of Jordan, Amman, Jordan.
| Email: |  |
Copyright © 2024 The Author(s). Published by Scientific & Academic Publishing.
This work is licensed under the Creative Commons Attribution International License (CC BY).
http://creativecommons.org/licenses/by/4.0/

Abstract
Baggage handling systems (BHS) are considered to be the key resource in optimizing the baggage handling operations at major airports, the fixed capacity of a BHS and it chutes generate challenges in securing an accurate and efficient bags transfer. With the growing number of passengers travelling through QAIA each year, the airport is obligated to develop a plan facing the forecasted capacity issues, tracking the bag’s journey through the BHS system helps identifying all the processes and actors interacting within each other, emphasizing the variables which restrain the BHS capacity. Hence, it is vital to construct a valid overview capturing the process as a whole. A detailed simulation model is constructed using Rockwell’s Arena simulation software, the objective of the developed model is to allow for the assessment of each operation and its interactions. Outputs from the model are intended to be used to optimize the current process, providing a tool that can alter certain variables to generate different scenarios with different outputs and results, compared with the historical data these results can help in planning at a strategic level and promote solutions thought out the process.
Keywords:
Baggage handling systems, Rockwell Model, Areena, Airport simulation
Cite this paper: Raghad Hemeimat, Osama F. Abdel Aal, Improving the Baggage Handling System (BHS) at Queen Alia International Airport by Using Rockwell’s Arena Simulation Software, American Journal of Operational Research, Vol. 14 No. 1, 2024, pp. 1-11. doi: 10.5923/j.ajor.20241401.01.
1. Introduction
International Airports like Queen Alia International Airport are one of the most crowded places in the country, people travel from all around the world to visit touristic sites or to receive medical care here in Jordan. People might also land in QAIA for transit flights to Saudi Arabia or other Middle Eastern countries. So as the number of passengers departing and arriving to QAIA increases₁, the number of baggage that comes with each passenger increases, which leads to what is called a bottleneck at the conveyor belts (Chutes), and that particular issue may result in flight delays. Delays in flights often cost a lot of money, and will leave customers (passengers) unsatisfied. In this project, we study the Baggage handling processes in the QAI Airport, and a simulation model will be built mirroring the conceptual baggage handling system (BHS) in the airport. By studying the baggage flow at Queen Alia International Airport, the number of decision points; such as security checks, in the BHS is noticeable. In addition, the large number of restrictions and actors for every baggage is complicated. In every airport, the baggage handling system deals with inbound and outbound baggage, in other words, the arrival and departure of baggage. In this project, the analysis of the outbound baggage will take place. Due to the complications of the process, since it has both discrete and continuous events, the use of simulation is highly recommended. Additionally, for the huge significance of the baggage handling system, any changes made to the system usually require huge investments, a great amount of time, and might cause safety issues. The model will locate and address issues in the entire process where conclusions can be made. Although, the BHS industry is projected to be worth 9.36 billion USD, there is no commercial model that can be used to analyze the BHS or the entire baggage handling process. Therefore, our main objectives in this project are the following:1. Build a valid simulation model to represent the baggage handling process in QAIA.2. Create an animation scheme for the layout of the whole system. The simulation model reflects baggage flow in QAIA and is constructed with a detailed BHS control logics. Every airport has its own BHS, which can vary dramatically between airports considering the different layout and traits of each airport. Accordingly, the model cannot be generalized for all airports. The refined model does not fulfill the daily operational plan because it is proposed for strategic planning and needs to be adjusted to each scheme.The rest of the paper is organized as follows: Section 2 presents related works in the literature on the baggage handling systems and other simulation approaches; Section 3 discusses the methodology adopted in this study, the conceptual model is introduced; Section 4 then explains how the simulation model can be used in creating and observing different scenarios with holding a sensitivity analysis on said scenarios for optimization of the system; Finally, conclusion of this project, as well as ideas for future work and recommendations can be found in Section 6.
2. Related Works
Baggage handling systems typically consist of several components, including check-in counters, conveyor belts, sorting machines, baggage carts, and automated guided vehicles (AGVs). According to Smith and Jones [1], these components work together seamlessly to transport luggage from the check-in area to the aircraft and vice versa. Moreover, automated systems have become increasingly prevalent, offering benefits such as reduced manpower requirements and faster processing times (Chen et al., [2]).The complexity of baggage handling stems from various factors, including fluctuating passenger volumes, stringent security requirements, and the need for seamless transfer between flights and terminals. Berechman & de Neufville [3] highlight how volume variations can strain systems, leading to congestion and delays during peak periods. Moreover, security protocols demand thorough baggage screening, which can slow down processes and increase the risk of disruptions (Kaspersen et al., [4]).Despite advancements in technology, baggage handling systems still face various challenges. One major challenge is the risk of mishandling and loss of baggage, which can lead to customer dissatisfaction and financial losses for airlines (Rao et al., [5]). Additionally, congestion and bottlenecks in baggage handling areas can occur during peak travel seasons, leading to delays and disruptions (Chowdhury & Yilmaz, [6]). Addressing these challenges requires continuous improvements in system design, technology, and operational processes.Recent years have witnessed significant advancements in baggage handling technology. For instance, the adoption of RFID (Radio-Frequency Identification) technology enables real-time tracking and tracing of luggage throughout the entire journey (Golightly & Taylor, [7]).Furthermore, the integration of artificial intelligence and machine learning algorithms enhances the predictive maintenance capabilities of baggage handling systems, reducing downtime and increasing reliability (Wang et. al., [8]).Several trends are expected to shape the future of baggage handling systems in airports. These include the widespread adoption of robotic solutions for baggage handling tasks, the development of smart baggage tags with embedded sensors for enhanced tracking, and the implementation of blockchain technology to improve data security and transparency in baggage handling processes (Jiang & Li, [9]). Moreover, there is a growing emphasis on sustainability, with airports exploring eco-friendly solutions such as electric-powered baggage handling vehicles and renewable energy sources for system operations (Kumar & Singh [10]).Another study that was conducted in the University of Chile for Santiago International Airport, presented a microscopic simulation model for a baggage handling system that fully integrates all baggage-related subsystems. These include passenger arrival to check-in queues, baggage check-in, security screening, sorting, transport to the aircraft and loading. Lin et. Al. [11] used System Modeling Language (SysML), to model and optimize the baggage handling system. Frey et. al. [12] considered the planning and scheduling of inbound baggage that is picked up by passengers at the baggage claim hall. A BHS simulator is built by Cavada et. al. [13] using a traffic microsimulation software as base platform. The simulation platform integrates various airport operation systems. Hafilah et. al. [14] used CPN for modeling and simulation of large airports which deals with more than 20,000 bags per day.
3. Methodology
It is often the case that while modelling a BHS, the entire baggage handling process should be included –departure and arrival- in order to achieve a wider scope, however, our project’s main concerns are to eliminate all inequities in chutes distribution, and to provide an insight on the BHS process only for the outbound baggage, which comes from either checked-in baggage or transit flights baggage. Arrival baggage are going to be excluded from this model, mainly because the BHS does not handle them, moreover, the arrival baggage process is not as critical compared to the departure, a single delay in the departure baggage will most certainly cause a delay in the flights schedule for the aircrafts, which in its part can lead to a chain reaction of delays, resulting in a waste of time, extra cost, and customers dissatisfaction.
3.1. The Baggage Handling System BHS
Airport Facilities and Actors: The airside, the terminal and the landside are the three main areas in any airport. The airside is the part of an airport nearest to the aircraft. The landside is the side of an airport terminal to which the general public has unrestricted access. The terminal is the area which is used to travel between the landside and the airside. Those three areas are shown in figure 1. The BHS extends from terminals to airside areas.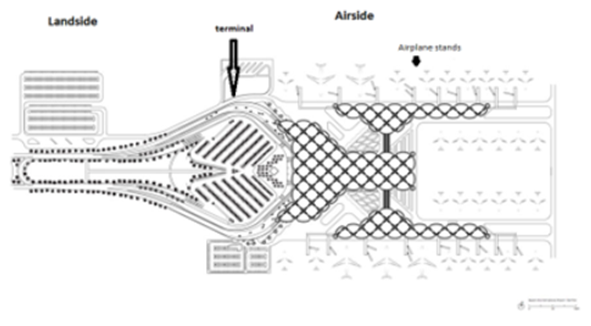 | Figure 1. Aerial view of Queen Alia international airport |
Areas and Terminals: Main areas and terminals in the airport are the check-in counters area; the security control area, gate waiting lobbies, handling facilities and baggage reclaim areas. The ones that are involved with the baggage handling process are the check-in counters area, baggage reclaim and handling facilities. The baggage reclaim area is for inbound flights, and baggage does not enter the BHS system to reach it.Check-in counters Area: Boarding passengers head to the check-in counters area, where they drop off their bags. The area consists of 64 check-in counters, divided into 2 sections: A to the south side and B to the north side. Each divided into two parts; from 1-14 and from 15-32. As shown in figure 2. 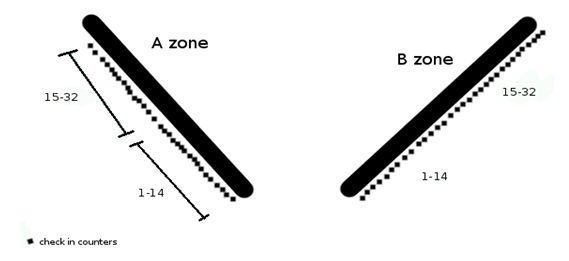 | Figure 2. Check in counters |
Baggage Reclaim: The baggage reclaim is where inbound passengers pick up their baggage. The baggage reclaim area at QAIA consists of five carousels, in which baggage arrive to. As we mentioned earlier the bags here do not go through the BHS. Therefore, baggage reclaim will be out of scope. Handling Facilities and Handling Agents: Currently there are 2 main handling agents operating at QAIA; Royal Jordanian (which handles the majority of the baggage), and Menzies. At the handling facility for the outbound bags in QAIA; outgoing bags (both the passengers had checked-in and the connecting flight bags) are gathered and handled by the handling agents. And for the incoming airplane, inbound bags are loaded into a system that delivers the baggage to the baggage reclaim area mentioned before. As for the handling agents; the responsibility of accuracy and punctual timing is evident, Along with providing the necessary tools to store, transport, sort, load and unload the baggage from and to airplanes and/or carousels. It is safe to say that handling agents are responsible for the bag before it enters the BHS system and after it goes through it.The Airside: The areas in which are involved in the baggage handling process in the Airside are the stands (The areas where the airplane parks so it can be loaded or unloaded of baggage), and taxiways (Routes between stands and airplane runways). It should be noted that not all airplanes can be parked on a stand considering the varying sizes of the airplanes. Refer to figure 1. Actors and the Airport’s Operator: Actors in the baggage handling process are responsible for the baggage depending on in what process the baggage are going through; During check-in, handling agents insert the bag into the BHS. Once the bag has been inserted into the BHS, the airport’s operator, Airport International Group (AIG) is responsible. After the bag leaves the BHS, handling agents, again, are responsible for the bag as explained earlier. As for baggage handling process, the airport’s operator, (AIG), is responsible for providing the services and facilities needed for the process to be operated. This includes the check-in counters, BHS, taxiways, stands, allocation of these resources and most importantly the daily allocation of flights baggage into the BHS system. The Baggage Handling System in QAIA: Of all the actors and processes dealing with baggage handling, the BHS is considered to be the core and a main resource in the handling process, the reason behind that is its direct effect on the inputs and transfers throughout the processes and the cau sal relationship on the flow capacity of the system as a whole, a congested conveyor belt for example will cause a slowdown all the way up to the check in counters and might even shut it down completely. The BHS is a continuous flow conveyor system, operating with the input starting at the check in counters where passengers will drop off their baggage, to be assigned with a barcode that is used to track and allocate the movement of the baggage all the way to the destined aircraft, another source of input is the transit baggage coming from other planes, the barcode of each bag-tag is then scanned so that the BHS will register all the bag’s details including the flight information, destination , after the bag registration, it goes to the security check. There are two baggage allocation methods, Direct sortation, in which there are two scenarios, first, all flights from the B check-in section are directly allocated to chutes OB1 and OB2, and secondly some certain flights (flights going to the UK, USA and Qatar) are also directly allocated to chutes OB1 and OB2. And full sortation where the allocation of the flights is predetermined daily by the airport operator (AIG).
3.2. The General Layout of the BHS
 | Figure 3. Layout of the BHS |
Figure 3 shows the BHS layout in QAIA, which consists of three subsystems, the check-in, security screening and the sorting conveyor. The check-in subsystem consists of 2 check-in linesØ Line A: which contains 32 check-in counters segmented into two parts (1-15) connected to the OB3 chute and (16-32) connected to the OB4 chute.Ø Line B: which also contains 32 check-in counters with similar segments connecting to OB1 and OB2 (connections colored black in figure above).Passengers can also check-in prior to the flight gate window using designated offices outside the airport facility such as the RJ office at the 7th circle in Amman, which can reduce the check-in time and queuing for both the passenger and the airport. How many bags can be checked-in through each part is decided 8 hours prior to the start of the day where an agent in the OCC room assign each flight to its check-in counter mainly using two rules, the first is the priority of some flights that have special characteristics such as extra number of bags per passenger (such as flights to London Heathrow) or a fixed parking space for the air-company that can shorten the travel distance depending on the nearest chute for that parking space, the second rule is to try to equally distribute the flights on the four chutes while accounting for the capacity of each chute depending on the flight’s number of bags.There are three levels of screening in the BHS. Each bag will go through the first level of security, but will not necessarily go through the second and the third levels, that depends on the result of each level. For a start all bags go through level 1 screening where they will be subjected to a 2-D X-ray inspection, where there are four level 1 security scan rooms connecting between each of the four segmented check in counters and their chutes. In case a further inspection was needed and the 2-D screen showed an unidentified object, the bag will head to a 3-D X-ray inspection to further investigate its contents. There are two 3-D scan rooms; one for each check in aisle A and B. Any bag that fails these 2 security levels will be directed to a cage; where the bag will be inspected manually and opened to check for the hazardous or unaccepted materials spotted by the previous X-ray scans. Once the bags are cleared through the screening process, they proceed to the U-sorter, which is an automated conveyor belt system that connects locate and move them to any chute within the BHS. allowing for a full sortation, where the path of each bag is adjusted, and sent to an automated sorting subsystem instead of the traditional manual assigning a day prior. The U-sorter has 4 Inputs ways that connects pathways, coming from the chutes carrying any bag that needs to be moved into a different chute through the U sorter by using full sortation (they are marked in blue). 4 outputs ways that connects pathways, going to the chutes carrying any bag that needs to be moved into a different chute through the U sorter by using full sortation (they are marked in red). 2 two way input/output paths that are used to connect the bags that have passed level 2 security and allocate them to their original chute (they are marked in yellow). Any bag that fails the first level security check will be transferred to the second level of security, if the 3-D manual scan at the second level accepted the bag it will be re-routed all the way back through the U-sorter, which will increase the traveling distance and time to reach its assigned chute, however, if a bag has failed the 3-D scan also it will be directed to a cage to be inspected manually and investigated for hazardous materials or unacceptable goods, another reason would sometimes be that the bag-tag couldn’t be read by the scanners mounted on the belts and therefore cannot be assigned, an amended tag would be used and the bag would proceed to its destination.
3.3. The Conceptual Model
Figure 4 represent a deployment flowchart for the process within the BHS, the boundaries of the system being modeled are presented as the handling agents, where the bags journey starts at the check-in counters, the inputs of the BHS process; and ends at the off-load location, the outputs of the BHS process; where it will be loaded on the trolleys and into their assigned aircraft, in between is where the decisions are made, and that is where the airport responsibility comes into action, bags are to be inspected at each security level and then properly distributed in a desired continues flow throughout the BHS sorter and into the landside for the handling agents to proceed with. The conceptual model has some simplifications compared to reality:Ø Some passengers carry different types of bags that may not be suitable for the BHS system. These bags might be large and/or in an unusual shape; in that case, this particular type of bags will go through special security checks and then allocated to their chutes through an elevator handled by security personnel, since this case has a negligible number, this type of bags are excluded from the model.Ø The model does not account for the misread, multi-read, or any other error in reading the baggage signal message (BSM), such baggage would usually get transferred to the MES station for later inspection.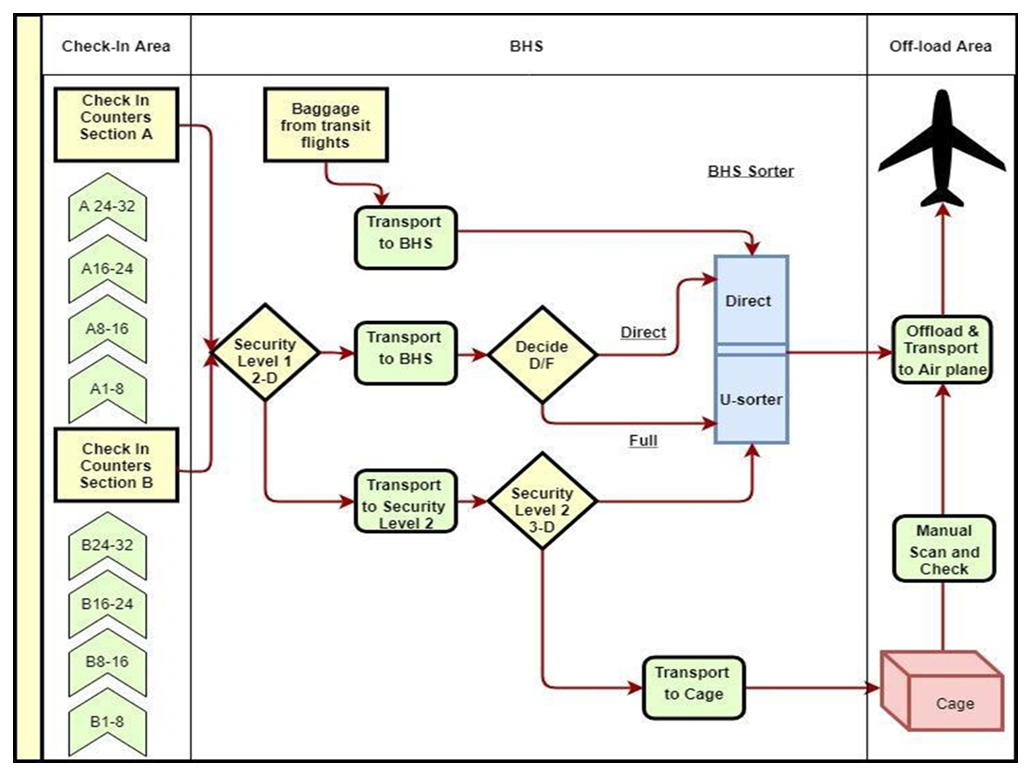 | Figure 4. A flowchart for the process within the BHS |
It is worth mentioning that these simplifications will not have significant impact on the accuracy of the simulation model that would be discussed in the coming sections as the vast majority of the baggage go through the normal workflow that was described in details earlier. The percent of bags with unusual shapes or with errors in reading is estimated be less than 7% as reported from the source.Baggage is usually dropped off at the check in counters at QAIA or at the Royal Jordanian offices at the 7th circle. Loading and unloading are two processes that indicate getting the bags on the aircraft and getting the bags off the aircraft, respectively. Loading the bags to the aircraft is our main concern in this project, which is presented by the departing aircraft. The loading process takes place at the sorting area; the workers take the bags off the assigned chute and put them in dollies, which are low trucks or carts with small wheels for moving loads too heavy to be carried by hand Each side of the chutes can fit up to 4 dollies, and each dolly can fit up to fifty bags. The dollies then are connected together and dragged by special vehicles (tugs) that are driven to the aircraft. baggage that comes from transfer flights are added up to the assigned chute depending on their destination, that is done when these bags are transferred to the transit baggage belts T1 and T2, which eventually takes the bags to the U-sorter, that sends these bags to the appropriate chute.
4. Simulation Model
The use of a simulation to study the BHS and all the actors and activities involved in the baggage handling process is favorable because it enables the user to alter in certain operations and observe how they impact the process. Building the model was an iterative process, where steps have been taken back and forth until the desired outcome had been reached. Due to the complexity of the process itself, there have been some simplifications, which will later be mentioned, used in building the model to allow its implementation on the software. The model is set to simulate the baggage traffic for each day. The simulation model is set to begin from the arrival of baggage to the conveyor belts behind the check-in counters and finish when the baggage is transferred to the trolleys that will later transfer the baggage to the assigned flight. And it has been tested on several non-consecutive days.It was decided to use Rockwell’s Arena Simulation software to model the departure baggage movement in the BHS because of how versatile the operations on the software are and how powerful its potential is.
4.1. Assumptions and Simplifications to the Simulation Model
1) The simulation model has some simplifications compared to reality:2) All handling agents have the same process time for all activities.3) Baggage that are transported to the cage are set to exit the simulation model, where in reality they are manually delivered to their assigned chutes if they have passed the screening.4) Due to lack of data, the baggage on each flight has been estimated proportionally to the number of passengers in each flight.5) The route of the baggage from each check in counter to the outlet of the shared conveyor belt has been neglected.6) The baggage arrival distribution is the same for all flights where in reality this is not the case.7) The problem bags with a defective BSM are not accounted for in the model.
4.2. Input Data
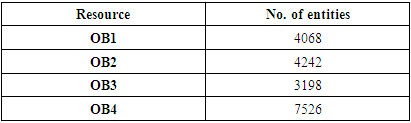
The data that was used in this project to build a simulation model was either collected manually, by using stopwatches and time and motion observation, or through reports from the OCC at QAIA. Each set of data will be explained further in the following sections. This study will show the results of the simulation of the 19th of august, 2022; which was one of the days that the simulation model was run for.1. Flight schedule: is a table that contains all the flights departing from the airport at any particular day, the number of passengers in each flight and the departing time. This data was provided by the OCC at the airport. From the maximum bag record provided by the OCC it was found that the day with the maximum number of bags per hour entering the BHS being 1609 bags from 9 AM to 10 AM, was the 19th of August 2022. Provided by the OCC, the average baggage to passenger ratio is 1.15 bags per passenger. So the number of passengers in the table was multiplied by 1.15 to estimate out the number of bags for each flight.2. Baggage Arrival and Probability profile: As for the baggage arrival, it represents the arriving time of the baggage into the chute; this particular set of data was collected manually at the check-in counters in the airport. It is important to highlight that although the data is collected manually using the stopwatch, this was done with high accuracy over different shifts and days as the purpose was to capture the real situation and workflow during a selected time duration. Using Minitab, the data was fit and found to be exponential, with a mean of 0.2 bags per minute.3. Route times: The time it takes for the bag to go through various routes such as (from the check in counters to the first security level, from the first security check to the U-sorter, from the U-sorter to the chute, etc.) was given by the BHS at the airport. 4. Security Probability profile: There are originally five levels of security at QAIA, level 1 which is the 2D automated check, level 2 which is the 2D manual check, level 3 which is the 3D automated check, level 4 which is the 3D manual check, and if the bag fails all 4 security levels it is transferred to a cage where it gets inspected manually. The automated security system has been deactivated, which leaves the airport with three security levels. The probability of bags passing the first, second and third security levels are given in a table from the BHS at QAIA.5. Process time: Process time is the time to transfer baggage from the chutes to the dollies, which includes scanning the bag, carrying it and putting it into the dolly. This set of data was collected manually, and it was found that the average process time for a worker is 12 seconds per bag.6. Distribution on chutes: The following figure shows a screenshot of the distribution table on the chutes. This table includes the makeup carousels (OB01, OB02, OB03, and OB04) and the distribution of bags on each one of them, with the total number of bags and their ratio inn each chute per day.
4.3. Areena Implementation
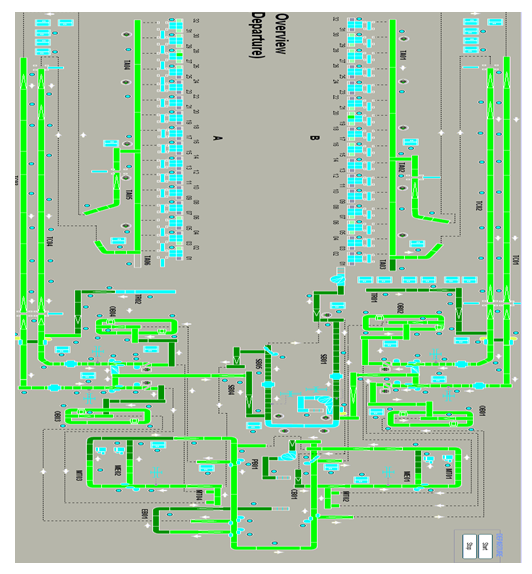
The implementation process of the conceptual model into a simulation model requires the assembly of various building blocks offered by Arena with complex connections. And due to the versatility of Arena, no coding was required. All the tools used were solely found in Arena’s kit. The modules used in building the simulation model are described in table 2. And a screenshot of the simulation model is shown in figure 5.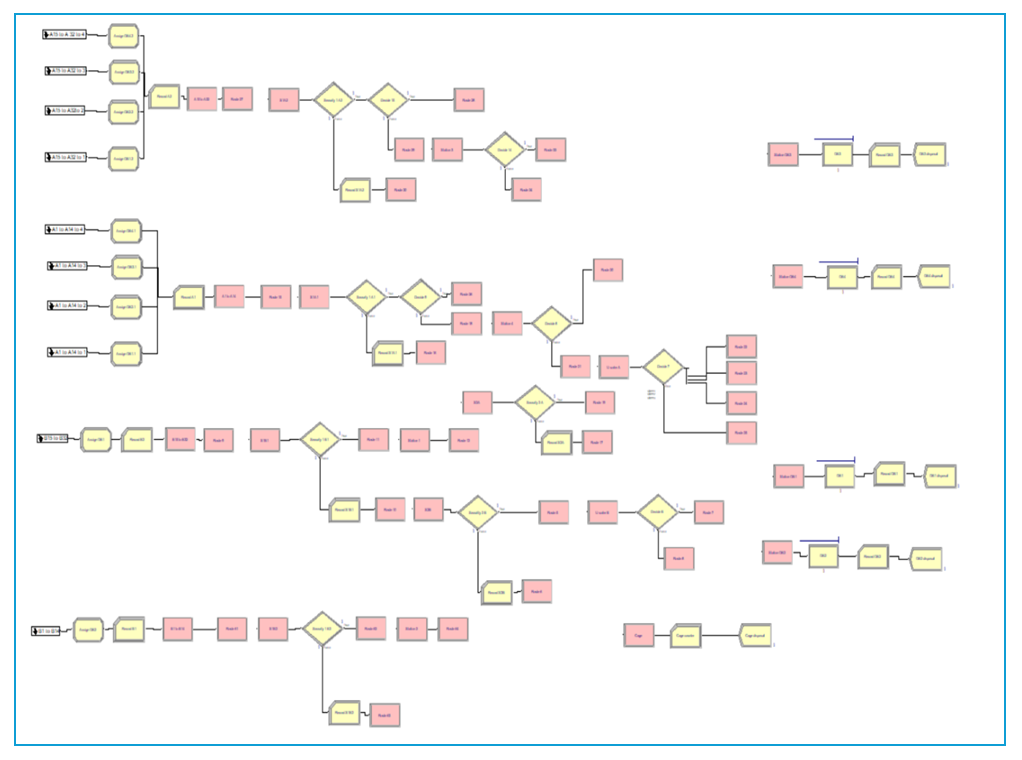 | Figure 5. A screenshot of the Areena simulation model of the BHS |
Sub-models were used for a simpler more user-friendly look for the model. The model can be divided into three parts- arrival of baggage to check-in counters, routing, and handling of baggage to the dollies. Refer to figure 5 that shows the layout of the BHS and how it was used to assist in the animation of the baggage movement which helped in the verification and validation of the model.The arrival of baggage to their designated check in counters follows a distribution discussed earlier in the “baggage arrival and probability profile” section. The distribution for the arrival of baggage is an input data in the Areena module. Moreover, the scheduled departure time (SDT) for each flight is input as the First Creation (in minutes); and the number of baggage per flight is input as the Maximum Arrivals. The routing part of the Arena model is split into three subparts, the screening, the U-sorter, and the chute station.On the scenario where the baggage gets rejected by the first security check, it is then rerouted to the manual 3D security check. Unlike the first level, there are only two stations for the manual 3D security check. Each station is for a check-in zone (A and B zones). If baggage is rejected by the manual 3D security check, it is rerouted to the cage. This is where baggage is manually inspected by handlers. However, due to lack of data on inspection time and the rarity of such scenario to happen, baggage transferred to the cage are set to exit the simulation model individually. For each of the security checks, probabilities of acceptance rates have been calculated and given by the airport OCC. Check Figure 5. As for the Arena implementation, a decision module has been used with the given acceptance rates.The U-sorter plays a major role in the baggage trafficking and flow in the BHS of QAIA. It is the hub that connects all the chutes together via automated conveyor belts. To implement the U-sorter into an arena model, a set of stations, routes, and decision modules are connected in unison to simulate the baggage flow in the BHS. However, it is not always preferred to direct baggage to the U-sorter, as it will increase the travel distance of baggage in the system and hence increase the total system time of baggage.Stations queues, resources and animation were used to represent the movement of the bags throughout the layout of QAIA. Two Arena modules were used in the handling process of the bags, the first module is the process module, and the second module is the dispose module.After the entity arrives to the chute station, it enters the process module. The logic action that was used in the process module is seize delay release, one resource with a capacity of two for each chute. The delay type represents the time needed for each worker to scan the bag, carry it and then put it in the dolly (in minutes).
4.4. Verification
For verification of the simulation model and insuring a robust, error-free technicality:1. The verification process was iterative throughout the building of the model.2. On Arena, the model cannot be run unless it is a technically correct, closed system model. And after running the model, automatically, the results of the run will show if there are any more technical issues.3. The entities entering the model were assigned with an attribute and a colour, regarding to which critical point it will be sent to; thus it is easy to track it through the system, and is easy to locate an error in the allocation if it occurs.4. The input data in the model were altered and tested in extreme conditions, to test if the expected model results will be affected.
4.5. Validation
The model was validated by running it throughout non-consecutive peak days, .and the data was compared with the actual data. Flight data were inserted into the model by selecting the flights on those peak days and selecting the right input data for those flights. Regarding the validation of the simulation model:1. The simulation model was built using the acquired data as it is (current model), and the results of the model regarding the distribution to critical points was compared to the outputs in the data spreadsheets, and the ratios matched.2. The results of running the current model simulation as compared to the input data regarding the number of bag outputs matched by an error of 1%.3. The current model's skeleton was used and altered upon to create the various scenarios discussed later, to insure their validity.
5. Results and Discussions
The goal of this study is oriented around creating a simulation model that can act as a tool for enhancing the decision making in the baggage handling process, furthermore, the model can assist in the design phase of recommended models and alternative targeted alterations within the processes. A sensitivity analysis was performed under four different scenarios, providing examples of the flexibility and capability of the structured Arena model.The key performance measures that were used in the comparison between the different scenarios and in the sensitivity analysis are the average and maximum number of entities in queue, and the average and maximum entity waiting time. The daily distribution of baggage on the chutes cannot be used as a valid performance measure because of the misdistribution of baggage should be on scope of an hourly basis (e.g. OB1 chute can have a high proportion of baggage at a certain hour but the overall distribution of baggage on OB1 is balanced).
5.1. Scenarios
In order to be able to compare the varying outcomes between different logic rules, four different scenarios have been suggested. The as-is model (that is currently used in the airport), number in queue decision model, complex decision model, and a model where all flights use the direct sortation allocation method.
5.1.1. Scenario 1: As-is State
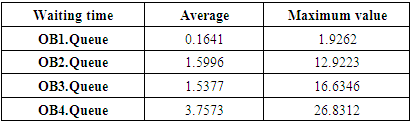
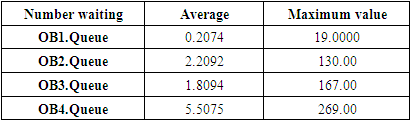
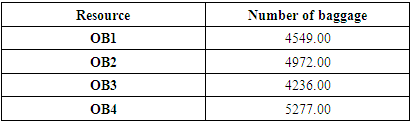
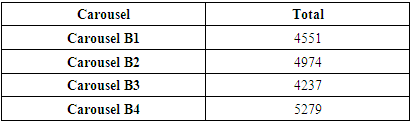
This state illustrates the exact behavior used currently by the OCC in QAIA, the skeleton of this model is used as the base foundation for the other states. The decisions and allocation of the daily flights are predetermined by an expert in the OCC room a day prior. These results were used in the validation process of the model, where they were compared to the actual data provided by the airport operator. Table 4 shows the actual data provided by the airport for the distribution of baggage on the 19th of August, 2022.
5.1.2. Scenario 2: Allocating Full-Sortation Flights to Chute with Minimum Number of Baggage
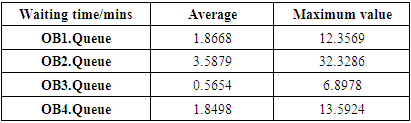
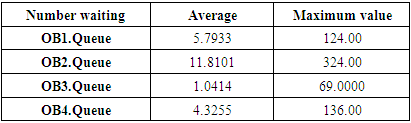
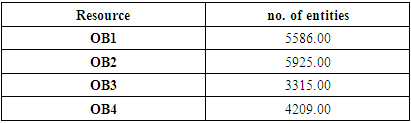
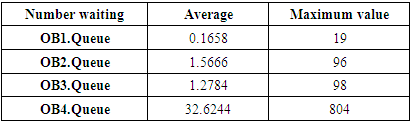
In this scenario a decision module was added with an expression, this expression is used to assign the incoming flights from A1-32 counters to one of the four chutes according to the least number of entities waiting in the chute at the moment of entry of the first baggage from a certain flight, allowing for an even distribution of flights along the four chutes depending on their current capacity, B1-32 counters are left for direct-sortation and will proceed to the chutes OB1 and OB2 which are directly connected to them. This scenario shows an overall increase of 0.8112 minutes on the average waiting time (11.49% ↑) and an overall increase of 13.2368 average number of entities waiting on all chutes. (135.99% ↑). As for the maximum value for each KPI, the as is model shows 26.831 and 261 for the maximum waiting time and the maximum number of entities on a chute respectively; compared to 32.3286 and 324 on this scenario. the baggage that follows the first entity. (i.e. it is not predictive to the state of the system after assigning a flight to the chute). This proves that the methodology of decision making in this model is flawed. After further study, it was found that the since the first entity decides where the flight baggage is assigned. This scenario does not take into account the rest ofTable 1. Scenario 1 Results (waiting time)
 |
| |
|
Table 2. Scenario 1 Results (number waiting)
 |
| |
|
Table 3. Scenario 1 Results (number of bags)
 |
| |
|
Table 4. actual data provided by the airport for the distribution of baggages on August 19th
 |
| |
|
Table 5. Scenario 2 : Results (waiting time)
 |
| |
|
Table 6. Scenario 1 Results (number waiting)
 |
| |
|
Table 7. Scenario 1 Results (number of bags)
 |
| |
|
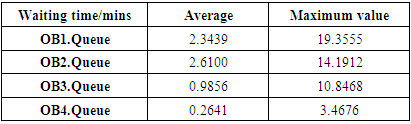
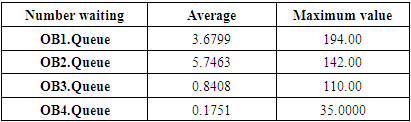
5.1.3. Scenario 3: Allocating Full-Sortation Flights to Chutes with a Modified Decision
In this scenario, unlike the previous scenario a predictive decision making expression was used, where it took into account the entirety of the flight baggage when allocating to a chute. A global variable was added for each chute which indicates to its current state after the addition of the baggage from each flight. These variables (for each chute) where used in the decision module expression. This scenario shows an overall decrease of 0.8551 minutes on the average waiting time (12.11% ↓) but an overall increase of 0.7086 average number of entities waiting on all chutes (7.28% ↑). As for the maximum value for each KPI, the as is model shows 26.831 and 261 for the maximum waiting time and the maximum number of entities on a chute respectively; compared to 19.3555 and 194 on this scenario.Table 8. Scenario 3: Results (waiting time)
 |
| |
|
Table 9. Scenario 3: Results (number waiting)
 |
| |
|
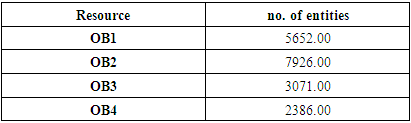
Table 10. Scenario 1 Results (number of bags)
 |
| |
|
Out of all the scenarios studied, this scenario proved to be the most optimal. Because it follows a predictive optimization algorithm in the decision making process of the chute allocation in the BHS.
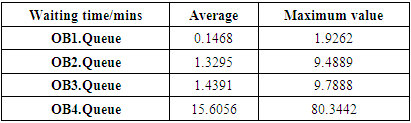
5.1.4. Scenario 4: Direct-Sortation of All Flights
In this scenario neither the expert guidance nor a decision module were used, instead bags will travel from the check-in counters and move directly to their connected chutes, bags from A1-15 and A16-32 will move directly to OB4 and OB3 respectively, where bags from B1-16 and B16-32 will move directly to OB2 and OB1 in the same manner.This scenario can show the correlation of the baggage distribution on each chute, to the flight check-in counter distribution without any interference (how the system naturally works). This scenario shows an overall increase of minutes 11.4623 on the average waiting time (162.39% ↑) and an overall increase of 25.9017 average number of entities waiting on all chutes (266.11% ↑). As for the maximum value for each KPI, the as is model shows 26.831 and 261 for the maximum waiting time and the maximum number of entities on a chute respectively; compared to 80.3442 and 804 on this scenario. This shows that the check-in counter distribution of flights is uneven in the airport.Table 11. Scenario 4: Results (waiting time)
 |
| |
|
Table 12. Scenario 4: Results (waiting)
 |
| |
|
Table 13. Scenario 4: Results (number of bags)
 |
| |
|
5.2. Sensitivity Analysis
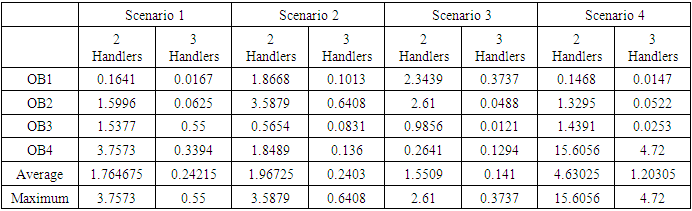
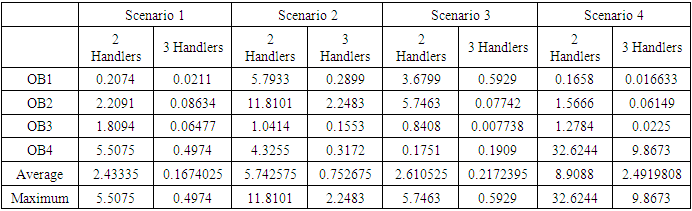
In this study a sensitivity analysis is performed in order to present the options that can be used as indicating tool in this model. They are not to be mistaken for definite solutions for particular problems, they only represent a guiding insight to where problems might be generating from. The below analysis was performed on the flight schedule for the 19th of August-2022, this day represent the highest day of congestion within the year 2022. There are many ways to increase the capacity of BHS sorter, for example, increasing the number of chutes, adding extensions within the chute to increase it length, these solutions although applicable can sometimes be infeasible due to cost and design restrictions, an approach can be considered by increasing the number of handlers at the load-off area on each chute, this will prevent any possible congestion at the output of the BHS process.A sensitivity analysis was performed to visualize the impact and effects of increasing the number of handlers on each chute. Table 14 shows the results of running each scenario -on 2 handlers versus 3 handlers for the average waiting time.Table 14. Scenario 4: Results (waiting time) shows the results of running each scenario -on 2 handlers versus 3 handlers for the average waiting time
 |
| |
|
Table 15. Shows the results of running each scenario on 2 handlers versus 3 handlers for the maximum waiting time
 |
| |
|
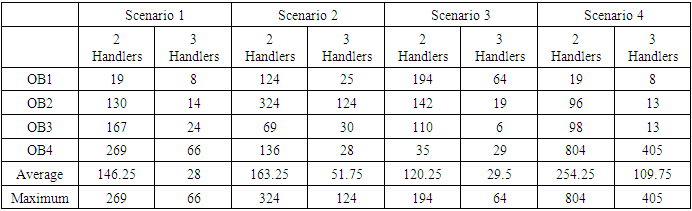
Table 16. Shows the results of running each scenario on 2 handlers versus 3 handlers for the average number of entities in queue
 |
| |
|
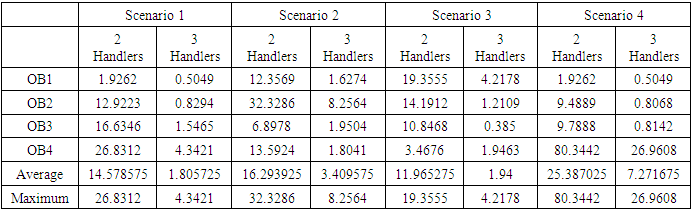
Table 17. Shows the results of running each scenario on 2 handlers versus 3 handlers for the maximum number of entities in queue
 |
| |
|
6. Conclusions
For this project, the main objective has been to build a valid simulation model that could animate the actual baggage handling process for departure baggage in QAIA and give the optimum scenario to improve the KPI. The motivation of this model is to understand how the BHS work and follow the bags journey the moment it enters the system until it leaves, including every activity that the bag goes through.Four scenarios, which reflect different states of the baggage handling system (BHS), have been created to analyze how sensitive the process is to various operational changes during different states of the BHS. Sensitivity analysis is performed to give the reader an idea of how sensitive the model is to different inputs. Results from the analysis show how the BHS handler capacity can be increased with a better load balance. The as-is model is designed to be used at a strategic level of planning. However, possible applications of the model, encourage further developing. With some slight adjustments, it will be feasible to use the model on a more operative level. Then, extending the model with optimization algorithms will allow the airport operator to use the simulation model to predict the baggage flow for the next day on different scenarios as mentioned in chapter 5 and then choose the most optimal scenario.Establishing a general model for airports will need a lot of data gathering for both implementation and validation. So another interesting area of further research is to study baggage handling processes at other airports to see how general they are and what are airport specifics.”
ACKNOWLEDGEMENTS
A special thanks to Sarah Sharayri, Miqdad Dali, Mohammad Fakhouri, and Hamzeh Toghoj for their valuable contribution in this project. We would like to declare our deepest appreciation to the AIG group staff in the OCC room in Queen Alia International Airport, as they have provided every piece of confidential information that was crucial to the construction of our simulation model.
References
| [1] | Smith, J., & Jones, M. (2019). Components of Baggage Handling Systems: A Comprehensive Overview. Airport Technology, 24(3), 78-85. |
| [2] | Chen, L., Zhang, W., & Li, Z. (2020). Application of Automation Technology in Airport Baggage Handling System. In 2020 IEEE 3rd International Conference on Information Systems and Computer Aided Education (ICISCAE) (pp. 435-439). IEEE. |
| [3] | Berechman, J., & de Neufville, R. (2015). Airport passenger screening with innovative baggage handling. Transportation Research Part C: Emerging Technologies, 52, 110-122. |
| [4] | Kaspersen, K., et al. (2019). Modeling and optimization of baggage handling systems at airports. Procedia CIRP, 83, 242-247. |
| [5] | Rao, A. V., Kotha, R., & Nimmagadda, K. (2018). Challenges and Solutions in Airport Baggage Handling System: A Review. International Journal of Research in Engineering and Technology, 7(10), 142-147. |
| [6] | Chowdhury, M. S., & Yilmaz, M. M. (2021). Baggage Handling System in Airport Operations: A Comprehensive Review. Transportation Research Procedia, 54, 443-450. |
| [7] | Golightly, A., & Taylor, P. (2022). Enhancing Baggage Handling Efficiency through RFID Technology. Journal of Air Transport Management, 98, 103249. |
| [8] | Wang, Y., Zhang, Q., & Li, W. (2023). Predictive Maintenance of Baggage Handling Systems Using Machine Learning Algorithms. IEEE Transactions on Industrial Informatics, 19(4), 2568-2577. |
| [9] | Jiang, X., & Li, J. (2024). Future Trends in Baggage Handling Systems: A Review Journal of Advanced Transportation, 2024, 8821465. |
| [10] | Kumar, A., & Singh, R. K. (2022). Sustainable Solutions for Baggage Handling Systems in Airports. Journal of Cleaner Production, 333, 130063. |
| [11] | Lin, J. T., Shih, P. H., Huang, E., & Chiu, C. C. (2015, March). Airport baggage handling system simulation modeling using SysML. In 2015 International Conference on Industrial Engineering and Operations Management (IEOM) (pp. 1-10). IEEE. |
| [12] | Frey, M., Kiermaier, F., & Kolisch, R. (2017). Optimizing inbound baggage handling at airports. Transportation Science, 51(4), 1210-1225. |
| [13] | Cavada, J. P., Cortés, C. E., & Rey, P. A. (2017). A simulation approach to modelling baggage handling systems at an international airport. Simulation Modelling Practice and Theory, 75, 146-164.. |
| [14] | Hafilah, D. L., Radja, A. C., Rakoto-Ravalontsalama, N., & Lafdail, Y. (2017, December). Modeling and Simulation of baggage handling system in a large airport. In The 18th Asia Pacific Industrial Engineering and Management System Poulos, H. G., 1971, Behavior of laterally loaded piles-I: Single piles., J. Soil Mech. and Found. Div., 97(5), 711–731. |

 Abstract
 Reference
 Full-Text PDF
 Full-text HTML