-
Paper Information
- Paper Submission
-
Journal Information
- About This Journal
- Editorial Board
- Current Issue
- Archive
- Author Guidelines
- Contact Us
American Journal of Operational Research
p-ISSN: 2324-6537 e-ISSN: 2324-6545
2015; 5(5): 111-124
doi:10.5923/j.ajor.20150505.02

Recurrent Type Fuzzy Time Series Forecasting Method Based on Artificial Neural Networks
 Abstract
 Reference
 Full-Text PDF
 Full-text HTML
Cem Kocak1, Erol Egrioglu2, Ufuk Yolcu2
1School of Health, Hitit University, Çorum, Turkey
2Department of Statistics, Giresun University, Giresun, Turkey
Correspondence to: Erol Egrioglu, Department of Statistics, Giresun University, Giresun, Turkey.
| Email: |  |
Copyright © 2015 Scientific & Academic Publishing. All Rights Reserved.
This work is licensed under the Creative Commons Attribution International License (CC BY).
http://creativecommons.org/licenses/by/4.0/

The approaches of fuzzy time series are used commonly for the analysis of real life time series whose observations include uncertainty. Because of the fact that forecasting methods of fuzzy time series do not need many constraints in the approaches of classic time series, the interest towards this method is increasing. The forecasting methods of fuzzy time series in the literature focus on the models connected to the fuzzy autoregressive (AR) variables. In the models in which the methods of classic time series are used, there are not only autoregressive variables of time series but also moving average (MA) variables of time series. However in the forecasting method of fuzzy time series proposed in the literature, there are no using of MA variables except for only two studies. In this study, by defining a new first-order forecasting model of fuzzy time series which include not only fuzzy AR variables but also MA variables, an analysis of algorithm that depends on artificial neural networks is proposed. The new proposed method is applied to Istanbul Stock Exchange (IMKB) national 100 index time series, gold prices of the Central Bank of the Republic of Turkey and two simulated chaotic time series and compared with the other methods in the literature with regard to forecastingperformance.
Keywords: Fuzzy time series, Forecasting, Fuzzy sets, Feed forward neural Networks, ARMA models
Cite this paper: Cem Kocak, Erol Egrioglu, Ufuk Yolcu, Recurrent Type Fuzzy Time Series Forecasting Method Based on Artificial Neural Networks, American Journal of Operational Research, Vol. 5 No. 5, 2015, pp. 111-124. doi: 10.5923/j.ajor.20150505.02.
Article Outline
1. Introduction
- The methods of fuzzy time series are based on the theory of fuzzy set of Zadeh [28]. In the literature, Song and Chissom [21] defined several forecasting methods of fuzzy time series for the first time and classified the fuzzy time series into two types as time variant and time invariant. Also, Song and Chissom [22] proposed an analysis method based on resultant actions for the time invariant fuzzy time series. In Song and Chissom’s study [23], a similar analysis method was proposed for the time variant fuzzy time series. Although time invariant fuzzy time series were proposed for the analysis in most of the studies in the literature, there are also methods offered for the analysis of variant fuzzy time series. These studies were followed by the methods based on the tables of fuzzy group relation developed by Chen [2] which depends on Markov model presented by Sullivan and Woodall [24]. Furthermore, Hwang et al. [15], Huarng and Yu [12], Yu [26] and Yu [27] and Chen and Hwang [4] proposed first order forecasting model of fuzzy time series. In the literature, high order forecasting model of fuzzy time series have also been proposed. The first high order forecasting model of fuzzy time series was introduced by Chen [3]. Some other high order forecasting models of fuzzy time series in the literature can be listed as Aladag et al. [1] and Egrioglu et al. [8]. Huarng and Yu [13] introduced the first order forecasting models of fuzzy time series in the step of determination of fuzzy relation, as well as fuzzy time series of artificial neural networks used for the first time in the step of defuzzification in literature by Song and Chissom [23]. Moreover, Aladag et al. [1] and Egrioglu et al. [7] utilized artificial neural networks in the analysis of high order and multivariate models respectively in the step of determination of fuzzy relation. As the usage of tables of fuzzy groups relation in high order and multivariate models require quite intensive and complex actions, the usage of artificial neural networks in the step of the determination of fuzzy relation removes the complexity especially in the high order and multivariate models. The most of the studies in the literature are those in which interval length is determined intuitively, diverse interval lengths are tried and then the best forecasts are achieved. Huarng [11] showed in his study that the selection of the interval length used in the division of the universal set into equal intervals is a critical decision and directly affects the forecasting performance, and determined the optimal interval length by recommending two separate approaches based on average and distribution for the selection of the interval length. In this way, the analysis was performed in a single application without trying diverse interval lengths. Huarng [11]’s approaches base on average and rate brought systematicity to the selection of the interval length, but could not guarantee the achievement of the best forecasting performance. For this reason, there are many studies [5, 6, 8, 13, 18, 25] for the determination of the optimal interval length in a single application by using statistical theory. All of the methods of fuzzy time series developed in the literature have used forecasting models depend on AR (Autoregressive) variables except for only two studies [9,16] until year 2013. These primary studies [9, 16] are first order fuzzy ARMA type models that one of them [9] is based on particle swarm optimization and the other [16] is based on fuzzy logic relation tables. Proposed method in this study also is first-order ARMA type model which is based on artificial neural network. The main difference of the proposed method is using artificial neural network for determining fuzzy relations. The proposed method is the first method employee artificial neural network for a fuzzy ARMA type models. In the modeling of most of the real life time series, MA (Moving Avarage) variables are also required. In this regard, using only AR variables where MA variables are also required for the analysis of fuzzy time series, could remain insufficient for both in the determination of fuzzy relations and forecasting performance. Moreover, the usage of MA variables with AR variables in the analysis of fuzzy time series can increase forecasting performance because of the fact that it could give opportunity to make application with much more knowledge.In this study, for forecasting time invariant fuzzy time series, a new forecasting method of fuzzy time series based on a model including MA variables is proposed. The advantages of proposed algorithm are stated as;• The analysis depend on the forecasting model of fuzzy time series is more real method for real life time series, as it also include MA variables,• The usage of artificial neural networks in the determination of fuzzy relation remove the complexity of fuzzy logic group relation tables,• In comparison with the other methods developed in the literature, it has a higher forecasting performance.• The proposed method has better forecasting performance than other Fuzzy ARIMA methods [9, 16].• Because of using artificial neural network, unknown patterns can be easily forecasted. • It is difficult that the methods based on fuzzy relation tables are designed for high order models but the proposed method can be easily extended for high order models like Aladag et al. [1].In section 2, the main definitions related with fuzzy time series and in Section 3, main information about artificial neural networks are presented. In section 4, the forecasting model of fuzzy time series proposed is defined and the analysis of algorithm is stated. In section 5, the results of the application of proposed method with this study and other methods to Istanbul Stock Exchange (IMKB) national 100 index time series and the prices of gold (Turkey daily gold prices series can be obtained from the website of Central Bank of The Turkish Republic) are presented. In section 6, the results are discussed.
2. Definition of Fuzzy Time Series
- The definition of fuzzy time series was firstly introduced by Song and Chissom [21, 22]. General definitions of fuzzy time series are given as follows:Definition 1. Let
 , a subset of real numbers, be the universe of discourse on which fuzzy sets
  are defined. If F(t) is a collection of
  then F(t) is called a fuzzy time series defined on
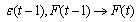
  Definition 2. Fuzzy time series relationships assume that F(t) is caused only by F(t –1), the model can be expressed as:
  | (1) |
 where
where  is the fuzzy relationship between
  and
and  Definition 3. Suppose
  is a first-order model of
  If for any t,
  is independent of t,
  then
then  is called a time-invariant fuzzy time series otherwise it is called a time-variant fuzzy time series.Definition 4. Fuzzy time series relationships assume that F(t) is caused only by F(t –1), then the model can be expressed as:
  | (2) |
3. Feed Forward Artificial Neural Networks
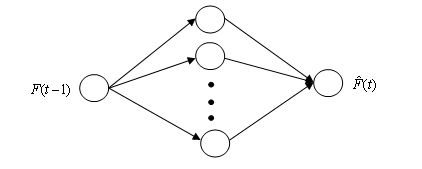
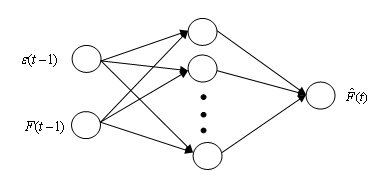
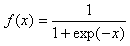
- The technology of artificial neural networks is an information processing mechanism which emerges in the simulation of human neuron and nervous system at the computer environment. The most important feature of the artificial neural networks is its ability of learning from the samples. Although artificial neural networks have simpler structure than human nervous system, it is successful in solving lots of problem such as forecasting, pattern recognition and classification [10, 20, 29].Although there are several types of artificial neural networks in the literature, only feed forward artificial neural network is used for the problem of forecasting fuzzy time series. Feed forward artificial neural network is formed of input layer, hidden layer or layers and output layer. The sample of architecture of feed forward artificial neural network is shown in Figure 1. Each layer is formed of units named as neuron and there is no relationship between the neurons belonging to the same layer. The neurons of different layers are connected to each other by their weights. In Figure 1, each weight is shown by directional arrows. In the feed forward artificial neural network, the connections shown by directional arrows are forward and one-way. In both the hidden layer and output layer of the feed forward artificial neural network, an activation function is used for each neuron. When the outputs of the neurons of the previous layer are multiplied with the related weights and these multiplication results are added to each other, the inputs that come to the neurons of hidden and output layers are formed. The information come to these neurons are passed through an activation function and the neuron output is formed. Activation function provides non-linear match. For this reason non-linear activation functions are used for the units of the hidden layer [10].
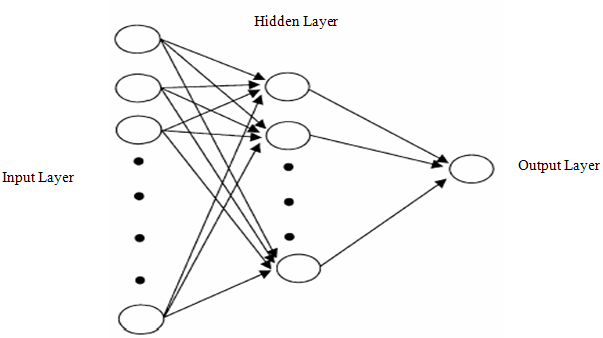 | Figure 1. Multilayer feed forward artificial neural network with one output neuron |
4. The Proposed Method
- The forecasting models of fuzzy time series proposed are the fuzzy AR (Autoregressive) type models except for only two studies [9, 16] in the literature. However, It is necessary that ARMA type models are used to many fuzzy time series in the real life. The definition of first-order ARMA (autoregressive moving average) type fuzzy time series model made by Egrioglu et al. [9] and Kocak [16] is defined below. Definition 5. Fuzzy time series relationships assume that F(t) is caused by F(t –1) and ε(t –1), then the relationship can be expressed as:
 | (3) |
 and the partitions of U
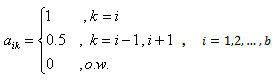
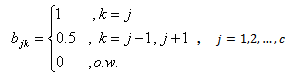
 are defined. The beginning and the ending points of universe of discourse for time series are determined. These points are selected in the way that will include the possible values of time series. Then, universe of discourse is divided into sub-intervals (partitions) according to proper interval length. In this method, the determination of the interval length depends on the researcher. It should not be forgotten that the interval length determined is effective on the number of fuzzy sets. Step 2. The fuzzy sets
  are defined in accordance with universe of discourse (U) and the sub-intervals
 | (4) |
 | (5) |
 is the input of artificial neural network,
  is target value and
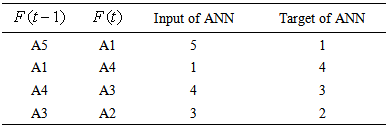
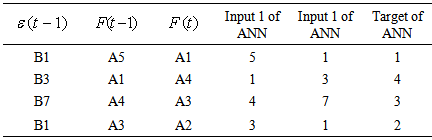
  is the output of artificial neural network. The learning samples of artificial neural network consist of the sequence number of fuzzy sets. For instance, the observations of fuzzy time series are respectively stated as A5, A1, A4, A3, A2. In Table 1, the input and the target values of artificial neural network for this example is shown. In the determination of fuzzy relation, the architectural structure of artificial neural network is given in Figure 2.
|
 | Figure 2. Architecture of ANN for determination of fuzzy relationship |
 Step 6. Deffuzzified forecasts are obtained for the time series.In this step centralization method is utilized. When the fuzzy forecast is
  deffuzzified forecast is the middle point of
  interval which has the highest membership value in
  fuzzy set. Step 7. Errors are calculated.When the deffuzzified forecast values
  obtained in the Step 6 are subtracted from the values observed in the time series
  the errors are obtained. The error series
  is calculate as,
 | (6) |
 and its sub-intervals
  are defined for the errors.The universe of discourse for the errors is defined and the universe of discourse is divided in accordance with a determined interval length. Step 9. For errors, the fuzzy sets
  are defined based on universe of discourse (V) and sub-intervals
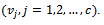
 | (7) |
 | (8) |
 is made fuzzy. Sub-interval is determined for each observation. The fuzzy set that has the highest membership value of the determined sub-interval is determined. The fuzzy value of the observation is this determined fuzzy set. Step 11. The fuzzy relations are determined by the feed forward artificial neural network (FANN). In the determination of relation by the feed forward artificial neural network, one lagged fuzzy variable
  and one lagged fuzzy error series
  are the inputs of artificial neural network,
  is target value and
  is the output of artificial neural network. The learning samples of artificial neural network consist of the sequence number of fuzzy sets. For instance, the observations of fuzzy time series are respectively stated as A5, A1, A4, A3, A2 and the observations of fuzzy error series are respectively stated as B1, B3, B7, B1, B4. In the table below, the input and the target values of artificial neural network for this example is shown.
|
 | Figure 3. Architecture of FANN for determination of fuzzy relationship |
 Step 13. Defuzzified forecasts are obtained. In this step centralization method is used. When the fuzzy forecast is
  defuzzified forecast is the middle point of
  interval which has the highest membership value in
  fuzzy set.
 5. Application
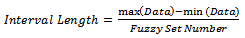
- In the application, two different real world data sets and two simulated chaotic data sets were used. The real world time series are data of Istanbul Stock Exchange and the prices of Gold. In the application of the proposed method and the methods in the literature, the fuzzy set number of the time series was increased by 1 unit between 5 and 35 and 31 different fuzzy set numbers were tried. If the method requires calculating according to interval length, the interval lengths are determined by using the formula given in the way that the fuzzy set numbers are between 5 and 35.
 | (9) |
 | (10) |
 | (11) |
 | (12) |
 | (13) |
5.1. Analysis of IMKB Data in the Period of 01.10.2010 - 23.12.2010
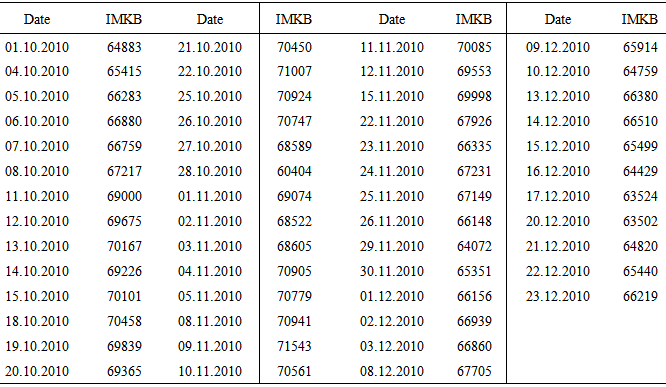
- The first data used for comparing the future forecasting performances of the methods is IMKB close prices time series with 53 observations between the dates of 01.10.2010 - 23.12.2010 as seen in Table 3 and Figure 4.
|
 | Figure 4. IMKB time series graph in the period of 01.10.2010 - 23.12.2010 |
 | Table 5. The forecasts and performances of 7-observation test set for IMKB data |
 | Figure 5. The graph of 7-observation test set and the forecasts obtained by using proposed method for IMKB data |
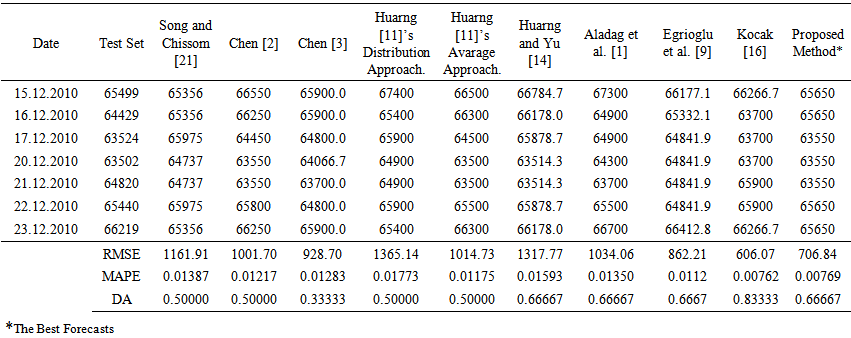
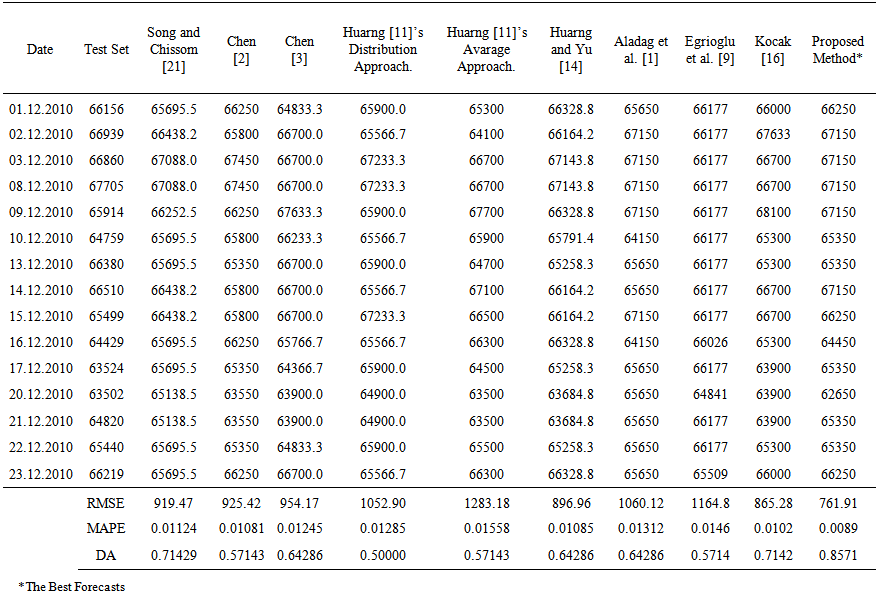 | Table 6. The forecasts and performances of 15-observation test set for IMKB data |
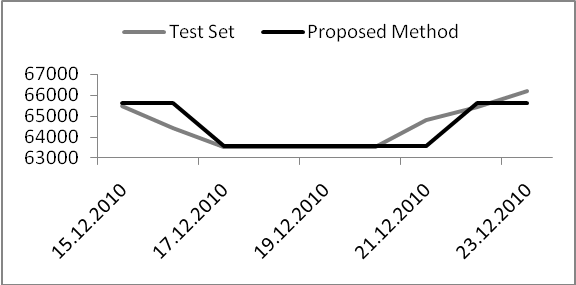
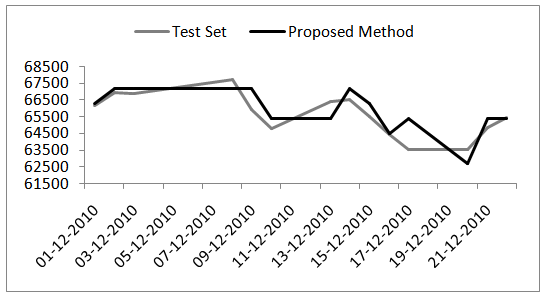 | Figure 6. The graph of 15-observation test set and the forecasts obtained by using proposed method for IMKB data |
5.2. Analysis of Gold Prices
- The second data used for comparing the future forecasting performances of the methods is the time series of the gold prices with 248 observations between the dates of 02.01.2009 - 31.12.2009, which were taken from the website of the Central Bank of the Republic of Turkey as seen in Table 7 and Figure 7.
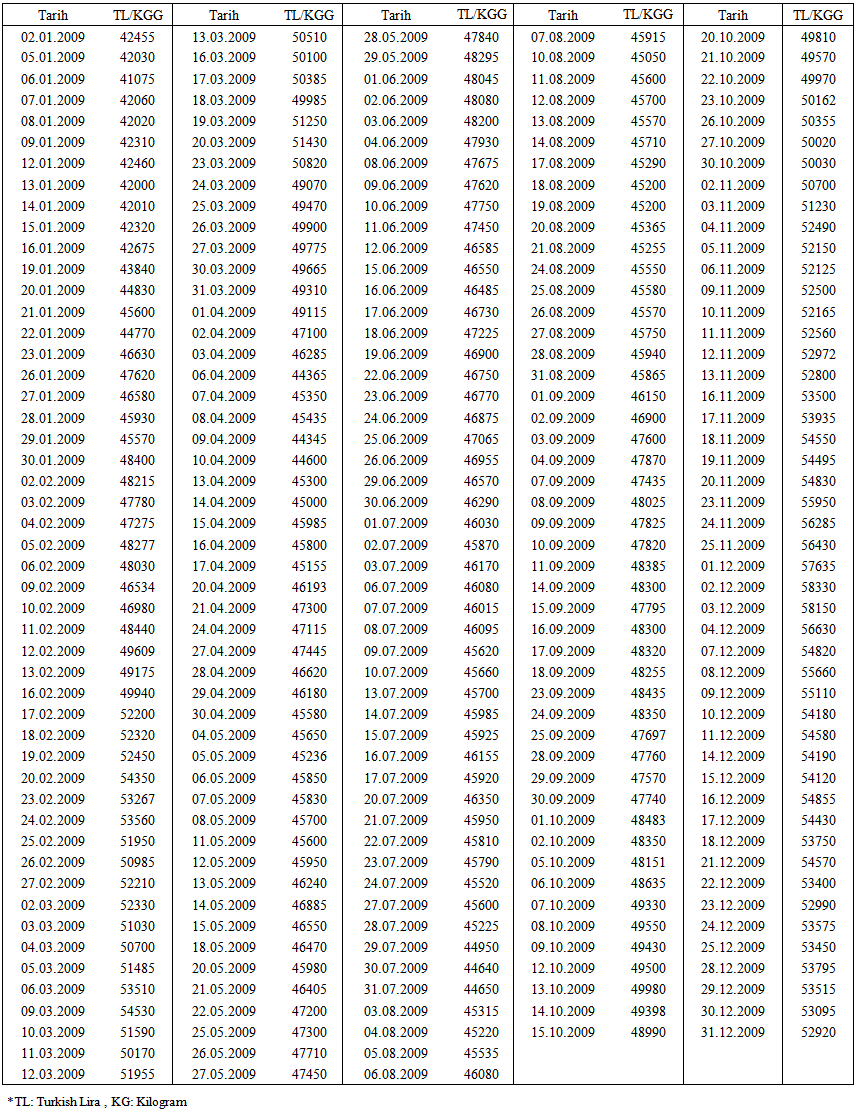 | Table 7. The gold prices of 2009 |
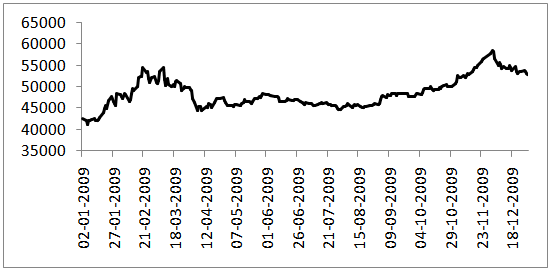 | Figure 7. The gold prices graph of 2009 |
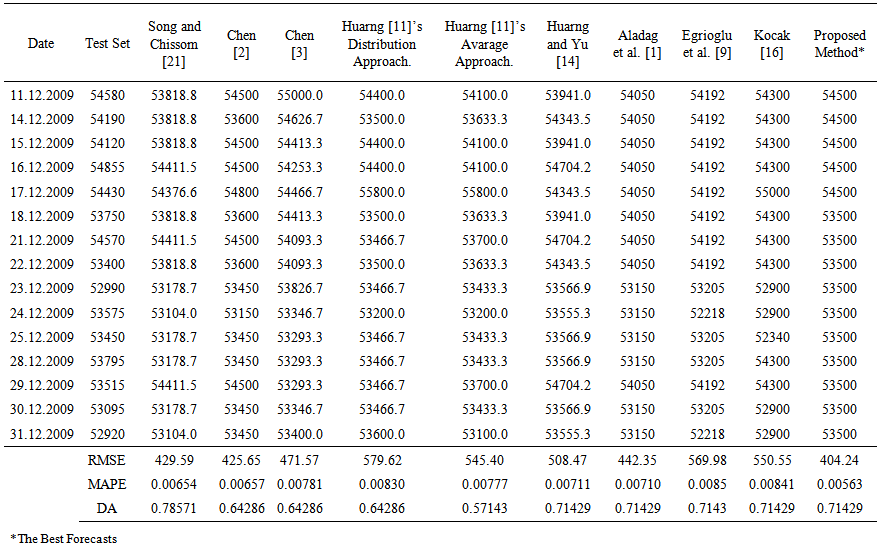 | Table 8. The forecasts and performances of 15-observation test set for Gold Prices |
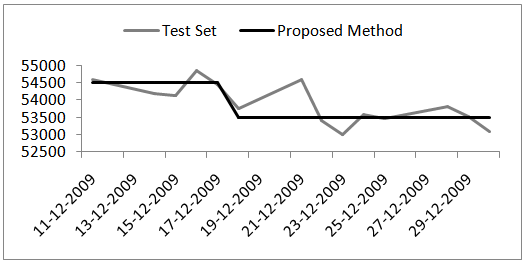 | Figure 8. The graph of 15-observation test set and the forecasts obtained by using proposed method for gold prices |
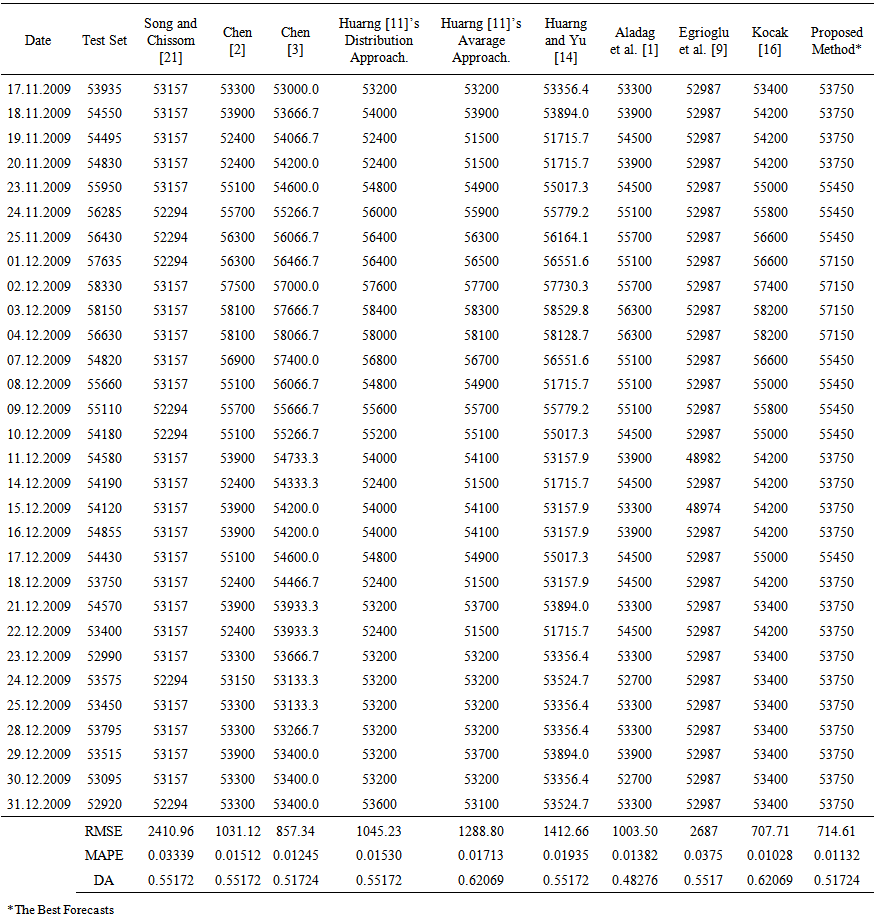 | Table 9. The forecasts and performances of 30-observation test set for gold prices |
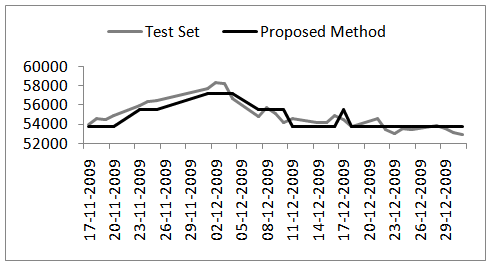 | Figure 9. The graph of 30-observation test set and the forecasts obtained by using proposed method for gold prices |
 | (14) |
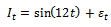
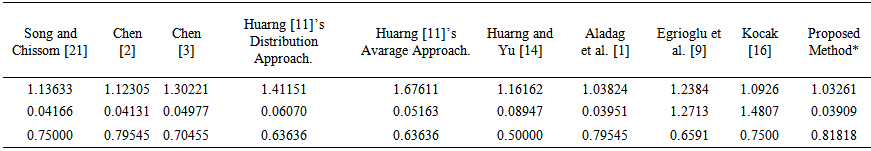 | Table 10. Application results for first simulated time series |
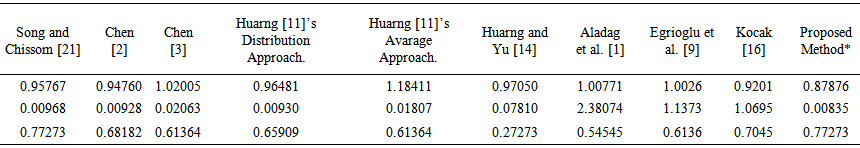 | Table 11. Application results for second simulated time series |
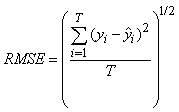
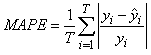
6. Discussion and Conclusions
- The models used in the classical time series methods include not only Autoregressive (AR) variables, but also Moving Average (MA) variables. However, the forecasting models of the fuzzy time series proposed in the literature do not included MA variables except for two studies. In this study, an analysis algorithm based on the artificial neural networks was proposed by identifying a new fuzzy time series forecasting model of ARMA(1,1) type that includes the fuzzy MA variables along with the fuzzy AR variables. In the proposed method, finding MA variable reveals a more realistic approach since the majority of the real life time series should be analyzed by using the models including MA variables. Furthermore, it was seen as a result of the application that the inclusion of MA variables into the model increases the forecasting performance. Moreover, it is remarkable that the proposed method has considerably high direction accuracy (DA) as well as it provides lower RMSE and MAPE values than the other methods in the literature. In the proposed method, the use of feed forward artificial neural networks at the step of determining the fuzzy relation make easer the process of determining the fuzzy relation. In the future studies, it can be ensured that the proposed method has more systematical and higher forecasting performance through the improvements to be made at various steps.