-
Paper Information
- Paper Submission
-
Journal Information
- About This Journal
- Editorial Board
- Current Issue
- Archive
- Author Guidelines
- Contact Us
American Journal of Operational Research
p-ISSN: 2324-6537 e-ISSN: 2324-6545
2015; 5(3): 64-73
doi:10.5923/j.ajor.20150503.03
Modeling and Simulation of an Inventory System - A Case Study of HOMES 71 LTD, Bangladesh
 Abstract
 Reference
 Full-Text PDF
 Full-text HTML
K. M. Salah Uddin, Nymatul Jannat Nipa, Abu Raihan Rume
Department of Management Information Systems, University of Dhaka, Dhaka, Dhaka, Bangladesh
Correspondence to: K. M. Salah Uddin, Department of Management Information Systems, University of Dhaka, Dhaka, Dhaka, Bangladesh.
| Email: |  |
Copyright © 2015 Scientific & Academic Publishing. All Rights Reserved.
The present paper investigated an inventory problem that was experienced in real estate company of Homes 71 Ltd. It deals with inventory systems modelling and simulation to analysis the inventory cost of single item inventory of HOMES 71 Ltd. in Bangladesh. We conducted a stochastic simulation and experimental study for reducing inventory cost and optimizing service levels in distribution of inventory. At first experimental data was developed with the help of MS excel from company's record log book. Then a simulation of the inventory systems was created with the help of programming language C++ software. Comparison was done between the results of inventory cost and service level from both experimental data and simulation data. The Comparison would came into a conclusion that a real inventory system can fully captured through a computer simulation. Finally calculation of lead time effect, re-order point effect and re-order quantity effect on both inventory cost and service level by using simulation would suggest HOMES 71 LTD. how to optimize in between service level and inventory cost.
Keywords: Inventory, Modeling, Simulation, Service Level, Inventory Cost, Optimization
Cite this paper: K. M. Salah Uddin, Nymatul Jannat Nipa, Abu Raihan Rume, Modeling and Simulation of an Inventory System - A Case Study of HOMES 71 LTD, Bangladesh, American Journal of Operational Research, Vol. 5 No. 3, 2015, pp. 64-73. doi: 10.5923/j.ajor.20150503.03.
Article Outline
1. Introduction
- The Inventory management is one of the crucial aspects for any manufacturing firm and well known topic in both corporate and academic world [1]. According to Wanke [2], inventory management involves a set of decisions that aim at matching existing demand with the supply of products and materials over space and time in order to achieve specified cost and service level objectives, observing product, operation, and demand characteristics. Inventories are stocks of resources held for the purpose of future production and/or sales. An inventory is considered as one of its major assets of a business and also represented as an investment that is tied up until the item is sold or used in the production of an item. It also costs money to store, track and insure inventory. Inventories that are not well managed can create significant financial problems for a business, whether the problem results in an inventory glut or an inventory shortage [3].Proper management of inventories would help to utilize capital more effectively [4]. Inventory management is important because it can give answer to firms about when to order, how much to order and how much stock to keep as safety stock [5, 6]. Another objective of inventory management is to minimize cost while maintaining acceptable service level [7]. The impact of product, operation and demand characteristics which constitute intervening variables in making choice of inventory management is matter of thinking [8-13]. Proper amount of stock can reduce ordering cost and improve service level, but excessive stock results in expensive inventory holding costs and occupies too much capital [14]. Modelling means constructing a model where a model is a representation of real system and working of some interested part of the system. One model should be a close approximation to the real system and incorporate most of its salient features [15]. Other hand, simulation is the imitation of real world. According to Law and McComas [16], simulation is used before an existing system is altered or a new system built, to reduce the chances of failure to meet specifications, to eliminate unforeseen bottlenecks, to prevent under or over-utilization of resources, and to optimize system performance. An organization has to choose the right inventory management model which may involve the use of simulation, scenario analysis, incremental cost analysis [17-20]. A single item economic order quantity model is going to use when the demand is stock dependent [21]. Another inventory model is to coordinate replenishment decisions across multiple items known as stochastic demand multi-item [22, 23]. Some stochastic inventory model solves problem for a two-stage supply chain consisting of a single retailer and a single supplier [24].Using simulation optimization algorithm for solving inventory problem is becoming popular day by day [25, 26]. Inventory Management Simulation is known for solving inventory problems with computer simulation software [27]. Inventory management model selection focused on production and distribution environments in which demand and lead time tend to be more predictable [28]. The software makes the use of the simulation relatively unstructured and interactive, so user can control the time and frequency of usage. User can form a computer programming model for the existing inventory system and run simulation on it to predict the provable situation of the system [29]. This article specially focuses on the single item inventory management system of the company ‘HOMES 71 LTD.’ which is a real-estate company running its business in Dhaka. The stochastic simulation model was used to realize the situations of inventory cost and service level under various parameters.
1.1. Objective of the Study
- The general objective of this study is to realize single item inventory system of HOMES 71 Limited based on different inventory parameters. The general objective can be specified into followings: •To compare the experimental results with simulation results.•To predict the effect of different parameters such as re-order point, re-order quantity, lead time on inventory cost, service level etc.
1.2. Research Methodology
- This study tried to learn about the behaviour of the inventory system of HOMES 71 LTD. For this purpose, data collection was done from the organization log books and registry books which are considered as experimental data. These data were then put in the Microsoft Excel 2013 Program to find out some parameter like average stock, average demand, service level etc. The holding cost, ordering cost and other associate costs were also calculated from the real life scenario of the organization. After that, a model inventory system which is designed based on a mathematical model and the flowchart for the simulation is created by using Microsoft Visio 2013. Computer programming language C++ is used here to generate the model inventory system and run the simulation. Finally the major parameters like the lead time, the re-order point and the re-order quantity is varied to observe how the inventory cost and service levels are changed. The obtained results are recorded and the comparisons of changed parameters are shown in a table and graphical chart representation.
1.3. Limitations of Study
- The real-estate business uses a lot of items in its day to day activity; there are several types of items which are used once in a project life time. In this research, only one item (cement bag) was considered which are used in a regular basis that generates inventory cost. So this is not a complete overview of the inventory system of ‘HOMES 71 LTD’, but a representation of it.
2. Background of ‘HOMES 71 LTD.’
- HOMES 71 LTD. is a real estate company came into being in July 2009. HOMES 71 LTD. believes in doing something unique for others and remains in their dreams. Its guiding principle is the quality, commitment and punctuality. It has crossed a distance in the field of real estate which may not be very long but it was full of experience and success. From this short path of its journey HOMES 71 LTD. have gain enough appreciation from its valuable land owners, buyers and well-wishers. Knowing that there is no end of perfection and excellence; HOMES 71 LTD is doing its best to bring maximum satisfaction among the clients by its relentless effort and care.The Company's operations encompass various aspects of real estate development, such as land identification and acquisition, project planning, designing, marketing and execution. At present, its focus is on the development of luxury residential projects and integrated townships including low housing projects in Dhaka.
3. Data Collection Methodology of Homes 71 Limited
- Understanding the recording of data of the inventory system will help to realize the data collection procedures of HOMES 71 LTD. The record keeping system of the store in Homes 71 limited is still evolving. The requisitions that came from the site or office are kept in a record book or log book. Individual projects have their individual record book which is updated on regular basis. A store in-charge is responsible to keep all this data updated every day.When an item is provided then it is deduced from the total inventory from that item log book. The last stock amount is kept under observation that if it crosses the re-order point then new order can be placed to maintain the minimum stock. After crossing the re-order point an order is placed to fill the product line again. Thus when the material arrives the item log book is updated to the present stock.In this research, the data have been analysed is collected from the store record book. Among lots of varieties of items one item was chosen- an expensive item which is Cement Bag. This item is used frequently in this organization in the construction work. It is kept in the stock of the store and also has holding costs. The item has fixed Re-order Point and Re-order Quantity. Besides these item is frequently ordered and mostly used. So Cement Bag as an item is quite a representative of the inventory system of ‘HOMES 71 Ltd.’.
3.1. Model Development
- Developing simulation of inventory systems is not as difficult as inventory systems have some established parameters.To run the simulation of an inventory system some mathematical models should be considered first. To build these mathematical models, some assumptions should be sorted out too. Along these assumptions, models could perform well. The assumptions are as below:1.The demand is random and it follows normal distribution 2.The mean of the data is at list 3.5 times of the standard deviation of the data.3.The lead time is constant. 4.The reorder point and re order quantity are also constant.5.There is no sudden change in the system.A model was created after collection of experimental data. Probability normal distribution was used here to predict the probalistic demand. Use of C++ coding was conducted to find a model database for it.
3.2. Flowchart for Simulation
- While developing a computer Program it is always helpful to draw a flow chart of the Program logic as in shown below. The variable used in this flowchart is defined as below:
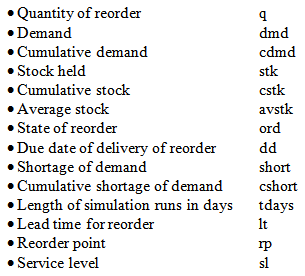 The Flowchart of computer programming is shown in the figure 1.
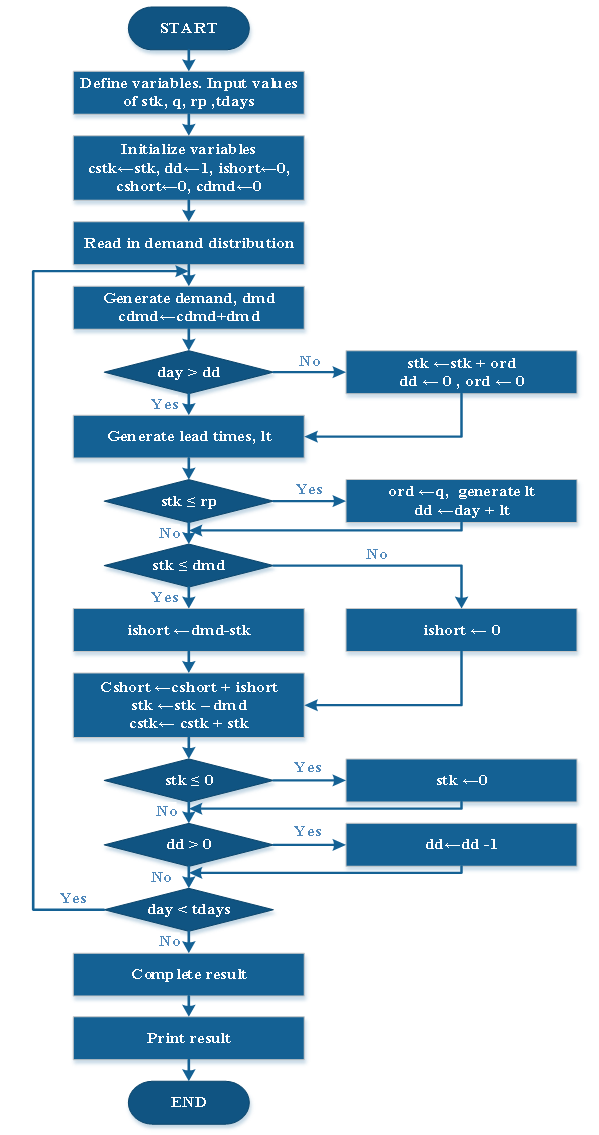 | Figure 1. Flowchart for model creation |
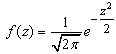
3.3. Normal Probability Distribution
- To predict probabilistic demand, the normal probability distribution was used in this article. The normal probability density function is symmetric about its mean value and is completely characterized by its mean value µ and standard deviation σ. If the transformation z = (x-µ)/σ is made, the distribution is transformed to a form in which the mean is 0 and the standard deviation is 1. In this form, the probability density function is
 It is customary to create generators that determine numbers distributed according to the function f(z) and to derive the variable x that has mean µ and standard deviation σ by the transformation
 The variable z is usually called the standard normal variant.Neither the cumulative distribution function nor this inverse can be expressed in terms of simple mathematical functions. But approximation methods are available for the generation of standard normal variants. A very useful approximation method derives. Normally distributed random numbers by summing several uniformly distributed random numbers,
  according to the following formula:
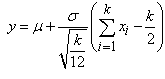 The distribution of a sequence of numbers derived from this formula approaches a normal distribution with mean zero and standard deviation 1 as k approaches infinity. We consider small values of k give good accuracy. A convenient value of k is k = 12, in which case, the formula takes the form
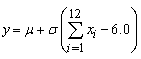 This is a direct method of deriving normally distributed random numbers, based upon the properties of random numbers rather than sing the inverse transformation method [30].
3.4. Analysis of Inventory Cost
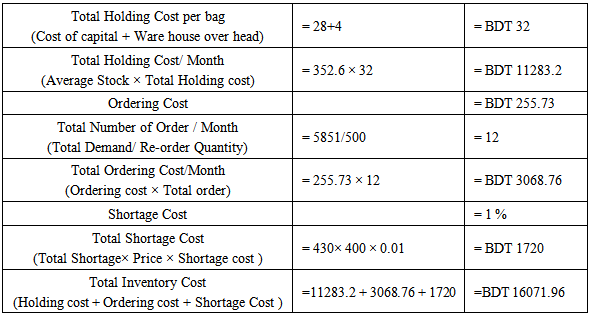
- The costs evolved in inventory systems are classified into three types.Re-order Cost or Set up Cost: it is the administrative cost associated with the placing of the order.Inventory Carrying Cost or Inventory Holding Cost: It is the cost of maintaining the inventory, which includes storage charges, insurance, interest of tied capital, etc.Shortage Cost: This cost is incurred when the system runs out of stock. This results in loss of profits as well as loss of good will and reputation.Some other terms should be kept in mind to analyse the inventory system. Price of an item: The purchase cost or price of an item includes the basic price of an item plus the taxes and transportation costs if any. Lead Time: This is the time lag between the placing of order and obtaining the delivery of items. It is also called delivery log.Service Level: The service level for an inventory system is a measure of the customer satisfaction and may be defined as the ratio of units furnished to customers to the total number of units demanded by the customers [31]. The problem is then to determine the optimal ordering quantity and reorder point that minimizes the total annual system cost composed of the setup, holding costs. Unfortunately, the exact formulation of the average inventory holding cost is not easy to formulate and compute, and hence several approximation formulations have been proposed in the literature. Average demand, average stock, total consumption, total ordering cost, service level etc were found by putting those data into MS Excel program [30, 32].The general equation for the Monthly holding cost for the average inventory of total units is as follows: • Monthly Holding Cost = (Average Inventory) × (Monthly Holding Cost per Unit)To complete the total cost model, we must now include the monthly ordering cost. The goal is to express the monthly ordering cost in terms of the order quantity. The general equation for the ordering cost is as follows. • Monthly ordering cost= (Number of Orders per month) × (Cost per order)The shortage cost are also associated here which will results in loss of profits as well as loss of good will and reputation. This may be considered as time delay problem. This may be a percentage of total cost.Thus, the total Monthly cost can be expressed as follows-• Total Monthly Cost = Monthly holding Cost + monthly ordering Cost + monthly shortage
4. Findings and Analysis
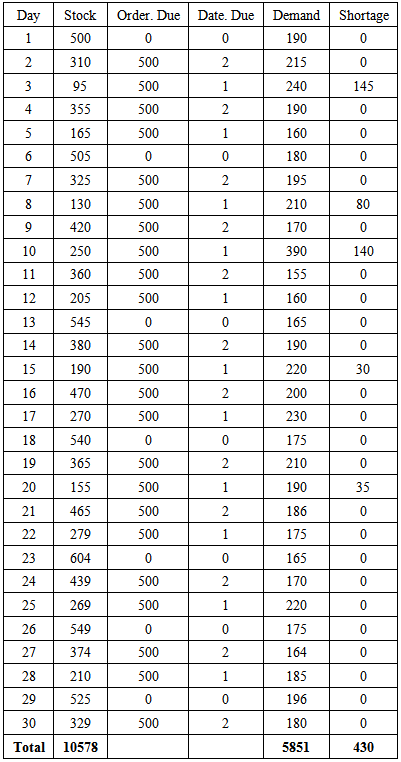
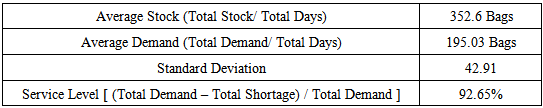
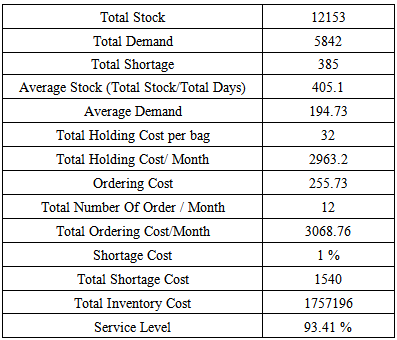
- The Cement Bag Data:The following table contains the experimental data of 30 days for Cement Bags, collected from Homes 71 ltd. Here initial stock is 500 bags, the Re-order point is 500 Bags and the Re-order quantity is also 500 Bags with a Lead time of 2 Days.Now, Table 4.1 is the collection of 30 days of data that was composed form the organization. From Table 1 we can draw a summary as below:
|
|
|
4.1. Simulation Result Analysis and Model Validation
- After creating a model inventory system for the Cement Bag, simulation was performed with the help of computer programming C++ and following data were found. Here also the initial stock is 500 bags, the Re-order point is 500 Bags and the Re-order quantity is also 500 Bags with a Lead time of 2 Days.From the figure of simulated data we bring the summary report as below.So, from the simulated data of Table 4.4, Total Inventory Cost is found which are BDT 17571.96 and the Service Level 93.41%. Recalling the experimental data from calculation of previous section, there found the Total Inventory Cost was BDT16071.96 and the Service Level was 92.65%. Thus comparing both experimental data and the simulated data it is established that, this mathematical model successfully represent the original system.
|
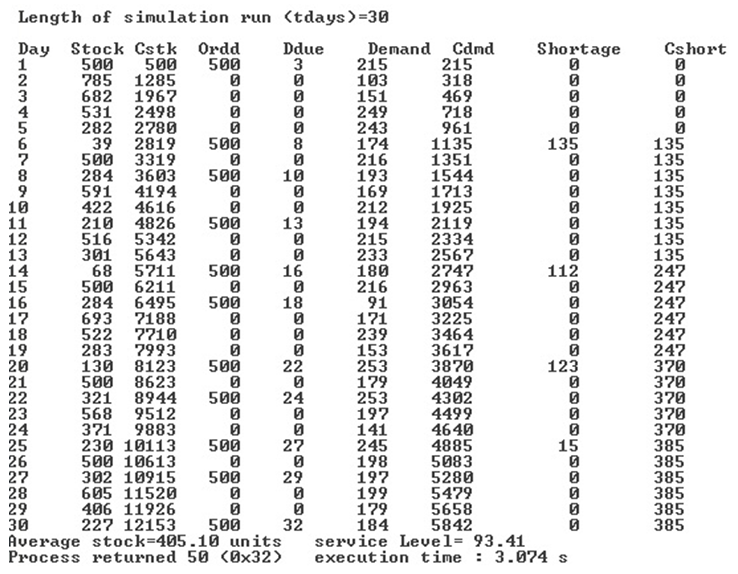 | Figure 2. Simulated data for Cement Bag |
4.2. Analysis of Model Inventory
- As the model inventory is ready, the simulation can be implemented by varying its various parameters. Here the most important parameters are the lead time, the re-order point and the re-order quantity. Now varying those parameters with in possible range, various situations can be observed in the inventory system. The total inventory cost and service level will be at focus point as the organization works closely with both of them.
4.2.1. Lead Time Effect
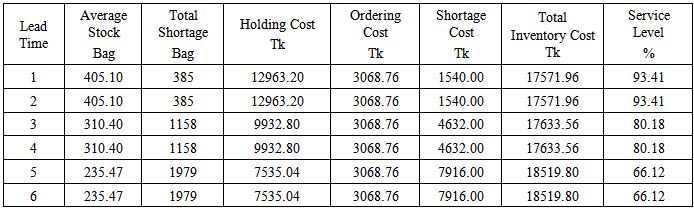
- By varying the lead time and keeping the other parameters same, the Lead time effect over the cement bag inventory system can be observed.For the cement bag: Keeping Re-order point at 500 Bags & Re order Quantity at 500 Bags then observed the lead time change effect with various lead time giving as input in the simulation. Thus results are obtained in the following table.From Table 4.5 it is found that with the increase of lead time the system changes, the total inventory cost increases, where the service level decries. So it is clear that the lead time should be as low as possible to make available the ordered materials. It is also observed that with lead time increase the total shortage is increased which causes the reduction in service level. As total order number throughout the month is fixed so the ordering cost is also fixed. We can represent the change in Inventory cost and service level in a chart as below.
|
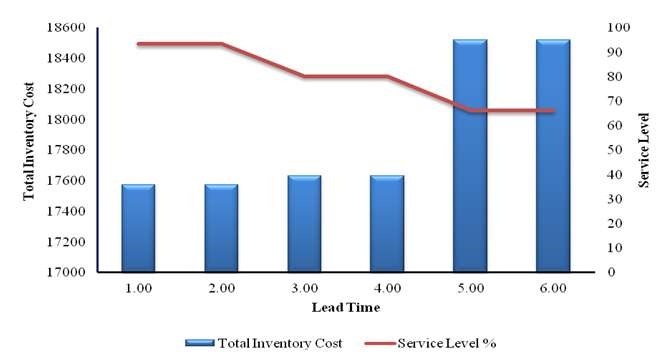 | Figure 3. The Effect of Lead Time on Inventory Cost and Service Level for Cement Bag |
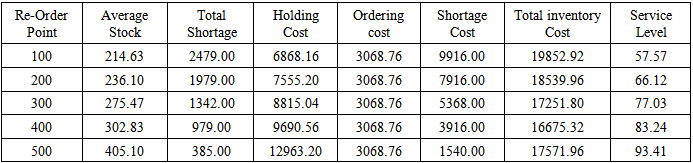
4.2.2. Reorder Point Effect
- By varying the Re-order point and keeping the other parameters same, the Re-order point effect over the cement bag inventory system can be observed. For the cement bag: Keeping Lead time for 2 Days & Re order Quantity at 500 Bags then it is going to observed the Re-order point change effect with various Re-order point giving as input in the simulation. Thus we obtained the following table.From Table 4.6, it can be said that with the increase of Re-order Point the system changes, the total inventory cost decreases but at last point it increases, where the service level gradually increases. So, a suitable area where the re-order point has a low inventory cost and high service level should be considered. It is also observed that with the increase of Re-order point, the total shortage decreases which cause the improvement of the service level. As total order number throughout the month is fixed so the ordering cost is also fixed. The change in Inventory cost and service level can be represented in a chart as below.
|
4.2.3. Reorder Quantity Effect
- By varying the Re-order quantity and keeping the other parameters same, the Re-order quantity effect over the Cement Bag inventory system could be observed. Keeping Lead time for 2 Days & Re order Point at 500 Bag then observed the Re-order Quantity change effect with various Re-order Quantity giving as input in the simulation. Thus the results were obtained the following table.From Table 4.7, it is found that with the increase of Re-order Quantity the system changes, the total inventory cost increases, where the service level fluctuates. So, a suitable area where the re-order point have a low inventory cost but high service level should be considered. It is also observed that with Re-order Quantity increase the total shortage fluctuates which cause the fluctuation of the service level. As total order number throughout the month changes with the re-ordering quantity, that’s why here, the ordering cost is not fixed here. The change in Inventory cost and service level can be represented in a chart as below.
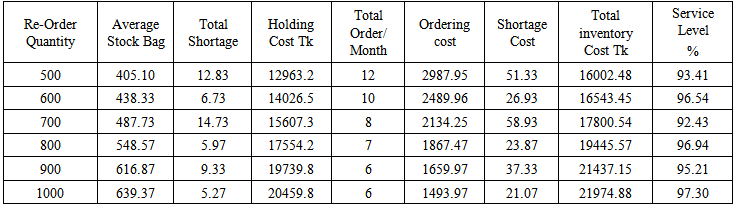 | Table 4.7. The effect of Re-order Quantity change in Cement Bag Model |
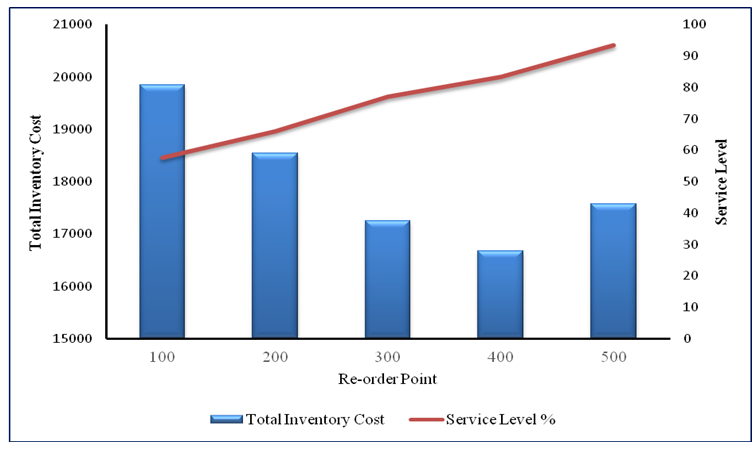 | Figure 4. The effect of Re-order Point on service level and inventory cost |
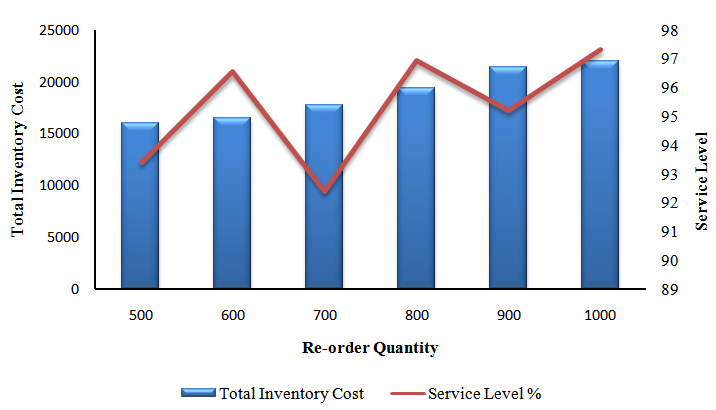 | Figure 5. The Effect of Re-order Quantity on Inventory Cost and Service Level for Cement Bag |
5. Conclusions
- In this article, a discrete event simulation of inventory system of HOMES 71 LTD is conducted to analyse the inventory system, Cement Bag as the inventory item for this analysis. Mathematical model and computer program is developed to run the simulation. Stochastic simulation model was used to predict the inventory system characterized based on different parameters such as lead time, reorder point, reorder quantity and service level.Using the recorded data average stock, total demand, standard deviation shortage and service level was calculated which is considered as experimental data. A model inventory system was successfully developed which represents the original system. With comparison of experimental data the simulation results were found excellent agreement in predicting the real situation of single item inventory. The effect of some parameters such as lead time, reorder point and reorder quantity are also observed in the inventory cost and service level. Some optimal points were found where the inventory costs remain low and the service level were maximum. This study helps to observe the various situations that can happen over the time by changing the inventory system. Thus, the objectives of this research of predicting the system change by doing simulation and characterize the system without any real time change, damage or costing was fulfilled. The effect of reorder quantity on the service level and inventory cost is not mentionable whereas the effect of reorder point on those parameters is significant.