-
Paper Information
- Paper Submission
-
Journal Information
- About This Journal
- Editorial Board
- Current Issue
- Archive
- Author Guidelines
- Contact Us
American Journal of Operational Research
2012; 2(3): 16-26
doi: 10.5923/j.ajor.20120203.01
Queueing Analysis of a Multi-component Machining System having Unreliable Heterogeneous Servers and Impatient Customers
 Abstract
 Reference
 Full-Text PDF
 Full-Text HTML
M. Jain1, Chandra Shekhar2, Shalini Shukla3
1Department of Mathematics, Indian Institute of Technology, Roorkee, Uttarakhand, India
2Department of Mathematic, Birla Institute of Technology and Science, Pilani, Rajasthan, India
3Department of Mathematics, Dayanand Anglo-Vedic (PG) College, Dehra Dun, Uttarakhand, India
Correspondence to: Chandra Shekhar, Department of Mathematic, Birla Institute of Technology and Science, Pilani, Rajasthan, India.
| Email: |  |
Copyright © 2012 Scientific & Academic Publishing. All Rights Reserved.
In this investigation, we deal with performance prediction of machining system with heterogeneous servers working under N-policy. To make multi-component system more reliable and efficient, the facility of cold and warm spares has been provided and the switching failure is taken into consideration. The impatient behaviors i.e. balking and reneging of failed machines are also included to make the investigation more versatile and realistic. The governing Chapman-Kolmogorov’s differential equations are also developed using Conservation Law of Rates. Various performance indices are derived from the state probabilities evaluated by using successive over relaxation (SOR) technique which deals with simultaneous linear equations efficiently and converges more rapidly. Numerical results are also provided to give insight about the problem. To explore the effects of system descriptors, the sensitivity analysis is conducted and results are depicted in tables and graphs. This paper significantly reveals optimal number of failed operating units to initiate service based on cost analysis and prompts worthy parameter of different characteristics of machines and servers.
Keywords: N-policy, Standbys, Switching Failure, Balking, Reneging, Breakdown, Unreliable Heterogeneous servers
Article Outline
1. Introduction
- With the advancement of modern technology, machining system has pervaded every nook and corner of our lives thus ensuring our utmost dependence on them. As time proceeds, a machine may fail due to wear and tear or due to some unpredicted fault and thus requires a corrective measure by providing the repair facility, after which it can again start working properly. If at any time, the failed machines need the repairman’s attention; a queue of failed machines may develop due to unavailability of idle repairmen. This phenomenon needs attention of mathematicians as such machine repair models have captivated the interest of many renowned researchers working in the area of queueing theory.System efficiency can also be improved by providing sufficient spare part support in case of machine failure. In queueing theory a lot of work has been done on machine repair models with spares provisioning. Reference[1] presented a Markovian model for machine repair system having cold standbys. Reference[2] analyzed multi-standby system considering repair and replacement policy and developed the Balking is a realistic phenomenon in many real life congestion situations and can be incorporated in case of multi- component machining system wherein failed machines may not join the queue in case of long queue or insufficient waiting space. It is also common observation that in many situations, the caretaker of waiting failed machines leaves the queue after waiting sometimes without getting service. This is termed as reneging and may be incorporated while analyzing the performance of real time machining system. In order to decrease the backlog and to check the balking & reneging behavior of the failed machines, the server may increase their service rate after a threshold level of the queue of failed machines. The facility of spares can also be helpful to reduce the discouraging behavior. These considerations give the model a realistic touch that’s why in the present study, we consider the balking & reneging effect, provision of spares and faster service rate after a threshold level while developing Markovian model of machine repair problem. Reference[12] derived some theorems on single server queue with balking. Reference[13] investigated M/M/R machine repair problem with reneging and spares. Reference[14] suggested cost analysis of the M/M/R machine repair problem with balking, reneging and server breakdowns. Reference[15] investigated the machine interference model with balking, reneging and spares. Reference[16] studied the repairable system with warm standbys, reneging and balking. Reference[17] analyzed M/M/R machine interference model with balking, reneging, spares and two modes of failure. Reference[18] worked out performance modeling of machining system with mixed standby components, balking and reneging. Reference[19] analyzed the M/M/R machining system with mixed standbys, switching failures, balking, reneging and additional removable repairmen for transient state. Reference[20] had used Newton's method for optimal management of the machine repair problem with working vacation. Reference[21] investigated machine repair problem in production systems with spares and server vacations. Reference[22] studied multi-product transfer lines subject to random failures. Reference[23] gave some balking strategies for the equilibrium in the single server Markovian queue with catastrophes.In many real life congestion scenario of machine repair problem due to techno-economic constraint, the server activates at threshold level N of failed machines and continues till there is no waiting failed machine for service. When a unit fails or server breakdowns, the startup/setup time is required i.e. the server as well as the repairman spends some time for preparation before they can start the service of machines and servers. A vast number of papers in literature deal with a detailed analysis of N policy queueing models in different frame-works where the service is initiated by the accumulation of N jobs and ends when queue becomes empty. Reference[24],[25] studied N policy for M/G/1 queueing system. Reference[26] considered a queueing system with removable server and presented proof for the optimality of the best N policy. Reference[27] discussed a Poisson input queue under N policy and with a general startup time. An optimal N policy for production system with early set up was studied in[28]. N policy with setup time was considered in[29],[30]. Reference[31] dealt with the operating characteristics of an M/M/1 queue with an exponential setup time under N policy and obtained various state probabilities for queue size distribution at various points of time. Reference[32] analyzed N policy for a steady state bulk queue with multiple vacations, setup times and close down times. Reference[33] studied N-policy machine repair system with mixed standbys and unreliable servers. Reference[34] had performed the performance analysis of the finite source retrial queue with server breakdowns and repairs. Reference[35] used the maximum entropy method to analyze a queue having a randomized N-policy.In some cases, a standby unit might not be able to switch over to a primary failed unit successfully. Reference[36] first introduced the concept of the standbys switching failures in the reliability with standby system. Reference[37] performed comparisons of reliability and the availability between four systems with warm standby units, reboot delay and standby switching failures for specific values of distribution parameters. Reference[38] developed profit model to determine optimal operating conditions of the machine repair problem with balking, reneging and standby switching failures. Reference[39] derived expressions for system reliability and mean time to system failure of the system with multiple unreliable service stations and standby switching failures. Using the supplementary variable technique, Reference[40] obtained the explicit expressions for the steady state availability of three systems with general repair time, reboot delay and switching failures. Reference[41] performed throughput assessment of mixed-model flexible transfer lines with unreliable machines. By using Markov chain approach and system cost analysis, Reference[42] obtained the stationary distribution of queue size of the queueing systems and provided algorithms in order to identify the equilibrium strategies for the fully and partially observable models. They derived the equilibrium threshold balking strategies and the equilibrium social benefit for all customers for the fully and partially observable system respectively, both with server breakdowns and delayed repairs. Reference[43] studied a finite-source parallel queue system by maximizing the throughput.No authors in past had investigated switching failure of different types of spares under N policy and different service rate for servers with impatience behavior of machine during waiting for its turn for service. In this paper we investigate the machine interference problem with mixed spares, switching failure, balking and reneging under N policy and heterogeneous service rate using cost function. The server breakdown and its different types of service rates are taken into considerations. The rest of the paper is outlined as follows: In section 2, we formulate the problem in detail by stating requisite assumptions and notations. State probabilities are computed using governing Chapman-Kolmogrov difference equation of the model in section 3. The solution technique SOR has been discussed in section 4 which is followed by the performance measures in section 5. The cost has been analyzed in section 6. For realistic and deep insight about the investigation, we present numerical results in section 7. In the section 8, the conclusion and future scope are remarked.
2. Problem Statement
- Consider a multi-component machining system consisting of
 machines, single server and two types of heterogeneous repairmen in the repair facility. The present model is appropriate for production system, manufacturing system and computer & communication system. The assumptions and notations for developing the model and constructing the governing equations are as follows.● The system consists of
  identical operating machines having life time as exponentially distributed with parameter
  ● The rest
  machines are worked as standbys where,
  are cold spares having failure rate zero and
  are warm spares whose life time is exponentially distributed with parameter
 . The failure of warm spares is independent of state of the others.● Whenever one of these machines fails, it is immediately replaced firstly by an available cold spares and then by warm spare. When a spare moves into an operating state, its failure characteristics will be that of an operating machine. ● The switching of spare to operating state may not be perfect. It is not unusual to consider the switching of machine has a failure probability
 . If a spare fails to switch to an operating machine, the next available spare attempts to switch. This process continues until switching is successful or all the spares have failed.● Whenever an operating machine or spare fails, it is immediately sent to a repair facility where failed machines are repaired in the order of their failures.● When both type of spares are used, the failed machines may balk; the joining probability is
  when i machines have already failed.● The repair facility has one server who renders service to failed machines according to the N policy i.e. the server starts the service on the accumulation of
 failed machines and continues till the system is empty.● The server takes setup time of random duration which is exponentially distributed with parameter
 .● The time-to-repair of a single server is exponentially distributed with parameter
  in case when at least one cold spare is available,
  when all cold spares are exhausted but at least one warm spare is available;
  when all spares are exhausted.● When server is busy, the failed machine may renege in exponential fashion with rate
  and
and  if at least one cold spare is available, all cold spares are utilized but some warm spares are available and all spares are exhausted, respectively.● As a machine is repaired, it is as good as new one and goes into standby or operating state immediately.● The server is prone to breakdown; the lifetime of server follows exponential distribution with parameter
 .● The primary repairman takes some time before starting the repair of broken down server as setup period which is exponentially distributed with the rate
 .● After taking setup time, primary repairman may provide the essential repair or primary service to broken down server in Bernoulli fashion with parameter
 .● The time-to-essential repair is exponentially distributed with the parameter
  whereas the time-to-primary service is also exponentially distributed with the parameter
 . Each repair is independent of the state of the other.● After primary repair, secondary repairman provides the secondary service. The time-to-secondary service follows exponential distribution with parameter
  and service is independent of the state of the other.● The failure of machine is possible only when the system is in operation i.e. the server is in working state. ● The switchover time from spare state to operating state, from failure to setup, from setup to repair, or from repair to standby state (or operating state if the system is short) is instantaneous.
 3. State Probabilities
- The Chapman-Kolmogrove difference equations for different states are constructed by using conservation of rate principle from figure 1. Let
 be the number of failed machines in the repair facility at the time t and let the state of the server be denoted by
  at time t, defined as follows:
 Then,
Then,  is a Markov process with state space
 We define the state probabilities of the system as follows:
 and limit as
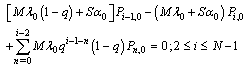
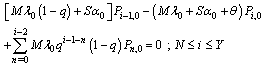
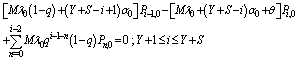
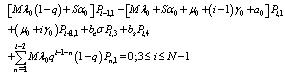
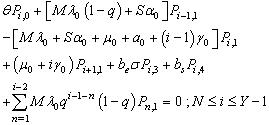
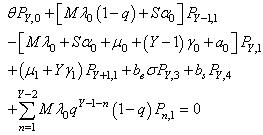
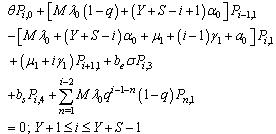
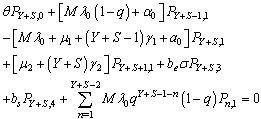
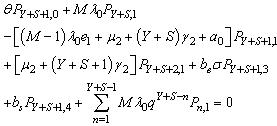
 for steady-state analysis.The governing equations of the model are obtained as follows:
 | (1) |
 | (2) |
 | (3) |
 | (4) |
 | (5) |
 | (6) |
 | (7) |
 | (8) |
 | (9) |
 | (10) |
 | (11) |
 | (12) |
 | (13) |
 | (14) |
 | (15) |
 | (16) |
 | (17) |
 | (18) |
 | (19) |
 | (20) |
 | (21) |
4. Solution Technique
- The steady-state governing difference equations of the present model can be expressed in the form of
 | (22) |
 and 0 is the null column vector of order 5K+1.Using the normalizing condition
 | (23) |
 | (24) |
 of order 5K+1.The system of linear equations (24) have been solved using the numerical technique ‘Successive Over Relaxation (SOR) method with parameter value 1.25’ in MATLAB 7.1 since it gives more efficient and accurate solution than any other matrix method.
 5. Performance Measures
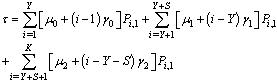
- In this section, the probabilities obtained in the section 4 are used to establish some performance indices as follows:■ The expected number of failed units in the system is given by
 | (25) |
 | (26) |
 | (27) |
 | (28) |
 | (29) |
 | (30) |
 | (31) |
 | (32) |
 | (33) |
 | (34) |
 | (35) |
 | (36) |
 | (37) |
 | (38) |
 | (39) |
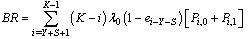
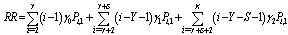
6. Cost Analysis
- In order to determine the optimal threshold parameter N, we construct a steady-state expected cost function per unit time and impose constraint on the availability of the system. The optimal value of N, say N*, is obtained by minimizing the cost function subject to the system availability constraint. The cost per unit time of each machine in different states and other cost elements are defined as follows:CO = Cost per unit time of one machine in the operating stateCS= Cost per unit time of one unit that function as a spareCW= Cost per unit time when server is in working state CB= Cost per unit time when server is in broken down stateCPS= Cost per unit time when the server is under primary repair stateCSS= Cost per unit time when the server is under secondary repair stateCL= Cost per unit time due to failed machines.CSR= Cost per unit time due to switching failure.CI = Cost per unit time that server is idle.Now, we construct the expected cost function per unit time as
 | (40) |
 | (41) |
 | (42) |
 , until the availability constraint is satisfied, we search optimal N using a direct search method since it is a discrete quantity.
7. Numerical Results
- For the performance indices obtained in the previous section 6, we perform the sensitivity analysis to explore the effects of changes in the specific parameter values of the system characteristics. The computational results are obtained by coding the computer program in the software MATLAB 7.1. We summarize the numerical results for the


 and
and in tables 1-12 by varying
 ,
,  ,
,  ,
,  ,
,  ,
,  ,
,  ,
,  ,
,  ,
,  ,
,  and
and , respectively. The trends of the performance indices namely,
  are displayed in figures 2-4, respectively. For computation purpose, the default parameters are fixed as:


 and
and .
.
|
 ,
, ,
,  ,
,  and
and  on various performance indices which are as follows:(i) Effects of number of operating units
 and threshold number of failed machines
 for the server to come in action: In tables 1 and 4, we see that
 ,
, 

 and
and  are increasing whereas
  is decreasing with respect to M and N respectively. In tables 5 and 9,

 and
and  show the increasing trend but
  is decreasing as M and N increase. It is also found that
  is first increasing and then decreasing with respect to
 . In table 8,
  and
and  are decreasing but
 and
and  are increasing;
  and
and  are almost constant with respect to
 . In table 12,
 and
and  increases but
 and
and  decrease. We see that
  remains almost constant with respect to
 . Figures 2(a), 3(a) and 4(a) reveal that the
 ,
, and
and  respectively show an increasing trend with respect to
  whereas there is no change in these performance indices with respect to
  as clear from figures 2(d), 3(d) and 4(d), respectively.
|
|
 and
and : In tables 2-3, 6-7 and 10-11, all performance indices show increasing trend with respect to
  and
and , respectively.
  and
and  are increasing gradually whereas all other indices are increasing remarkably. Figures 2(b)-2(c), 3(b)-3(c) and 4(b)-4(c) reveal that the
 ,
, and
and  respectively show an increasing trend by increasing the number of standby units i.e.
  and
and .
.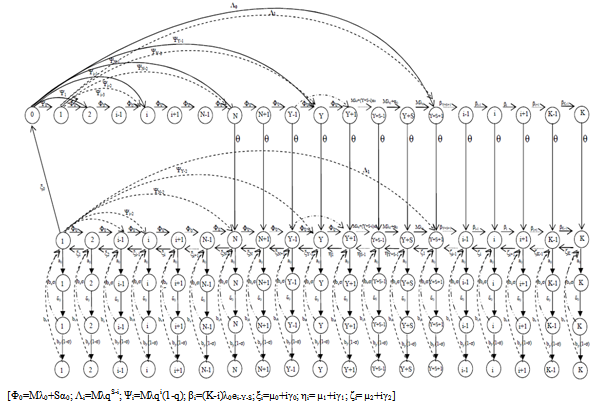 | Figure 1. Transition diagram with following abbreviations |
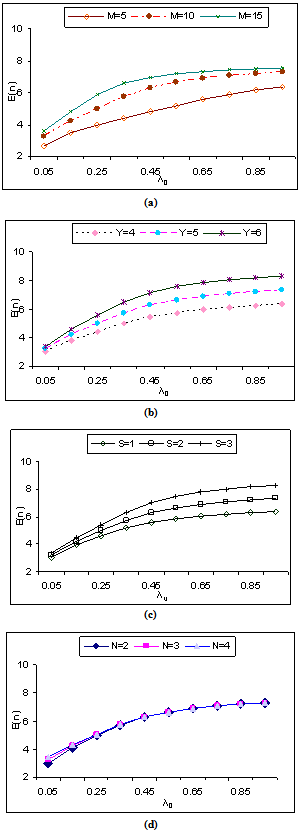 | Figure 2. Expected number of failed units in the system by varying λ0 for different values of (a)  (b) (b)  (c) (c)  (d) (d)  |
 : Tables 1-4 show that
  and
and  decrease but
  increases; also
 and
and  first increase and then decrease with respect to
 . In table 1,
  is decreasing for lower value of
  whereas increasing for higher values of
  with respect to. In tables 2-4,
  increases with respect to
 . Figures 2(a)-2(d) and 3(a)-3(d) depict that
  and
and  respectively increases whereas figures 4(a)-4(d) show that
  decreases with respect to
 , which is quite obvious and desirable.
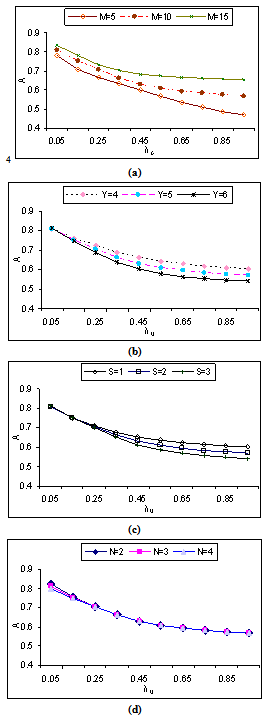 | Figure 3. Availability of the system with respect to λ0 for different values of (a)  (b) (b)  (c) (c)  (d) (d)  |
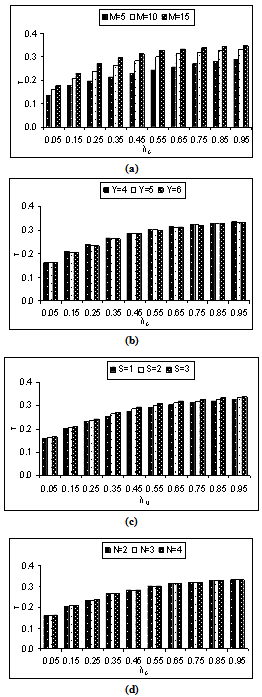 | Figure 4. Throughput of the system by varying λ0 for different values of (a)  (b) (b)  (c) (c)  (d) (d)  |
 : In tables 5 and 6,
  increases whereas
  decreases with respect to
 . It is noticed that
 ,
,  and
and  decreases for lower values of
  wher eas increase for higher value of
 , and
, and  increases for lower values of
  whereas decreases for higher values of
  with respect to
 . In table 7,
  ,
, ,
, and
and  decrease. We can also see that
  increases for lower values of
  whereas decreases for higher values of
 . It is quite clear that
  first increases and then decreases with respect to
 . In table 8, all performance indices decrease with respect to
 .
.
|
|
|
|
|
|
|
|
 : In table 9, all performance indices increase except
  as it increases for lower values of
  whereas decreases for higher value of
  with respect to
 . In tables 10 and 12, all performance indices show the increasing trend with respect to
 . In table 11, all performance indices increases except for
  and
and  as they reveal the decreasing trend with respect to
 .Based on the numerical results obtained above, we conclude that:● As important in real time machining system, the number of operating units should be determined under cost constraints to make the system more available.● It is quite obvious that the system designer must concentrate on the number of warm and cold spares carefully to maintain the grade of service (GoS) and just-in time model as is seen in real life situations.● The system designer must use more number of cold spares in comparison to the respective number of warm spares.● To minimize the cost, the repair rate of the operating units should be kept reasonably high whereas the reneging does not affect the cost much.
 8. Discussion
- In this investigation, we have discussed the machine repair problem with unreliable server. To increase the reliability, the facility of spares and repairmen is also considered. The realistic phenomenon of switching failure of spares and impatient behavior of failed machines has also been incorporated in this investigation. In order to decrease the backlog and to control the balking & reneging behavior of the failed machines, the server may increase their service rate after a threshold level of the queue of failed machines. Various performance indices have been developed to analyze the characteristics of the system and to perform the sensitivity analysis. The model that we studied is realistic. The future scope of the paper is to study mixed type spares facility in present model to make it more realistic and to find optimal service rate of heterogeneous servers and repairmen. We can extend this paper to search optimal number of operating and spares units at minimum cost.
References
| [1] | F.J. Toft, H. Boothroyd, “A queueing model for spare coal faces”, Journal of the Operational Research Society, vol.10, pp.245–251, 1959. |
| [2] | L.R. Goel, R. Gupta, “Multistandby system with repair and replacement policy”, Microelectronics Reliability, vol.23, no.5, pp.805- 808, 1983. |
| [3] | K.E. Stecke, J.E. Aranson, “Review operator/machine interference models”, International Journal of Production Research, vol.23, pp.129-151, 1985. |
| [4] | B.D. Sivazlian, K.H. Wang, “Economic analysis of the M/M/R machine repair problem with warm standbys”, Microelectronics Reliability, vol.29, pp.25-35, 1989. |
| [5] | K.H. Wang, B.D. Sivazlian, “Cost analysis of the M/M/R machine repair problem with spares operating under variable service rates”, Microelectronics Reliability, vol.32, pp.1171–1183, 1992. |
| [6] | S.M. Gupta, “Interrelationship between queueing models with balking and reneging and machine repair problem with warm spares”, Microelectronics Reliability, vol.34, no.2, pp.201–209, 1994. |
| [7] | U.C. Gupta, T.S.S.S. Rao, “On the M/G/1 machine interference model with spares”, European Journal of Operational Research, vol.89, pp.164–171, 1996. |
| [8] | M. Jain, “M/M/R machine repair problem with spares and additional servers”, Indian Journal of Pure and Applied Mathematics, vol.29, no.5, pp.517-524, 1998. |
| [9] | T. Zhang, M. Xie, M. Horigome, “Availability and reliability of k-out-of-(M+N):G warm standbys systems”, Reliability Engineering and System Safety, vol.91, no.4, pp.381-387, 2006. |
| [10] | J.C. Ke, Z.L. Su, K.H. Wang, Y.L. Hsu, “Simulation inferences for an availability system with general repair distribution and imperfect fault coverage”, Simulation Modelling Practice and Theory, vol.18, no.3, pp.338-347, 2010. |
| [11] | Y. Li, X.Y. Meng, “Reliability analysis of a warm standby repairable system with priority in use”, Applied Mathematical Modelling, vol.35, no.9, pp.4295-4303, 2011. |
| [12] | R.S. Dick, “Some theorems of single server queue with balking”, Operations Research, vol.18, pp.1193-1206, 1970. |
| [13] | M. Jain, Premlata, “M/M/R machine repair problem with reneging and spares”, Journal of Engineering and Applied Sciences, vol.13, no.2, pp.139-143, 1994. |
| [14] | J.C. Ke, K.H. Wang, “Cost analysis of M/M/R machine repair problem with balking, reneging and server breakdowns”, Journal of the Operational Research Society, vol.50, pp.275-282, 1999. |
| [15] | A.I. Shawky, “The machine interference model: M/M/C/K/N with balking reneging and spare”, OPSEARCH, vol.36, no.1, pp. 25–35, 2000. |
| [16] | J.C. Ke, K.H. Wang, “The reliability analysis of balking and reneging in repairable system with warm standbys”, Quality and Reliability Engineering international, vol.18, no.6, pp.467-478, 2002. |
| [17] | M. Jain, G.C. Sharma, M. Singh, “M/M/R machine interference model with balking, reneging, spares and two modes of failure”, OPESEARCH, vol.40, no.1, pp.24-41, 2003. |
| [18] | G.C. Sharma, M. Jain, K.P.S. Baghel, “Performance modeling of machining system with mixed standby components, balking and reneging”, International Journal of Engineering, vol.17, no.2, pp.169-180, 2004. |
| [19] | M. Jain, G.C. Sharma, N. Singh, “Transient analysis of M/M/R machining system with mixed standbys, switching failures, balking, reneging and additional removable repairmen”, International Journal Of Engineering, vol.20, no.2, pp.169-182, 2007. |
| [20] | K.H. Wang, W.L. Chen, D.Y. Yang, “Optimal management of the machine repair problem with working vacation: Newton's method”, Journal of Computational and Applied Mathematics, vol.233, no.2, pp.449-458, 2009. |
| [21] | J.C. Ke, S.L. Lee, C.H. Liou, “Machine repair problem in production systems with spares and server vacations”, RAIRO- Operations Research, vol.43, no.1, pp.35 – 54, 2009. |
| [22] | K. Dhouib, A. Gharbi, N. Landolsi, “Availability modelling and analysis of multi-product flexible transfer lines subject to random failures”, International Journal of Advanced Manufacturing Technology, vol.50, pp.329–341, 2010. |
| [23] | Boudali, A. Economou, “Optimal and equilibrium balking strategies in the single server Markovian queue with catastrophes”, European Journal of Operational Research, vol.218, no.3, pp.708–715, 2012. |
| [24] | M. Yadin, P. Naor, “Queueing system with a removable service station”, Operational Research Quarterly, vol.14, pp.393-405, 1963. |
| [25] | D.P. Heyman, “Optimal operating policies for M/G/1 queueing system”, Operations Research, vol.16, pp.362-382, 1968. |
| [26] | A.J.J. Talman, “A simple proof of the optimality of the best N-policy in the M/G/1 queueing control problem with removable server”, Statistica Neerlandica, vol.33, no.3, pp.143-150, 1979. |
| [27] | J. Medhi, J.G.C. Templeton, “A poisson input queue under N- policy and with a general startup time”, Computers and Operations Research, vol.19, no.1, pp.35-41, 1992. |
| [28] | H.W. Lee, J.O. Park, “Optimal strategy in N- policy production system with early set up”, Journal of the Operational Research Society, vol.48, no.3, pp.306-316,1997. |
| [29] | K. Reddy, G.V. Nadarajan, R. Arumunganathan, “Analysis of a bulk queue with N- policy multiple vacations and setup times”, Computers and Operations Research, vol.25, no.11, pp.957-967, 2000. |
| [30] | J.C. Ke, “The operating characteristic analysis on a general input queue with N policy and startup time”, Mathematical Methods of Operations Research, vol.57, no.2, pp.235-254, 2003. |
| [31] | G. Choudhary, “Operating characteristics of an M/M/1 queueing system under N-policy with exponential setup time”, Elektronnoe Modelirovanine, vol.51, pp.235-254, 2001. |
| [32] | R. Arumuganthan, S. Jeyakumar, “Steady state analysis of a bulk queue with multiple vacations, set up times with N-policy and closedown times”, Applied Mathematical Modelling, vol.29, pp.972-986, 2005. |
| [33] | M. Jain, C. Bhargava, “N-policy machine repair system with mixed standbys and unreliable server”, Quality Technology & Quantitative Management, vol.6, no.2, pp.171-184, 2009. |
| [34] | J. Wang, L. Zhao, F. Zhang, “Performance analysis of the finite source retrial queue with server breakdowns and repairs”, in Proceedings of the 5th International Conference on Queueing Theory and Network Applications, Beijing, China, 2010. |
| [35] | K.H. Wang, D.Y. Yang, W.L. Pearn, “Comparative analysis of a randomized N-policy queue: An improved maximum entropy method”, Expert Systems with Applications, vol.38, no.8, 9461–9471, 2011 |
| [36] | E.E. Lewis, Introduction to reliability engineering, 2nd ed., Wiley, New York, 1996. |
| [37] | K.H. Wang, W.L. Dong, J.B. Ke, “Comparing of reliability and the availability between four systems with warm standby, switching failures”, Applied Mathematics and Computation, vol.183, pp.1310-1322, 2006. |
| [38] | K.H. Wang, J.B. Ke, J.C. Ke, “Profit analysis of the M/M/R machine repair problem with balking, reneging and standby switching failures”, Computers and Operations Research, vol.34, pp.835-847, 2007. |
| [39] | J.B. Ke, W.C. Lee, K.H. Wang, “Reliability and sensitivity analysis of a system with multiple unreliable service stations and standby switching failures”, Physica A, vol.380, pp.455-469, 2007. |
| [40] | K.H. Wang, Y.J. Chen, “Comparative analysis of availability between three systems with general repair times, reboot delay and switching failures”, Applied Mathematics and Computation, vol.215, no.1, pp.384-394, 2009. |
| [41] | K. Dhouib, A. Gharbi, “Throughput assessment of mixed-model flexible transfer lines with unreliable machines”, International Journal of Production Economics, vol.122, no.2, pp.619-627, 2009. |
| [42] | J. Wang, F. Zhang, “Equilibrium analysis of the observable queues with balking and delayed repairs”, Applied Mathematics and Computation, vol.218, no.6, pp.2716–2729, 2011. |
| [43] | M. Delasay, B. Kolfal, A. Ingolfsson, “Maximizing throughput in finite-source parallel queue systems”, European Journal of Operation Research, vol.217, no.3, pp.554-559, 2012. |