-
Paper Information
- Paper Submission
-
Journal Information
- About This Journal
- Editorial Board
- Current Issue
- Archive
- Author Guidelines
- Contact Us
American Journal of Organic Chemistry
p-ISSN: 2163-1271 e-ISSN: 2163-1301
2024; 12(1): 1-19
doi:10.5923/j.ajoc.20241201.01
Received: Dec. 22, 2023; Accepted: Dec. 29, 2023; Published: Jan. 15, 2024

Synthesis, Characterization, Hirshfeld Surface Analysis and Quantum Chemical Calculations of 2-oxo-2H- Chromen-6-yl 4-Methoxybenzoate
 Abstract
 Reference
 Full-Text PDF
 Full-text HTML
Zakaria Koulabiga 1, Kouadio Honoré Yao 2, Akoun Abou 2, Abdoulaye Djandé 1, Michel Giorgi 3, Stéphane Coussan 4
1Laboratory of Molecular Chemistry and Materials (LC2M), Research Team: Organic Chemistry and Phytochemistry, University Joseph KI-ZERBO, 03 BP 7021 Ouagadougou 03, Burkina Faso
2Department of Training and Research in Electrical and Electronic Engineering, Research Team: Instrumentation, Image and Spectroscopy, Felix Houphouet-Boigny National Polytechnic Institute, BP 1093 Yamoussoukro, Cote d’Ivoire
3Spectropole, Federation of Chemical Sciences, Marseille FR1739 Campus St. Jérôme, 52 av. Escadrille Normandie-Niemen, Marseille, France
4Laboratory: Physics of Ionic and Molecular Interactions (PIIM), Research Team H2M, UMR 7345, CNRS/Aix-Marseille University, Marseille, France
Correspondence to: Akoun Abou , Department of Training and Research in Electrical and Electronic Engineering, Research Team: Instrumentation, Image and Spectroscopy, Felix Houphouet-Boigny National Polytechnic Institute, BP 1093 Yamoussoukro, Cote d’Ivoire.
| Email: |  |
Copyright © 2024 The Author(s). Published by Scientific & Academic Publishing.
This work is licensed under the Creative Commons Attribution International License (CC BY).
http://creativecommons.org/licenses/by/4.0/

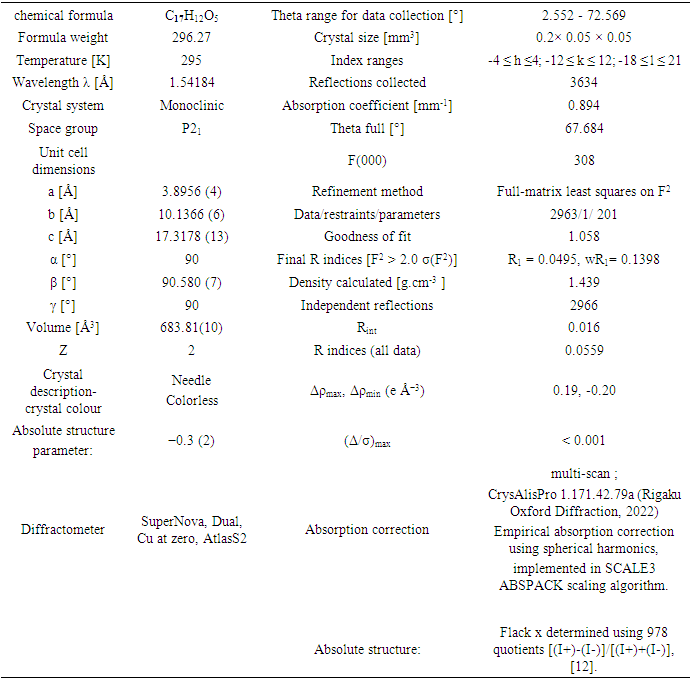
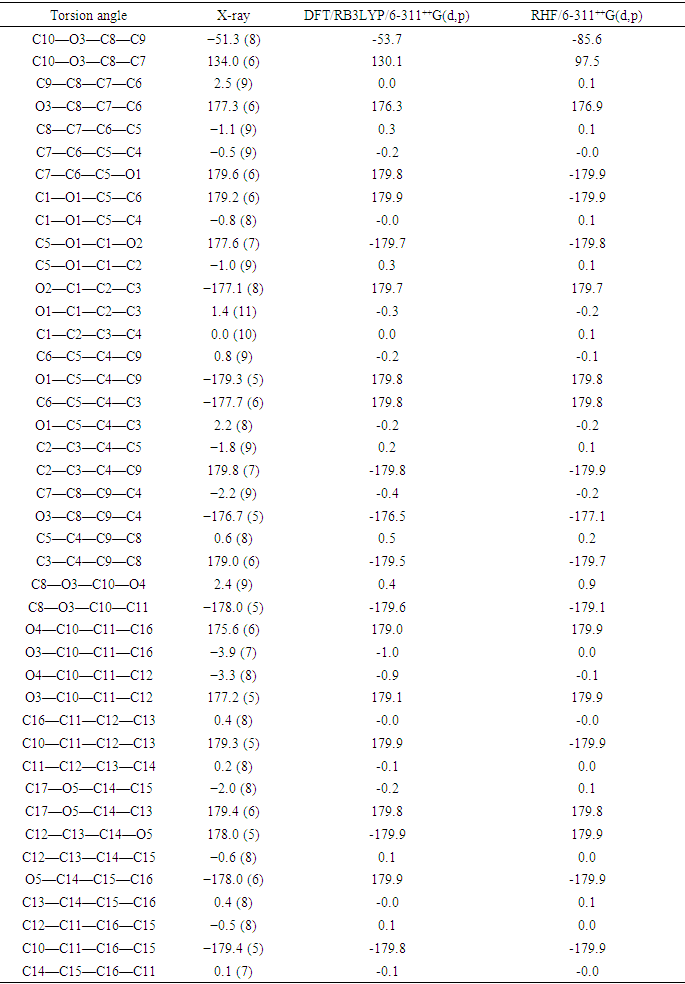
This article deals with a combined experimental and computational study of a 6-substituted coumarin derivative, namely, 2-oxo-2H-chromen-6-yl 4-methoxybenzoate (I). The compound was synthetized by O-acetylation of 6-hydroxycoumarin with 4-methoxybenzoyl chloride in the presence of tetrahydrofuran as a solvent and triethylamine as a base. The crystal structure has a P21 space group and crystallizes in the monoclinic system with dimensions of 𝑎 = 3.8956 (4) Å, 𝑏 = 10.1366 (6) Å, and 𝑐 = 17.3178 (13) Å. The angles between the crystal axes are 𝛼 = 𝛾 = 90° and 𝛽 = 90.580 (7)°, with a 𝑍 value of 2. The compound was structurally characterized by both spectroscopy and single-crystal X-ray diffraction (XRD). In the latter, the structure of (I) was solved by direct methods and refined as a 2-component twin to a final R value of 0.0495 for 2966 independent reflections. The structure is stabilized by H-π and π-π stacking interactions between neighboring aromatic rings, as well as intra- and intermolecular C—H…O hydrogen bonds that extend along the [001] direction. The analysis of intermolecular interactions was conducted using dnorm and shape-index mappings. The results of this analysis highlighted the same interactions as those found by XRD analysis, namely C-H...O hydrogen bonds, H-π and π-π stacking interactions. As well, the two-dimensional fingerprint plots (FP) show specific close contacts between atom pairs and the contributions from different contacts. The largest contributions to the Hirshfeld surface, 34.9% and 33.3%, come from O···H/H…O and H···H contacts, respectively. In additionally, the molecular geometry of (I) was optimized using both ab initio method namely restricted Hartree-Fock (RHF) method and density functional theory (DFT/RB3LYP) with the 6-311++G(d, p) basis set in ground state. The outcomes of these quantum chemical calculations are consistent with the observed structure. The only reported difference concerns the Hartree-Fock calculations where the computed torsion angle between the coumarin ring system and the benzoate ring, C10—O3—C8—C9, of -85.6° is slightly larger than the observed value (−51.3 (8)°). Also, frequency calculations were carried out with the optimizing structures to perform vibrational analysis, check compound stability and obtain some thermodynamic parameters. Molecular orbital calculations providing electron-density plots of the HOMO and LUMO molecular orbitals were also performed with the frequency calculation methods using the same basis sets. The theoretical values of the HOMO-LUMO energy gap yielding from these calculations are 4.40 eV for (DFT/B3LYP/6–311++G(d,p)) and 9.77 eV for (RHF/6–311++G(d)) methods.
Keywords: 6-substituted coumarin derivative, Spectroscopic analysis, Crystal structure, Conformational analysis, Hirshfeld surface analysis, Quantum chemical calculations
Cite this paper: Zakaria Koulabiga , Kouadio Honoré Yao , Akoun Abou , Abdoulaye Djandé , Michel Giorgi , Stéphane Coussan , Synthesis, Characterization, Hirshfeld Surface Analysis and Quantum Chemical Calculations of 2-oxo-2H- Chromen-6-yl 4-Methoxybenzoate, American Journal of Organic Chemistry, Vol. 12 No. 1, 2024, pp. 1-19. doi: 10.5923/j.ajoc.20241201.01.
Article Outline
1. Introduction
- Coumarin occurs naturally in plants such as cinnamon, tonka bean and sweet clover. The coumarin content of these plants or their essential oils is highly variable, and these plants can be used in food supplements without any limit in coumarin content being indicated. Its structure was isolated by A. Vogel in 1820 from Tonka beans and synthesized in 1868 by W.H. Perkin, via the famous Perkin reaction, at high temperature, from salicylic aldehyde and an acid anhydride (CH3CO)2O in the presence of a weak base (CH3COONa). The process currently used by Rhodia, world leader on the market, also uses salicylic aldehyde in the synthesis of coumarin consuming approximately half of the annual production of salicylic aldehyde. These coumarin derivatives are also widely used as raw materials in the pharmaceutical, perfume and agrochemical industries, as starting materials or intermediates for the synthesis of various compounds with a wide range of biological activities [1-3]. These include antibacterial [1], antioxidant [2] and anti-inflammatory [3] properties.In view of their importance and as an extension of our current research in the field of crystal structure analysis and theoretical calculations of new coumarin derivatives [4,5], we report here the synthesis, the spectroscopic characterization, the single-crystal X-ray diffraction (XRD) analysis, geometry optimization and Hirshfeld surface analysis of the ester derivative of coumarin scaffold (I).
2. Experimental and Theoretical Methods
2.1. Synthesis
- The below reaction entails the O-acetylation of 6-hydroxycoumarin utilizing 4-methoxybenzoyl chloride as a reactant with tetrahydrofuran serving as a solvent and triethylamine as a base.In this reaction, the used of HSAB theory suggests that hard bases like triethylamine provide optimum results when it concerns acylation of aromatic RCO+ acyl groups as hard acids [6].
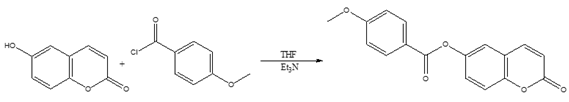 So, in the current experiment, a solution containing 4-methoxybenzoyl chloride (6.17 mmol; 0.7 mL) in dried tetrahydrofuran (30-40 mL) was employed. Subsequently, dried triethylamine (2.6 mL; 3 molar equivalents) and 6-hydroxycoumarin (6.17 mmol; 1 g) were added gradually over 30 minutes. The mixture was then refluxed for 4 hours and mixed with 40 mL of chloroform. The pH of the solution was adjusted to 2-3 by adding diluted hydrochloric acid. The organic layer underwent extraction, was washed with water until it reached neutrality, then dried over magnesium sulfate (MgSO4) before removal of the solvent. The resulting crude product was suction-filtered, washed with n-hexane, and recrystallized from chloroform. Colorless crystals of the title compound were obtained in a good yield: 87 %. Mp 452-454 K.
2.2. Electrospray Ionization Mass Spectrum
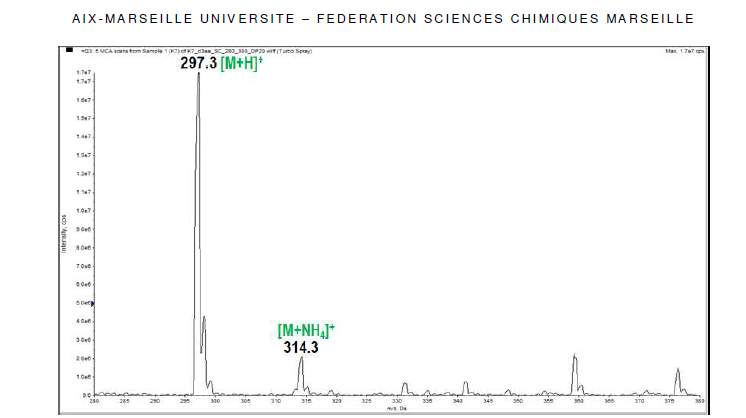
- Analysis were performed on a 3200 QTRAP spectrometer (Applied Biosystems SCIEX) equipped with a pneumatically assisted air pressure ionization (API) source for the ESI-MS+ experiment. The sample in solution was ionized under the following conditions: electrospray voltage (ISV): 5500 V; orifice voltage (OR): 20 V; nebulizing gas pressure (air): 10 psi. The mass spectrum (Figure 1) was obtained using a quadrupole mass spectrometer.
2.3. IR Spectrum
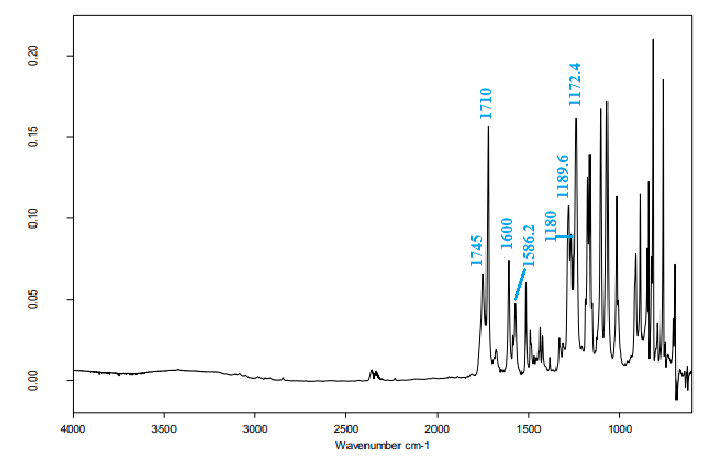
- The infrared (IR) spectrum, Figure 2, was recorded on a Bruker IFS 66/S Fourier Transform Infrared spectrometer (FT-IR), driven by the OPUS 6.5 software and using the ATR (Attenuated Total Reflection) technique. The absorption bands are expressed in wavenumber ῡ (cm-1).
2.4. NMR Spectra
- 1H and 13C nuclear magnetic resonance (NMR) spectra were acquired using a Bruker AMX-400 spectrometer operating at 400 and 100 MHz, respectively. TMS was adopted as the internal standard, with chemical shifts recorded in δ ppm and coupling constants designated in Hz. Chloroform-d served as the solvation agent. Figures 3 and 4 depict these spectra.
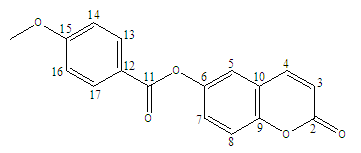 | Scheme 1. Numbering of carbon atoms used in spectra analysis. |
2.5. Crystal structure Analysis
- Diffraction data for the title compound were collected using a mirror monochromator and Cu Kα radiation (λ = 1.54184 Å) at 295 K on a Rigaku Oxford Diffraction SuperNova Dual, Cu at zero, AtlasS2 diffractometer [7]. The structure was solved via direct methods utilizing SIR 2014 [8] and implemented in the WinGX [9] program suite. The positional and anisotropic temperature parameters of the non-hydrogen atoms, which correspond to 201 crystallographic parameters, were refined using the SHELXL2014 program [10] through a full-matrix least squares method. The final refinement treated the structure as a 2-component twin with final BASF scale factors of 0.3559. All H atoms were placed in calculated positions [C—H = 0.93 Å (aromatic), 0.96 (methyl)] and refined using a riding model approximation with Uiso(H) restricted to 1.2 (aromatic) or 1.5 (methyl group) times Ueq of the respective parent atom.Data collection, cell refinement and data reduction are by CrysAlis PRO [7]. The general-purpose crystallographic tool PLATON [11] was employed for the analysis and presentation of structural results. Details of the data collection conditions, and the parameters of the refinement process are given in Table 1. Flack x parameter was determined using 978 quotients [(I+)-(I-)]/[(I+)+(I-)] [12] for absolute structure determination.CCDC-2304687 includes additional crystallographic data for this paper, which can be obtained at no cost from the Cambridge Crystallographic Data Centre via:www.ccdc.cam.ac.uk/data_request/cif;E-mail: deposit@ccdc.cam.ac.uk.
2.6. Hirshfeld Surface
- Molecular Hirshfeld surfaces of 2-oxo-2H- chromen-6-yl 4-methoxybenzoate were computed with a standard (high) surface resolution and with the three-dimensional dnorm surfaces mapped over a fixed color scale from -0.117 (red) to 1.324 a.u. (blue) and shape index mapped over -1.000 to 1.000 a.u. using the program Crystal Explorer 3.1 [13].
2.7. Computational Procedures
- The geometry optimization of compound (I) was performed using density functional theory (DFT) with the restricted RB3LYP exchange correlation functional and the restricted Hartree-Fock (RHF) methods with the 6-311++G(d,p) basis set in ground state. Both calculations on (I) were performed using the starting geometries taken from the X-ray refinement data. Frequency calculation methods using the same basis sets were then performed with the optimized geometries to perform vibrational analysis, check the stability of the compounds, and obtain some thermodynamic parameters. All calculations were computed using the GAUSSIAN09 software package [14].
3. Results and Discussion
3.1. Spectra Analysis
3.1.1. Interpretation of Electrospray Ionization Mass Spectrum
- The mass spectrum (Figure 1) displays two peaks detected at m/z 297 and 314 due respectively to the pseudo-molecular ion [M+H]+ and the ammonium adduct [M+NH4]+, which confirm the molecular weight of 296 g.mol-1 , in accordance with the chemical formula C17H12O5. ESI-MS m/z 297 [M+H]+; 314 [M+NH4]+.
3.1.2. Infrared Spectrum
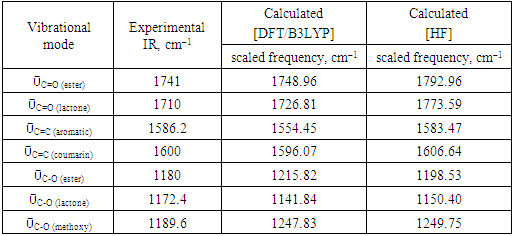
- The FT-IR spectrum of the title compound (Figure 2) exhibits a medium band at 1741.0 cm-1 that corresponds to ῡC=O (ester) and a strong absorption band at 1710.0 cm-1 attributed to ῡC=O (lactone). Additionally, the observed bands at 1180.0, 1172.4, and 1189.6 cm-1 can be assigned to (C−O, ester), (C−O, lactone) and (C−O, methoxy), respectively. The aromatic ring displayed a medium band ῡC=C at 1586.0 cm-1 while the coumarinic ring exhibited it at 1600.0 cm-1.
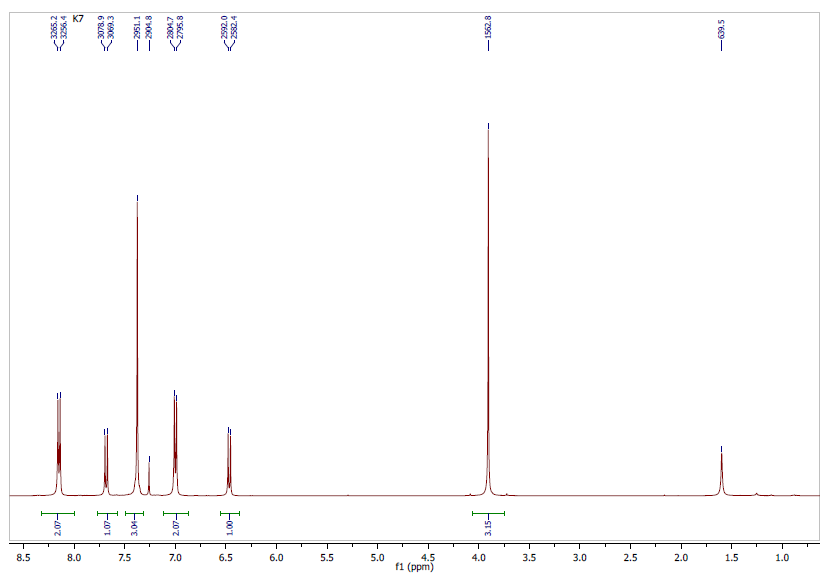
3.1.3. 1H-NMR Spectrum
- The 1H NMR spectrum (Figure 3) analysis, including chemical shifts and coupling constants, revealed a total of six signals. Five of these signals were in the range of 6-8.5 ppm and were due to aromatic hydrogens. The remaining three methyl protons were observed unambiguously at 3.8 ppm.The 1H-NMR (CDCl3, 400 MHz, δ ppm) data are as follows: 3.8 (s, 3H, CH3); 6.4 (d, 1H, J = 9.6 Hz, H-3); 7.0 (d, 2H, J = 8.9 Hz, H-14 and H-16); 7.38 (m, 3H, H-5, H-7, and H-8); 7.7 (d, 1H, J = 9.6 Hz, H-4); 8.3 (d, 2H, J = 8.9 Hz, H-13 and H-17).
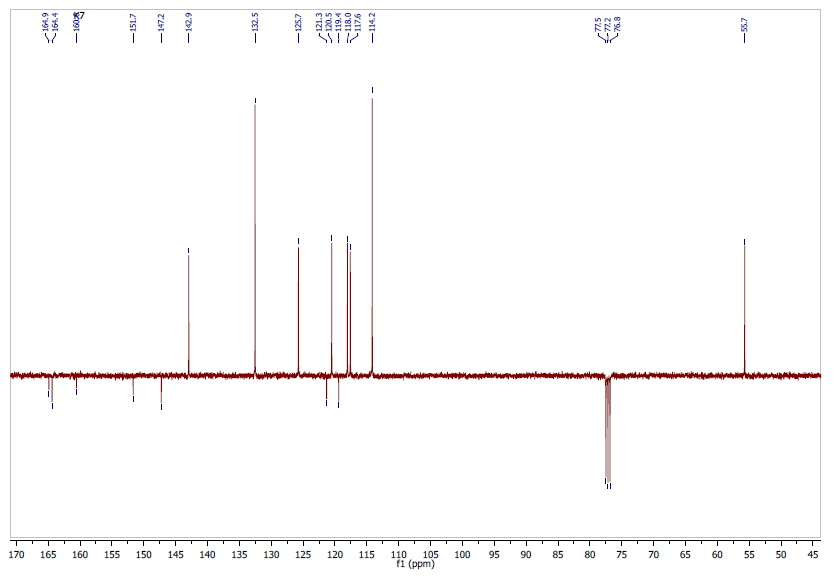
3.1.4. 13C Attached-Proton-Test (APT) Spectrum
- The Attached Proton Test NMR (APT NMR) is a 13C NMR experiment that reveals the number of protons that are attached to individual 13C carbon atoms in a molecule. So, it provides the information on all sorts of carbons within one experiment. Note that the peaks for CH and CH3 point up, while the peaks for CH2 and quarternary carbons including the solvent carbon point down.The 13C APT NMR spectrum of the molecule in CDCl3 (Figure 4) consists of 15 signals as expected. Eight peaks point up suggesting the nine aromatic tertiary carbons (C-3, C-4, C-5, C-7, C-8, C-13 and C-17, C-14 and C-16) and the shielded primary carbon of the methyl group ( CH3), whereas seven peaks point down indicating quaternary carbons (C-2, C-6, C-9, C- 10, C-11, C-12, C-15).13C (APT)-NMR (CDCl3, 100 MHz, δ ppm): 55.7 (CH3), 114.2 (C-14 and C-16); 117.6 (C-3), 118.0 (C-5), 119.4 (C-12), 120.5 (C-7), 121.3 (C-10); 125.7 (C-8), 132.5 (C-13 and C-17); 142.9 (C-4), 147.2 (C-9), 151.7 (C-6), 160.76 (C-2), 164.4 (C-11), 164.9 (C-15).
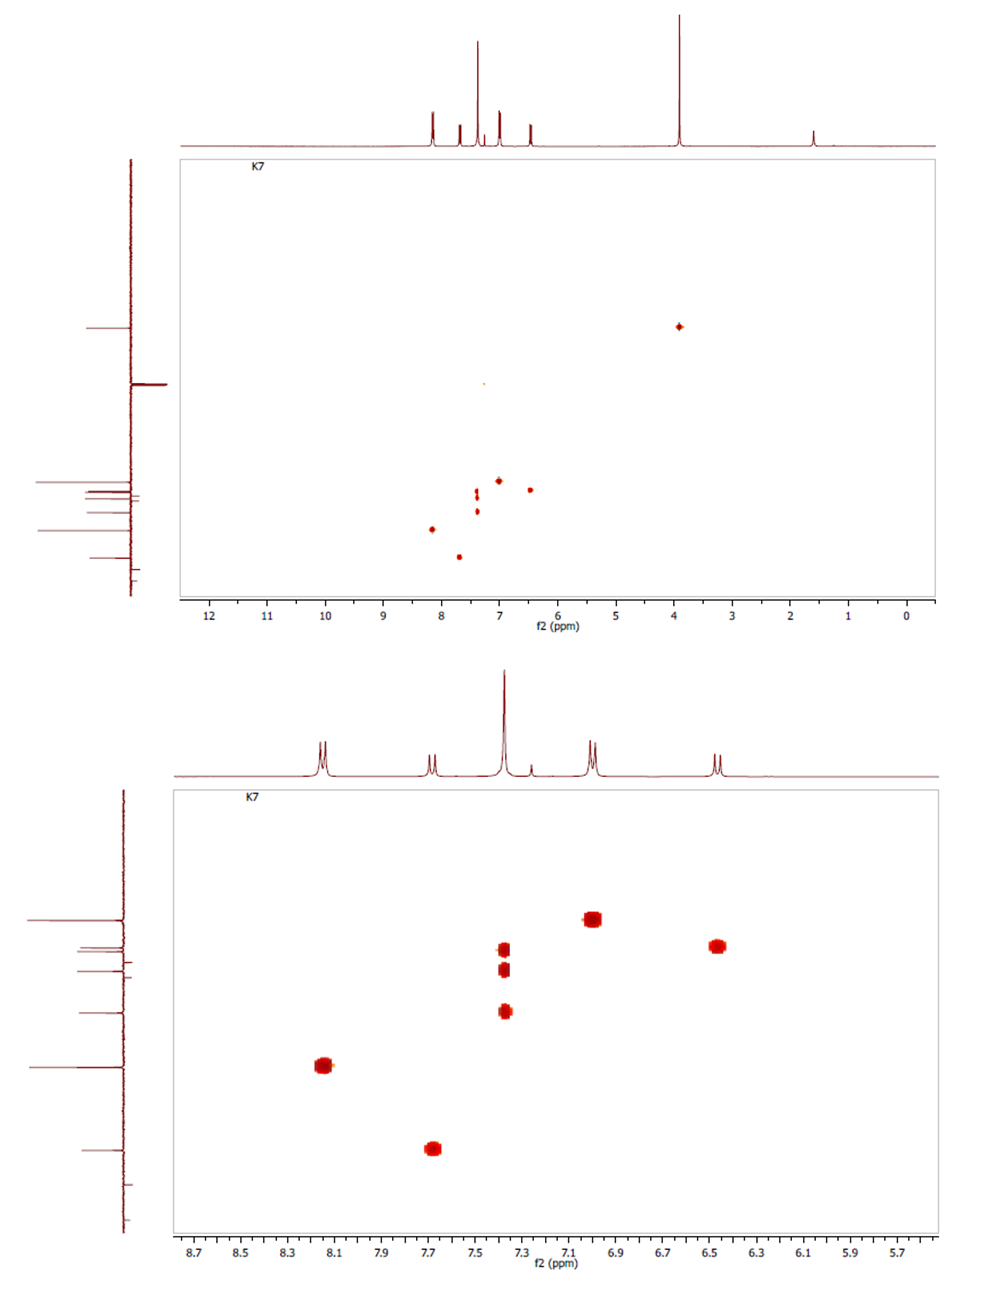
3.1.5. Heteronuclear Single-Quantum Correlation (HSQC) NMR Spectrum
- The HSQC-NMR spectrum (Figures 5) consists of eight spots exhibiting a good correlation on the one hand between the primary carbon and protons of methyl group and on the other hand between each tertiary carbon (C-3, C-4, C-5, C-7, C-8, C-14 and C-16, C-13 and C-17) and the proton directly attached by way of 1JC-H scalar coupling. The spots obtained confirm the attributions of signals in 1H and 13C (APT)-NMR spectra.
 | Figure 1. Electrospray ionization mass spectrum of the molecule |
 | Figure 2. 13C-NMR Spectrum of compound (I) |
 | Figure 3. Experimental 1H-NMR spectrum |
 | Figure 4. Experimental 13C (APT)-NMR spectrum |
 | Figures 5. Experimental HSQC spectra |
3.2. Structural Description
- The structure of the coumarin derivative (I) is shown in Figure 7.
3.2.1. Detection of Twinning
- Two crystal lattices are considered to be twinned if they have similar orientations but a different geometry. Pseudo-merohedral twinning may occur in monoclinic crystal systems if the unit-cell parameters meet any of the following conditions:
 is close to 90°, or a is close to c [15]. In (I), the beta
  value of 90.580(7)° clearly suggests a pseudo-merohedral twinning. Taking into account this molecular twinning in the refining process, including the twinning operator (l, -k, h) with the twinning fraction of 0.356(3), the crystallographic R1 indice (discrepancy index) decreases significantly from 0.28 to 0.0495, table 1.
|
3.2.2. Geometry and Conformation
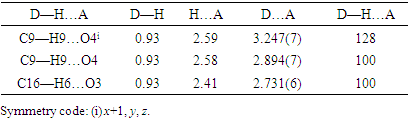
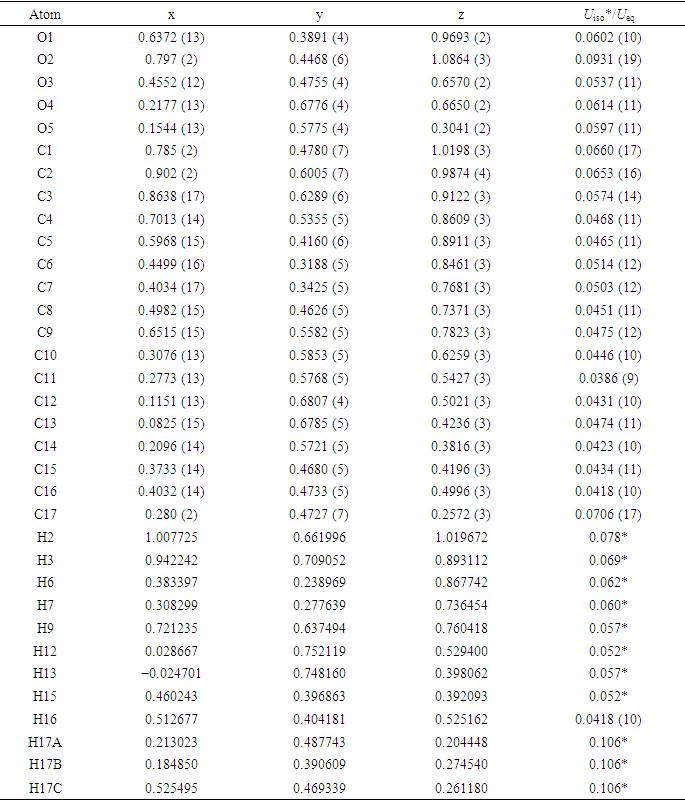
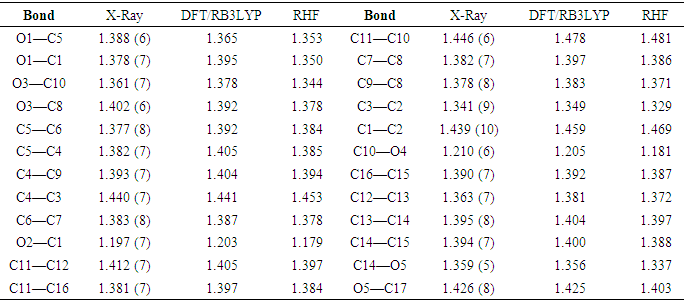
- The tables, 4 through 7, display the positional parameters, interatomic distances, bond angles and torsion angles. The analysis and interpretation of the geometrical characteristics show that carbon-oxygen bonds, specifically d(C1-O1) = 1.378(7) Å and d(C5-O1) = 1.388(6) Å, have the same attributes as the Car-O(2) bond observed in other structures of alkyl ethers. These bond distances were compared to standard values [13]. Additionally, the measured distances of d(C10-O4) = 1.210(6) Å and d(C10-O3) = 1.361(7) Å indicate strong characteristics of the ester moiety. Furthermore, upon inspection of the bond lengths in the coumarin ring, it has been determined that there is a slight asymmetry in the electronic distribution around the pyrone ring: the C2—C3 [1.341 (9) Å] bond length is shorter, while the C1—C2 [1.439 (10) Å] bond length is longer than the expected Car—Car bond. This indicates that the electron density is lower in the C2-C3 bond of the pyrone ring leading to the formation of the double bond, as observed in other coumarin derivatives [16-17].In the crystal structure, the flat chromene ring system (r.m.s deviation = 0.016 Å), formed by the coupling of benzene and 3,6-dihydro-2H-pyran rings, is positioned at a dihedral angle of 51.4(2)° relative to the benzoate-benzene ring. Additionally, the intramolecular C16—H16…O3 and C9—H9…O4 hydrogen bonds (Table 2.) give rise to an S(5) and S(6) ring motifs [18] which produces a pseudo-pentacyclic ring system illustrated in Figure 6.
|
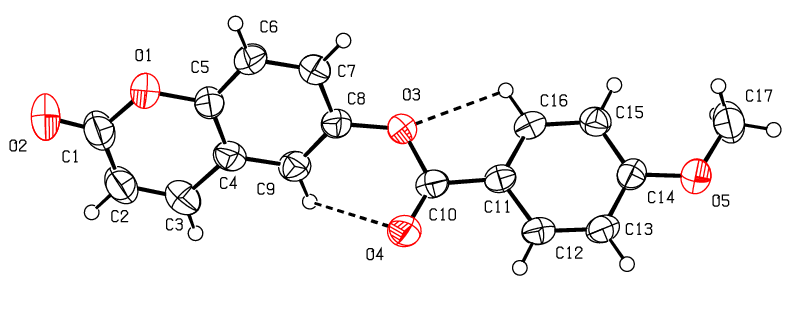 | Figure 6. An ORTEP [9] view of the title compound with the atomic numbering scheme. Displacement ellipsoids are shown at the 50% probability level. Dashed lines indicate hydrogen bonds |
3.2.3. Supramolecular Features
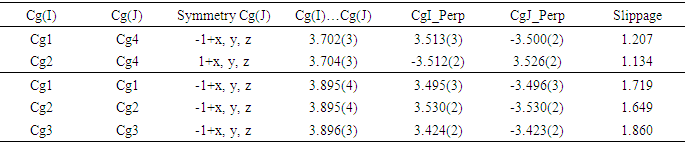
- In the crystal structure, intermolecular C—H…O hydrogen bonds connect molecules into the a-axis direction (see Figure 7). Besides, there are intermolecular short contacts, including [O2…H17A(-1+x,y,-1+z) = 2.63 Å], [O2…H3(-x,-1/2+y,-z) = 2.64 Å], [H12…C16 (2-x,1/2+y,1-z) = 2.84 Å], [H12…C15 (2-x,1/2+y,1-z) = 2.84 Å] and [H9…O4(-1+x,y,z) = 2. 59 Å], which are closer together than the sum of their van der Waals radii.Adding the above interactions to the π-π stacking interactions between the coumarin ring system and the C4-C9 benzene or pyrone rings led to the formation of the supramolecular aggregation shown in Figure 8. The distances between centroids, Cg1…Cg4 (-1+x, y, z) = 3.702 (3) and Cg2…Cg4 (1+x, y, z) = 3. 704 (3) Å, where Cg1, Cg2 and Cg4 correspond to the centroids of the pyrone, C4–C9 benzene and coumarin rings, respectively, are less than 3.8 Å, the maximum regarded as suitable for an effective π–π stacking interaction [19]. However, some interactions with centroid-centroid distances slightly above 3.8 Å are also retained (table 3). All these intermolecular interactions provide stability to the assembly of the three-dimensional crystal frameworks. The perpendicular distances of Cg(I) on ring J and distances between Cg(I) and perpendicular projection of Cg(J) on ring I (slippage) are summarized in Table 3.
|
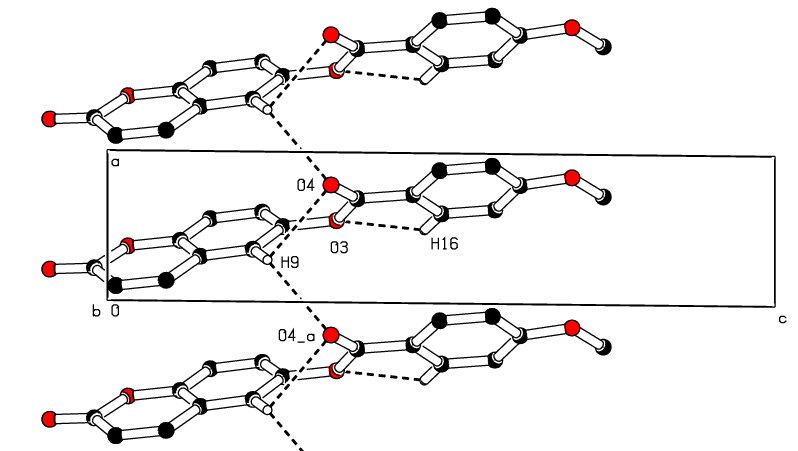 | Figure 7. Part of the crystal packing of the title compound showing the infinite 1D chain along [100]. Dashed lines indicate hydrogen bonds. H atoms not involved in hydrogen bonding have been omitted for clarity. |
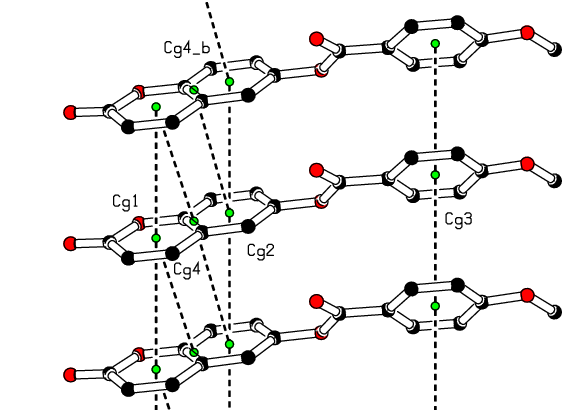 | Figure 8. A view of the crystal packing showing π–π stacking interactions (dashed lines). The green dots are ring centroids of rings |
3.3. Hirshfeld Surface Analysis
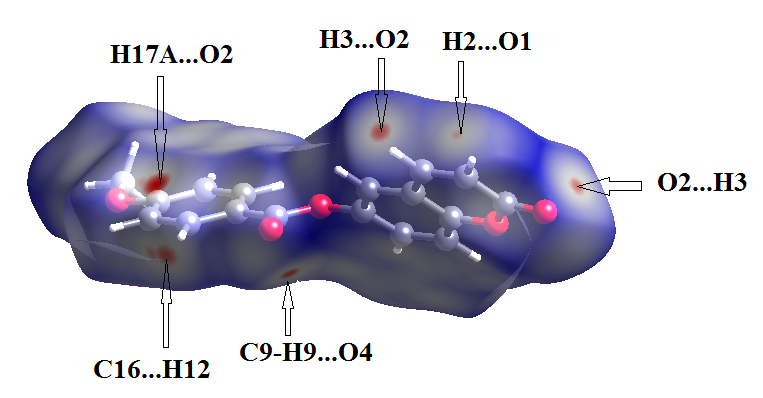
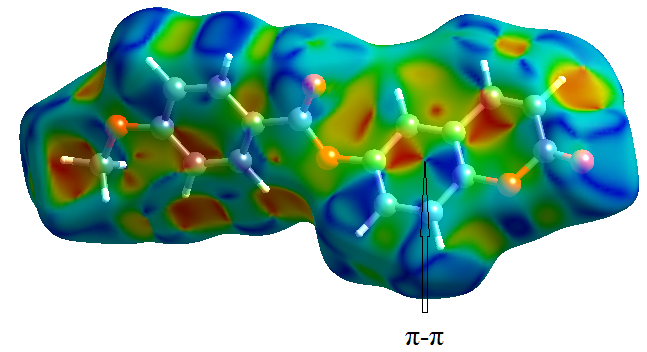
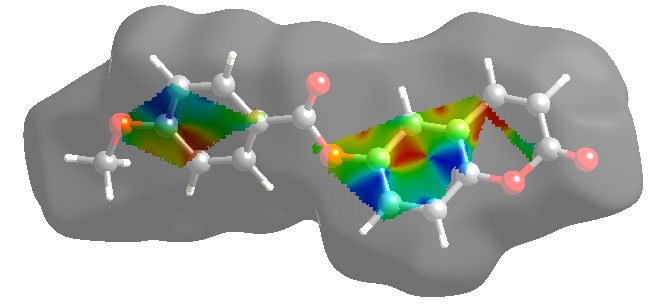
- In order to provide a complete analysis of the interactions between the molecules, compound (I) was subjected to a Hirshfeld surface analysis generated with CrystalExplorer 3.1. The 3D dnorm surface was calculated at standard (high) surface resolution and mapped with a color scale ranging from -0.117 (red) to 1.324 a.u. (blue). In (I), six bright red spots were observed on the dnorm map, indicating negative dnorm values that reflect distances shorter than the sum of the van der Waals radii. These red spots indicate predominant intermolecular C—H....O hydrogen bonds and short intermolecular contacts. Similarly, the shape index map, plotted from -1.00 to 1.00 a.u., highlights concave regions consisting of adjacent red and blue triangle-shaped spots that suggest π-π stacking interactions [20]. The mapping also displays white spots at distances equivalent to the sum of the van der Waals radii, and blue regions that exceed the sum of the van der Waals radii. Transparent surfaces are used to enhance visualization of the molecule (see Figures 9a, 9b and 9c). In addition, Figure 10 provides a decomposition of the two-dimensional fingerprint plots (FP) to highlight specific close contacts between atom pairs and their respective contributions. The blue spots occurring in the center of the surface at nearby de = di ≃ 1.8 Å signpost close C...C interplanar contacts. These contacts are linked to π–π stacking interactions and account for 10.4 % of the total Hirshfeld surface area (323.79 Å2), as shown in Figure 10a and predicted by the X-ray study. The main contribution to the Hirshfeld surface (34.9 %) is from H…O/O…H contacts which are depicted as blue spikes on the left side with the tip at de + di = 2.6 Å, top and bottom on the left side (Figure 10b), indicates the existence of O…H contacts.As planned in organic compounds, the H...H contacts are great with a 33.3% contribution to the Hirshfeld surface area. These are positioned in the central area of the FP, with a blue peak in the center at de = di = 1.20 Å (see Figure 10c). In addition, the C…H/H…C plot (16.0 %) provides information on intermolecular C…H contacts (Figure 10d). Also, Figures 10e and 10f show C…O/O…C and O…O contacts in the FP with weak contributions to the Hirshfeld surface (4.4% for C…O/O…C and 1.0 % for O…O).
 | Figure 9a. Hirshfeld surfaces mapped over dnorm (-0.117 to 1.324 a.u.) |
 | Figure 9b. Shape-index map (-1.000 to 1.000 a.u) |
 | Figure 9c. 2D plot showing the exact location of π–π stacking interactions |
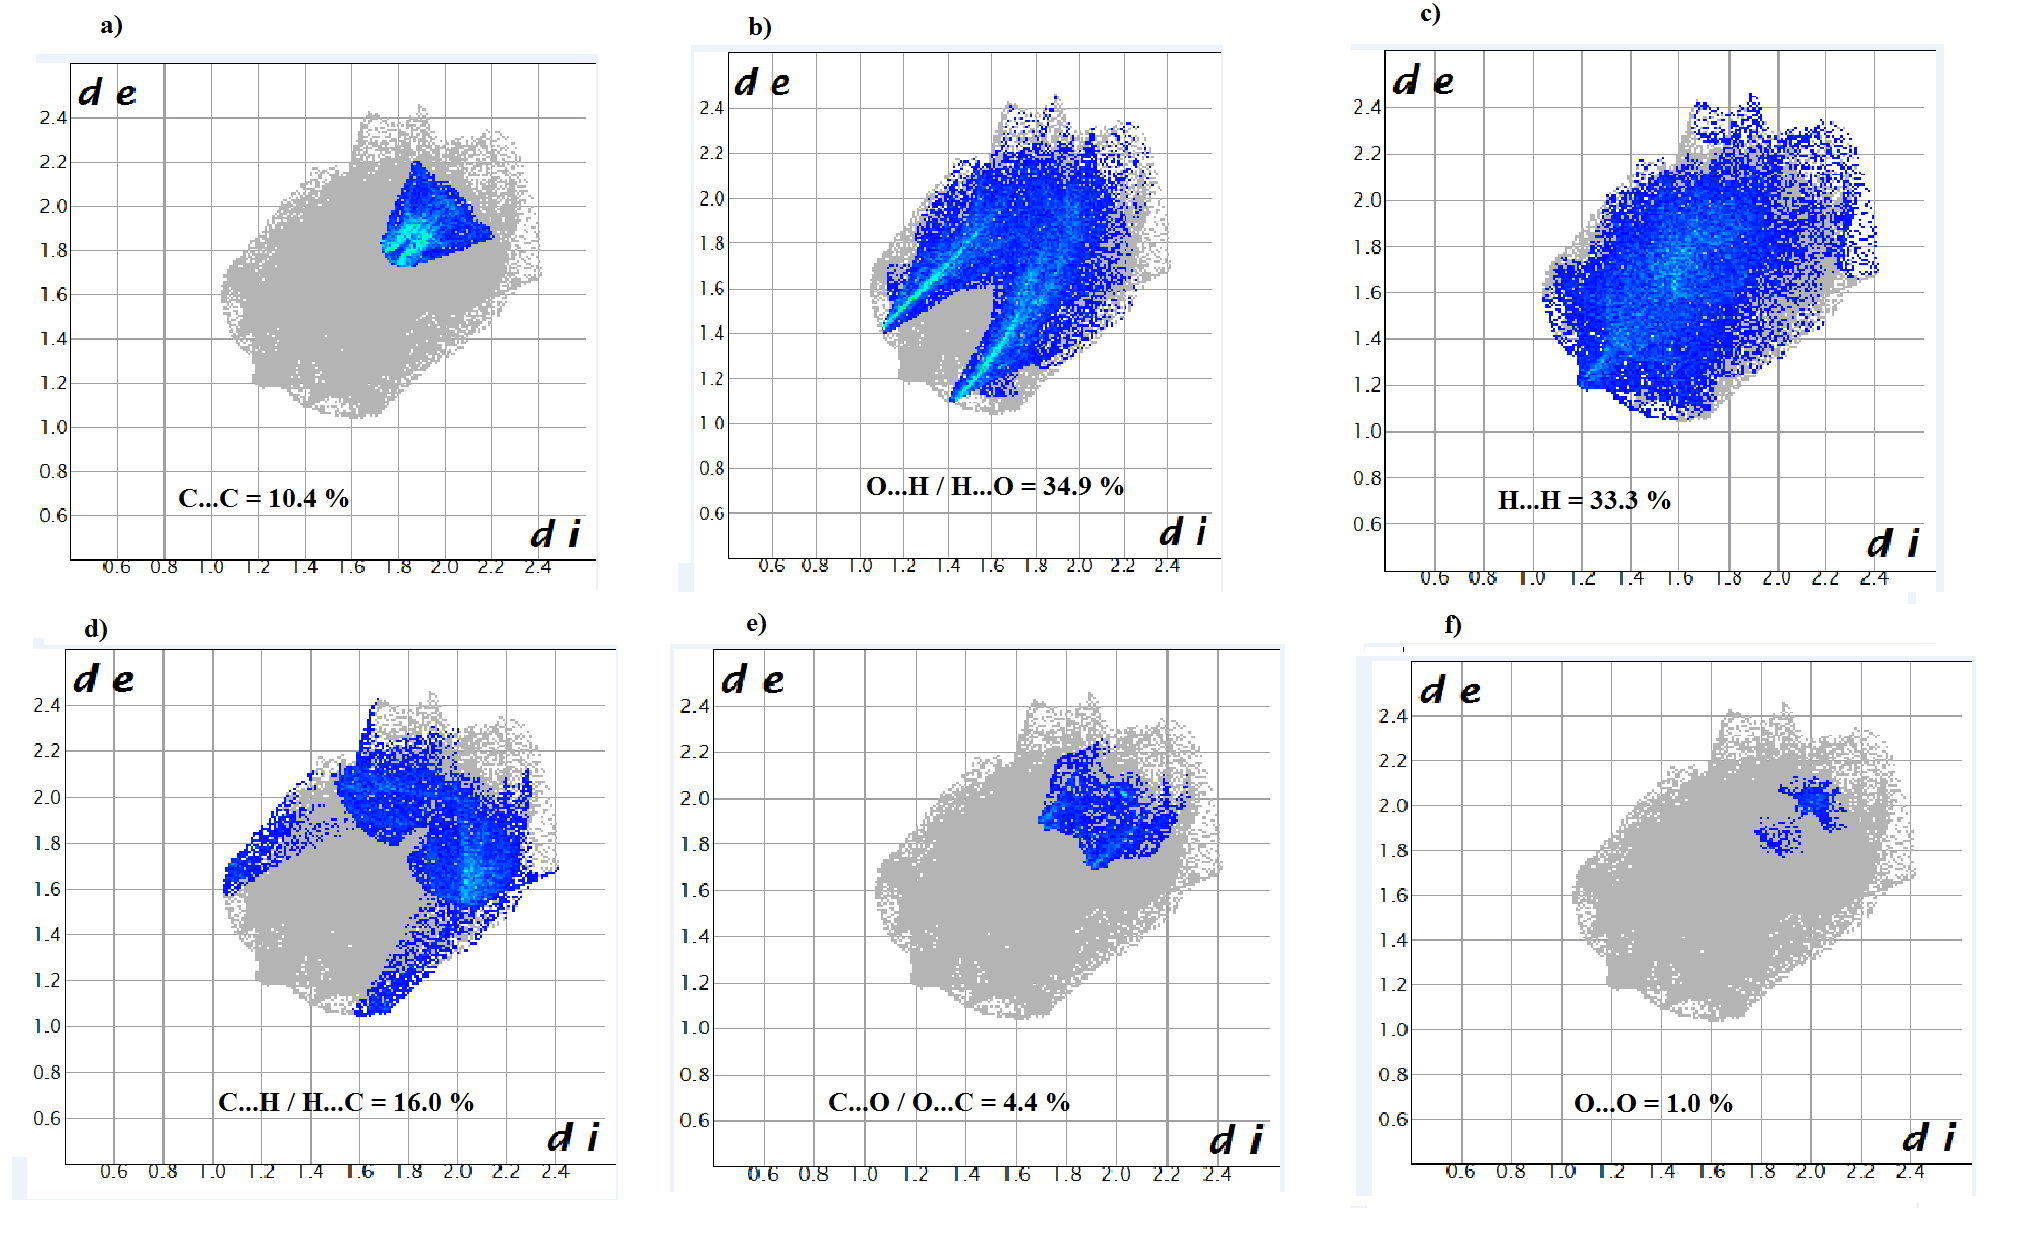 | Figure 10. Decomposed two-dimensional fingerprint plots for the title compound. Various close contacts and their relative contributions are indicated |
3.4. Theoretical Calculations
3.4.1. Comparison of Geometrical Parameters and Vibrational Frequencies
- Three methods were utilized to compare crystallographic (XRD) and computed structures. The first two approaches are used to compare geometric parameters, while the third is reserved for comparing spectra.
3.4.1.1. Comparison of Geometrical Parameters
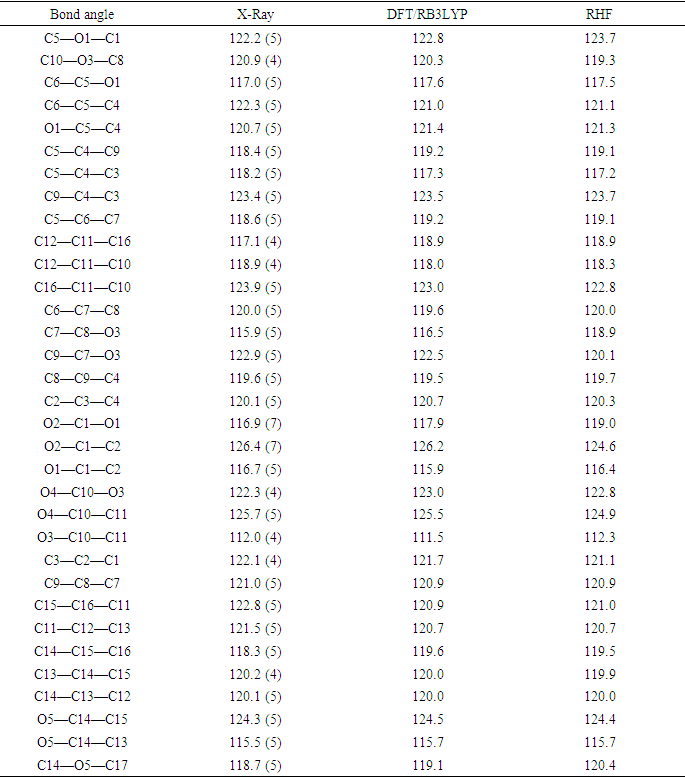
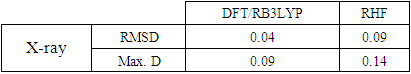
- The first approach involved comparing the geometrical parameters from quantum computations to those acquired from the X-ray crystallographic study. Analyzing the computational bond lengths and angles and aligning them with the crystallographic outcomes displays a considerable accordance between them, evidenced by a root-mean-square deviation of 0. 014 Å (DFT/RB3LYP) and 0.016 Å (RHF) for bond lengths, and 0.8° (DFT/RB3LYP) and 1.2° (RHF) for bond angles (Tables 5 and 6).
|
|
|
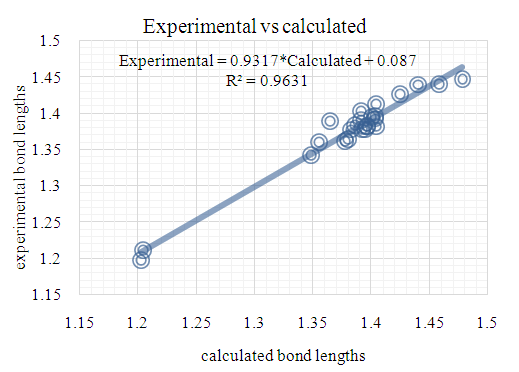 | Figure 11. DFT/B3LYP correlation graphic between the experimental and theoretical bond lengths in (Å) |
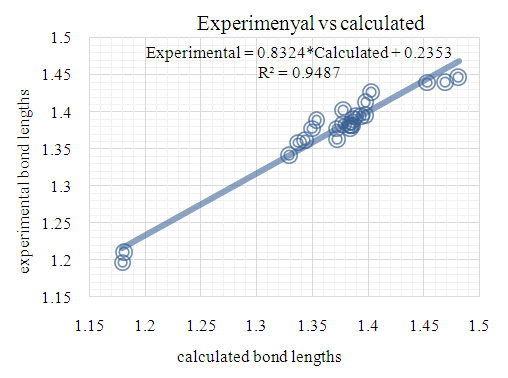 | Figure 12. RHF correlation graphic between the experimental and theoretical bond lengths in (Å) |
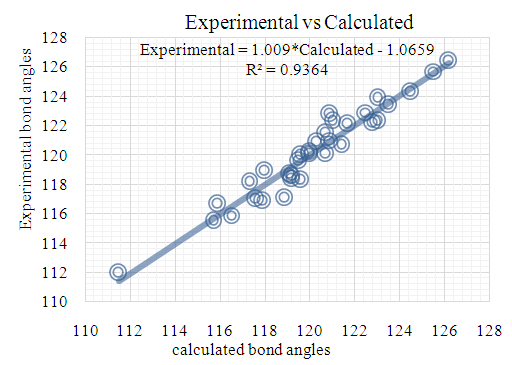 | Figure 13. DFT/B3LYP correlation graphic between the experimental and theoretical bond angles in (°) |
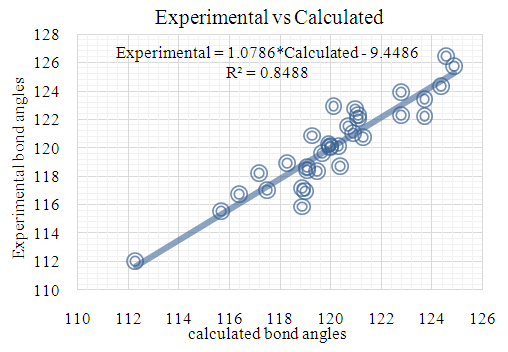 | Figure 14. RHF correlation graphic between the experimental and theoretical bond angles in (°) |
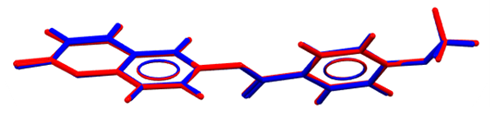 | Figure 15. Atom-by-atom superimposition of the X-ray structure (blue) on the calculated structure of (I), red, by (DFT/ B3LYP/6-311++G(d,p) |
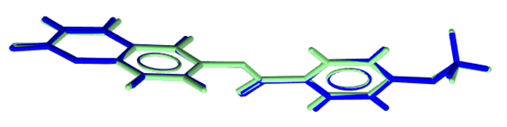 | Figure 16. Atom-by-atom superimposition of the X-ray structure (blue) on the calculated structure of (I), green, by RHF/6-311++G(d,p) |
|
3.4.1.2. Comparison of Experimental and Computed Infrared Spectra
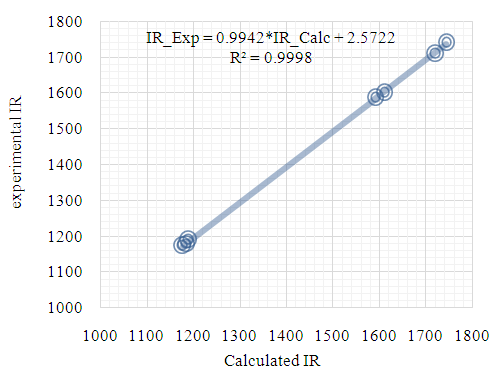 | Figure 17. Correlation graphic between the experimental and theoretical DFT vibration frequencies (cm–1) |
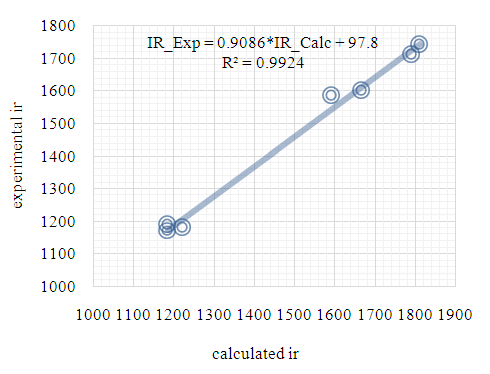 | Figure 18. Correlation graphic between the experimental and theoretical HF vibration frequencies (cm–1) |
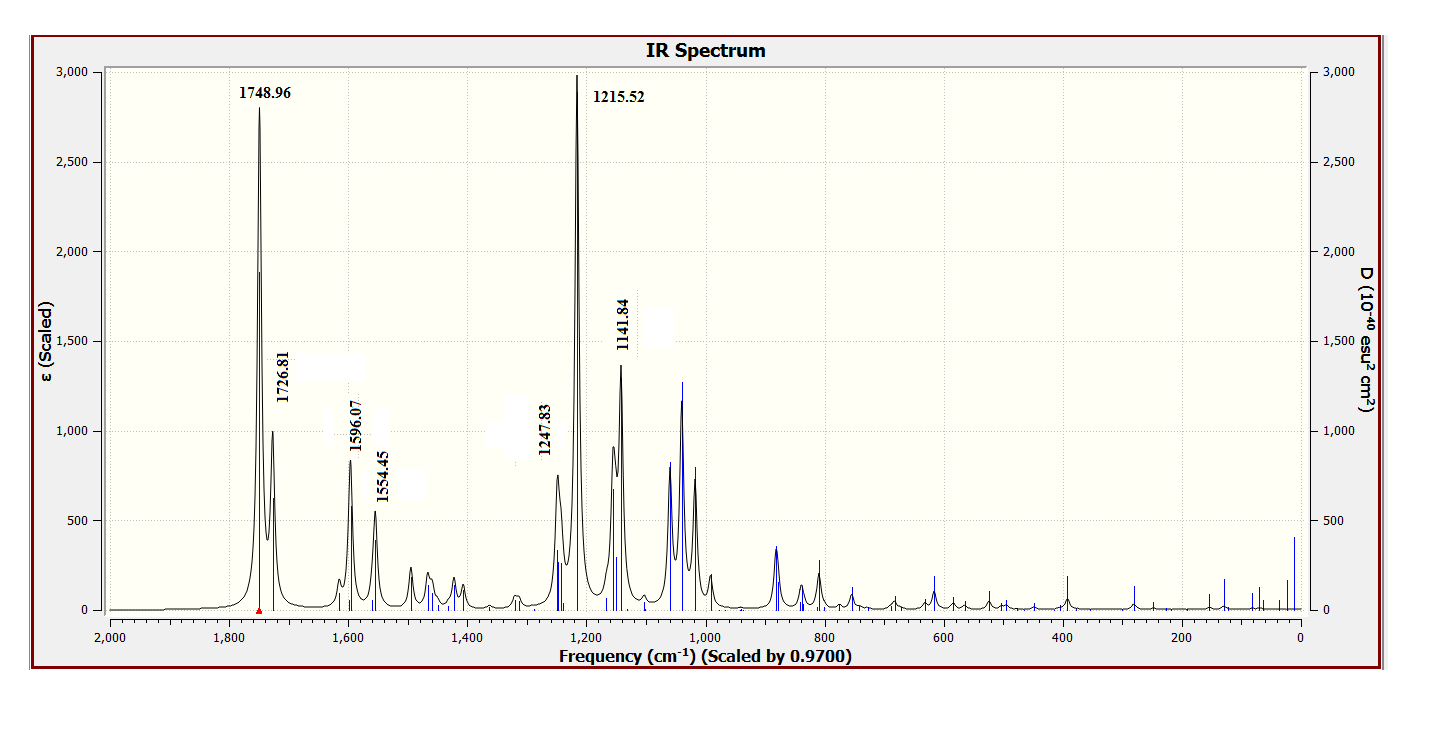 | Figure 19. DFT Calculated vibrational spectra of compound (I) |
 | Figure 20. DFT Calculated vibrational spectra of compound (I) |
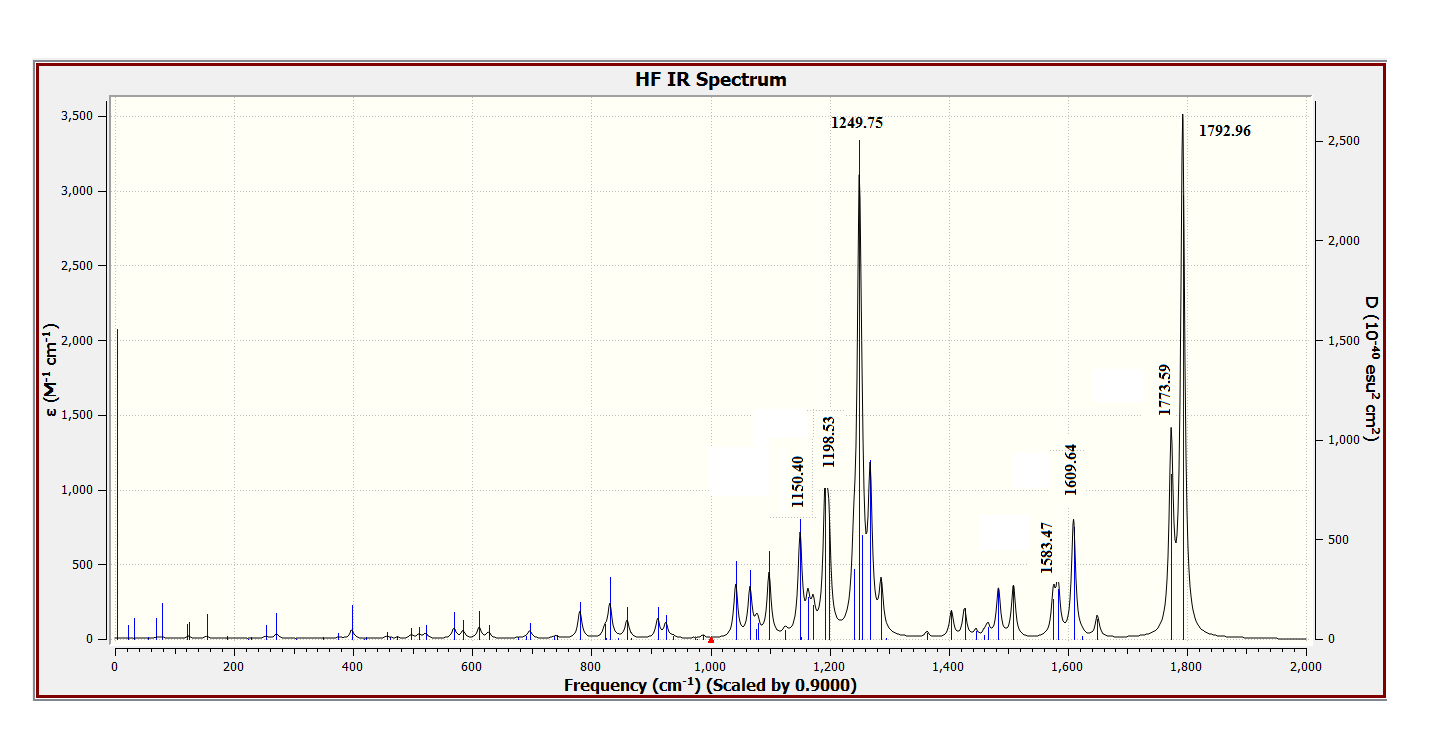
- As third approach of comparison, we have computed the theoretical infrared spectra with frequency calculations utilizing DFT/B3LYP and HF methods. Some vibrational modes assigned by the Avogadro software [22] are listed in Table 9 alongside their corresponding experimental values. We conducted statistical models as linear regression between experimental and theoretical scaled frequencies that yield correlation R2 values of 0.999 for DFT/B3LYP and 0.992 for HF models (Figures 17 and 18). These R2 values close to unity demonstrate that the linear model developed here are appropriate for accurately estimating experimental infrared frequencies.
|
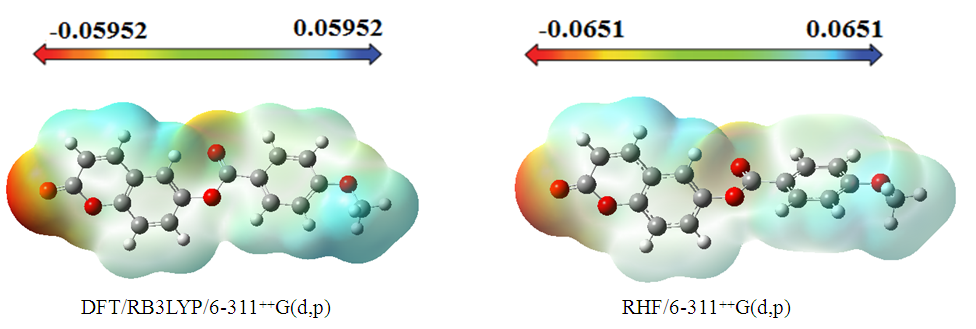
3.4.2. Molecular Electrostatic Potential (MEP)
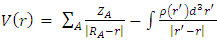
- The molecular electrostatic potential (MEP) is a useful property for examining the reactivity of various compounds and species. This property can be observed physically and measured experimentally using diffraction methods [23-24]. Additionally, computational methods can be employed to investigate MEP, thereby providing insight into various species' reactivity through wide-ranging electronic and nuclear charge distribution [25].For ease of use, potential V(r) is commonly expressed in atomic units (a.u.), taking on the following form [26]:
 | (1) |
 | Figure 21. MEP map (in atomic units) calculated using DFT/RB3LYP/6-311++G(d,p) and RHF/6-311++G(d,p) |
3.4.3. HOMO-LUMO Analysis
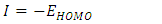
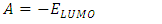
- The energy levels and distributions of the highest occupied molecular orbital (HOMO) and the lowest unoccupied molecular orbital (LUMO) of (I) are depicted in Figure 22. The calculations were carried out at both DFT/RB3LYP/6-311++G(d,p) and RHF/6-311++G(d,p) methods. The results indicate that the title compound possesses 77 occupied molecular orbitals, with the respective energy separation between LUMO and HOMO equaling to 4.40 and 9.76 eV. The orbital gaps, ranging from 4.40-9.76 eV, indicate that 2-oxo-2H-chromen-6-yl 4-methoxybenzoate is stable and less chemical reactive and is also called hard molecule [27], as also evidenced by the absence of imaginary frequencies in the results of both theoretical calculations. The computational results for compound (I), i.e. optimization, HOMO and LUMO energies are presented in Table 10 along with energy gap (Δ𝐸), ionization potential (𝐼), electron affinity (𝐴), absolute electronegativity (𝜒), absolute hardness (𝜂) and softness (𝑆). All parameters added to the table 10 have been estimated by using the following formulas utilizing the HOMO and LUMO energies of the molecule [28].
 | (2) |
 | (3) |
 | (4) |
 | (5) |
 | (6) |
 | (7) |
|
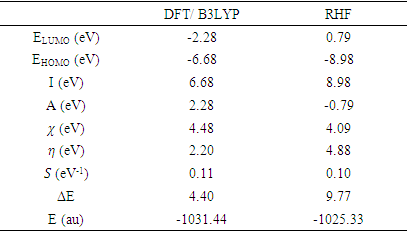
 | Figure 22. The distributions and energy levels of the HOMO and LUMO orbitals computed for compound (I) |
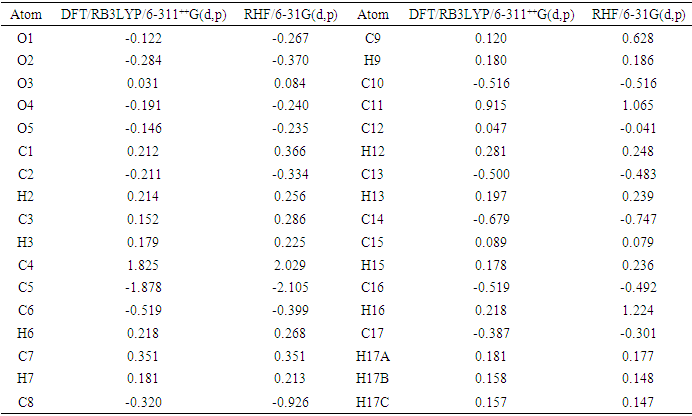
3.4.4. The Mulliken Charge Population
- The Mulliken atomic charge calculation is vital in the application of quantum chemical computations to molecular systems, as atomic charges affect properties such as dipole moment, molecular polarizability, and electronic structure. The distributions for the equilibrium geometry of the title compound calculated by the Mulliken method [29-32] are presented in Table 11. Analysis of data from table 11 highlight that the intermolecular contacts are governed by electrostatic interactions. Indeed, the electrostatic force causes intermolecular contact between partially charged atoms of opposite signs, such as the pair of atoms (O2, H17A) with charges (-0.284 e, 0.181e) for the DFT model and (-0.370 e, 0.177e) for the HF model, leading to the interaction O2...H17A. The same applies to (H9, O4) with (0.180 e, -0.191 e) and (0.186 e, -0.240 e), (O2, H3) with (-0.284 e, 0.179 e) and (-0.370 e, 0.225 e) and (H12, C16) with (0.281 e, -0.519 e) and 0.248 e, -0.492 e), respectively, generate H9…O4, O2…H3 and H12…C16 interactions.
|
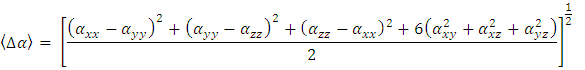
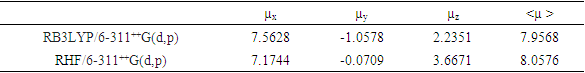
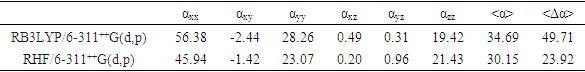
3.4.5. Non Linear Optical Properties
- Nonlinear optical (NLO) effects occur when electromagnetic fields interact with different media, resulting in new fields that have altered phase, frequency, amplitude, or other propagation characteristics compared to the incident fields [33]. Avoiding excessive jargon and complex sentences, this definition is clear, concise, and objective. In recent years, the potential applications of new materials exhibiting efficient nonlinear optical (NLO) properties have generated significant interest for their use in modern communication technology, data storage, telecommunications, and optical signal processing. Numerous research papers have been published on this topic [34-38]. The current expectation is that utilizing quantum chemical methods such as Hartree-Fock (HF) and density functional theory (DFT) for molecular hyperpolarizabilities will provide supervision and hasten subsequent experimental studies [39-40].Thus, in this study, we calculated the dipole moments (μ), polarizabilities (<α>), anisotropy of polarizabilities (<Δα>), and first-order hyperpolarizabilities (β), which indicate the material's ability to generate second-order non-linear effects [41]. The calculations were performed at RHF and DFT/RB3LYP optimized geometries using the GAUSSIAN-09W program package [14] and the 6-311++G(d,p) basis set. These parameters are defined as [42-43].
 | (8) |
 | (9) |
 | (10) |
 | (11) |
|
|
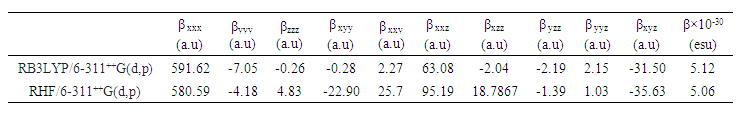 | Table 14. All β (a.u.) components and β ×10−30 (esu) values calculated using HF and DFT levels of theory |
5. Conclusions
- The molecular structure was examined in this study using Spectrometry and X-ray crystallography. Intermolecular interactions were also analyzed through Hirshfeld surface analysis.Additionally, molecular electrostatic potential, HOMO-LUMO analysis, Mulliken charge populations, and nonlinear optical properties of 2-oxo-2H-chromen-6-yl 4-methoxybenzoate were investigated utilizing DFT/RB3LYP/6-311++G(d,p) and RHF/6-311++G(d,p) calculations. The computed geometric parameters, including bond length, bond angle, torsion angle, and infrared spectrum, are compared to their corresponding experimental data. The comparison reveals no significant differences between the experimental and theoretical structures, except for the experimental torsion angle, C10—O3—C8—C9, which differs from the RHF calculated value. The MEP maps indicate that negative potential sites reside on electronegative atoms, and positive potential sites are found around the hydrogen atoms. This information reveals the areas where intra- and intermolecular interactions can occur. Additionally, the Mulliken charges in the solid state can confirm or refute the C9-H9...O4 intermolecular hydrogen bonds and some short interactions in the structure. Besides, the compound's calculated average linear polarizability value using DFT/B3LYP and HF methods shows nonlinear optical properties for compound (I).
ACKNOWLEDGEMENTS
- The authors thank the Spectropole Service of the Federation of Chemical Sciences at Aix-Marseille University in France for conducting the complete analysis.
References
| [1] | Basanagouda, M., Kulkarni, M. V, Sharma, D., Gupta, V. K., Pranesha, P., Sandhyarani; P., and Rasal, V. P, 2009, J. Chem. Sci., 121, 485–495. |
| [2] | Vuković, N., Sukdolak, S., Solujić, S., and Niciforović, N., 2010, Arch. Pharm. Res., 33, 5–15. |
| [3] | Emmanuel-Giota, A. A., Fylaktakidou, K. C., Litinas, K. E., Nicolaides, D. N., and Hadjipavlou-Litina, D., 2001, J. Heterocycl. Chem., 38, 717–722. |
| [4] | Abou, A., Djandé, A., Kakou-Yao, R., Saba, A., and Tenon, A. J., 2013, Acta Cryst., E69, o1081–o1082. |
| [5] | Ouédraogo, M., Abou, A., Djandé, A., Ouari, O., and Zoueu, T. J., 2018, Acta Cryst., E74, 530–534. |
| [6] | Tse-Lok, H., Hard soft acids bases (HSAB) principle and organic chemistry, 1975, Chem. Rev. 75(1), 1-20. |
| [7] | Rigaku, OD., 2015, CrysAlis PRO. Rigaku Oxford Diffraction, Yarnton, England. |
| [8] | Burla, M C., Caliandro, R., Carrozzini, B., Cascarano, G. L., Cuocci, C., Giacovazzo, C., Mallamo, M., Mazzone, A., and Polidori, G., 2015, J. Appl. Cryst., 48, 306–309. |
| [9] | Farrugia, L J., 2012, J. Appl. Cryst., 45, 849–854. |
| [10] | Sheldrick, G. M., 2015, Acta Cryst., C71, 3–8. |
| [11] | Spek, A. L., 2009, Acta Cryst., D65, 148–155. |
| [12] | Parsons, S., Flack, H.D., and Wagner, T., 2013, Acta Cryst., B69, 249-259. |
| [13] | Wolff, S. K., Grimwood, D. J., McKinnon, J. J., Turner, M. J., Jayatilaka, D., and Spackman, M. A., 2012, Crystal Explorer. The University of Western Australia. |
| [14] | Frisch, M. J., Trucks, G. W., Schlegel, H. B., Scuseria, G. E., Robb, M. A., Cheeseman, J. R., et al., 2013, GAUSSIAN09. Gaussian, Inc., Wallingford, CT, USA. |
| [15] | Hamdane, D., Lechauve, C., Marden, M.C., and Golinelli-Pimpaneau, B., 2009, Acta Cryst., D65, 388–392. |
| [16] | Gomes, L. R., Low, J. N., Fonseca, A., Matos, M. J., and Borges, F., 2016, Acta Cryst., E72, 926–932. |
| [17] | Ziki, E., Yoda, J., Djandé, A., Saba, A., and Kakou-Yao, R., 2016, Acta Cryst., E72, 1562–1564. |
| [18] | Cremer, D., & Pople, J., 1975, J. Am. Chem. Soc., 97, 1354–1358. |
| [19] | Janiak, J., 2000, J. Chem. Soc. Dalton Trans., 3885–3896. |
| [20] | Bitzer, S. R., Visentin, C. L., Hörner, M., Nascimento, M. A. C., and Filgueiras, C. A. L., 2017, J. Mol. Struct., 1130, 165–173. |
| [21] | Macrae, C.F., Sovago, I., Cottrell, S. J., Galek, P. T. A., McCabe, P., Pidcock, E., Platings, M., Shields, G. P., Stevens, J. S., Towler, M., and Wood, P. A., 2020, J. Appl. Cryst., 53, 226-235. |
| [22] | Hanwell, M.D., Curtis, D.E., Lonie, D.C., Vandermeersch, T., Zurek, E., and Hutchison, G. R., “Avogadro: An advanced semantic chemical editor, visualization, and analysis platform” 2012, J. Cheminformatics, 4-17. |
| [23] | Politzer, P., & Truhlar, D. G., 1981, Editors. Chemical Applications of Atomic and Molecular Electrostatic Potentials. New York : Plenum Press. |
| [24] | Stewart, R. F., 1979, Chem. Phys. Lett., 65, 335–342. |
| [25] | Murray, J. S., & Politzer, P., 2011, WIREs Comput. Mol. Sci., 1, 153–163. |
| [26] | Politzer, P., and Murray, J. S., 2002, Theor. Chem. Acc., 108(3), 134–142. |
| [27] | Cinar, E. B., Faizi, Md. S. H., Yagci, N. K., Dogan, O. E., Aydin, A. S., Agar, E., Dege, N., & Mashrai, A., 2020, Acta Cryst., E76, 1551–1556. |
| [28] | Pearson, R. G., 1986, Proc. Natl. Acad. Sci. U.S.A. Nov., 83(22), 8440-8441. |
| [29] | Mulliken, R. S., 1955, J. Chem. Phys., 23(10), 1833–1840. |
| [30] | Mulliken, R. S., 1955, J. Chem. Phys., 23(10), 1841–1846. |
| [31] | Mulliken, R. S., 1955, J. Chem. Phys., 23(12), 2338–2342. |
| [32] | Mulliken R. S., 1955, J. Chem. Phys., 23(12), 2343–2346. |
| [33] | Y. X. Sun, Q. L. Hao, W. X. Wei, Z. X. Yu, L. D. Lu, X. Wang, and Y. S. Wang, 2009, J. Mol. Struct. Theochem., 904, 74–82. |
| [34] | R. Zhang, B. Du, G. Sun, and Y. Sun, 2010, Spectrochim. Acta A, 75, 1115–1124. |
| [35] | S. Yazıcı, Ҫ. Albayrak, I. Gümrükçüoǧlu, I. Șenel, and O. Büyükgüngör; 2011, J. Mol. Struct., 985, 292–298. |
| [36] | D. S. Chemia, and J. Zyss, NonLinear Optical Properties of Organic Molecules and Crystal, Academic Press, New York, NY, USA, 1987. |
| [37] | J. Zyss, Molecular NonLinear Optics, Academic Press, Boston, Mass, USA, 1994. |
| [38] | A. Ben Ahmed, H. Feki, Y. Abid, and C. Minot; 2010, Spectrochim. Acta A, 75, 1315–1320. |
| [39] | Suponitsky, K.Y., Tafur, S, Masunov, A.E., 2008, J. Chem. Phys., 129, 044109-11. |
| [40] | Avci, D., Başoğlu, A., Atalay, Y., 2011, Int. J. Quantum Chem., 111, 130-147. |
| [41] | A. E.H. Machado, N. M.B. Neto, L. T. Ueno, L. F. de Paula, D. M.S. Araújo, G. S. Oliveira, W. R. Gomes, R. de P. P. L. Franzen, S. C. Zilio, A. M.F. Oliveira-Campos, A.M. Fonseca, L. M. Rodrigues, P.O. Nkeonye, R. Hrdina, 2008, J. Photochem. Photobiol. A 199, 1, 23–33. |
| [42] | Abraham, J.P., Sajan, D., Joe I.H., and Jayakumar, V.S., 2008, Spectrochim. Acta A, 71, 355-367. |
| [43] | Karamanis, P., Pouchan, C., and Maroulis, G., 2008, Phys. Rev. A 77, 013201-013208. |
| [44] | Ben Ahmed, A., Feki, H., Abid, Y., Boughzala, H., and Mlayah, A., 2008, J. Mol. Struct., 888, 180-186. |
| [45] | Nkungli, N.K., Ghogomu, J.N., 2016, J. Theor. Chem., 2016, 1–19. |
| [46] | Pluta, T., Sadlej, A.J., 2001, J. Chem. Phys., 114, 136. |
| [47] | Song, X., Farwell, S.O., 2004, J. Anal. Appl. Pyrolysis, 71, 901–915. |
| [48] | Eșme, A., Güneșdoǧdu Saǧdinç, S., 2014, BAÜ Fen Bil. Enst. Dergisi Cilt. 16(1), 47-75. |