-
Paper Information
- Paper Submission
-
Journal Information
- About This Journal
- Editorial Board
- Current Issue
- Archive
- Author Guidelines
- Contact Us
American Journal of Organic Chemistry
p-ISSN: 2163-1271 e-ISSN: 2163-1301
2020; 10(1): 1-16
doi:10.5923/j.ajoc.20201001.01

Synthesis, Spectrometric Characterization (ESI-MS, NMR, IRTF), X-Ray Study and Quantum Chemical Calculations of 2-oxo-2H-chromen-7-yl Benzoate
 Abstract
 Reference
 Full-Text PDF
 Full-text HTML
Akoun Abou1, Abdoulaye Djandé2, Amadou Tidjani Ilagouma3, Olivier Ouari4, Adama Saba2
1Department of Training and Research in Electrical and Electronic Engineering, Research Team: Instrumentation, Image and Spectroscopy, Félix Houphouët-Boigny National Polytechnic Institute, Yamoussoukro, Côte d’Ivoire
2Department of Chemistry, Laboratory of Molecular Chemistry and Materials, Research Team: Organic Chemistry and Phytochemistry, University Joseph KI-ZERBO, Ouagadougou, Burkina Faso
3Department of Chemistry, Faculty of Sciences and Technology, Laboratory of Natural Substances and Organic Synthesis, University Abdou MOUMOUNI, Niamey, Niger
4Department of Chemistry, Radical Chemistry Institute, Research Team SREP, Aix-Marseille University, Marseille, France
Correspondence to: Akoun Abou, Department of Training and Research in Electrical and Electronic Engineering, Research Team: Instrumentation, Image and Spectroscopy, Félix Houphouët-Boigny National Polytechnic Institute, Yamoussoukro, Côte d’Ivoire.
| Email: |  |
Copyright © 2020 The Author(s). Published by Scientific & Academic Publishing.
This work is licensed under the Creative Commons Attribution International License (CC BY).
http://creativecommons.org/licenses/by/4.0/

The paper presents a combined experimental and computational study of 7-substituted coumarin derivative, the 2-oxo-2H-chromen-7-yl benzoate (I). The compound was prepared in the laboratory by linking the coumarin system (7-hydroxycoumarin) to benzoyl chloride and crystallized in the monoclinic space group P21 with 𝑎 = 3.86010(10), 𝑏 = 27.7876(9), 𝑐 = 5.7453(2) Å, 𝛼 = 𝛾 = 90, 𝛽 =91.063(3)° and 𝑍 = 2. The compound has been characterized structurally by spectroscopy and by single-crystal X-Ray diffraction. In the latter, the structure of (I) was solved by direct methods and refined to a final R value of 0.038 for 2260 independent reflections. Its structure is stabilized by intramolecular C-H···O and intermolecular C-H···O hydrogen bonds that extended as infinite 1D chain along [001]. Stabilization is also ensured by oxygen-π stacking interaction between the aromatic ring and oxygen of the benzoate moiety. The analysis of intermolecular interactions through the mapping of dnorm and shape-index revel that the most significant contributions to the Hirshfeld surface 36.2 and 27.9% are from H···H and O···H contacts, respectively. Besides, the molecular geometry of (I) was also optimized using density functional theory (DFT/RB3LYP), the basic ab initio model i.e the restricted Hartree-Fock (RHF) methods with the 6-311++G(d, p) basis set in ground state and frequency calculations with RB3LYP method using 6-31G(d,p) basis set. The theoretical data resulting from these quantum chemical calculations are generally in good agreement with the observed structure. The only significant observed difference is in the torsion angles between the coumarin ring system and the benzoate ring, where the observed C—O—C—C value (59.6 (4)°) is slightly lower than the DFT/RB3LYP calculated value (54.32°) and the frequency calculations (41.23°) value and larger than that of the RHF computed value (110.63°). The non-linear optical effects (NLO), molecular electrostatic potential (MEP), frontier molecular orbitals (FMO), and the Mulliken charge distribution were also investigated theoretically. The theoretical HOMO–LUMO energy gap values originating from these calculations are 4.465 eV (DFT/RB3LYP/6–311++G(d,p)) and 4.434 eV (FREQ/ RB3LYP/6–31G(d,p)).
Keywords: 7-substituted coumarin derivative, Spectroscopic analysis, Crystal structure, Conformational analysis, Hirshfeld surface analysis, Quantum chemical calculations
Cite this paper: Akoun Abou, Abdoulaye Djandé, Amadou Tidjani Ilagouma, Olivier Ouari, Adama Saba, Synthesis, Spectrometric Characterization (ESI-MS, NMR, IRTF), X-Ray Study and Quantum Chemical Calculations of 2-oxo-2H-chromen-7-yl Benzoate, American Journal of Organic Chemistry, Vol. 10 No. 1, 2020, pp. 1-16. doi: 10.5923/j.ajoc.20201001.01.
Article Outline
1. Introduction
- The 2-oxo-2H-chromen-7-yl benzoate ring system derivatives commonly called coumarin derivatives attracted significant attention because of their interesting biological profile including anti-HIV [1,2], anti-coagulant [3], anti-oxidant [4], anti-tumor [5], anti-bacterial [6], and anti-inflammatory properties [7].They found applications in cosmetic and food industries [8] and are also potential laser dyes [9]. Owing its versatile properties, coumarin ring system has become a hub nucleus in the developing of new molecules in organic, medicinal and material chemistry.In view of their importance and as a continuation of our research in the field crystal structure analysis and theoretical calculations of new coumarin derivatives [10,11], we herewith report the synthesis, spectroscopic characterization, crystal structure, geometry optimization and Hirshfeld surface analysis of the title ester derivative of coumarin scaffold (I).
2. Experimental and Theoretical Methods
2.1. Synthesis
- To a solution of benzoyl chloride (6.17 mmol; 0.75 ml.) in dried diethyl ether (25 ml), was added dried trimethylamine (3.6 molar equivalents; 3.2 ml) and 7-hydroxycoumarin (6.17 mmol; 1g) by small portions over 30 min. The reaction mixture was left under agitation for 2 hours at room temperature and refluxed for 2 hours.The mixture was then poured into 40 ml of dichloromethane and acidified with diluted hydrochloric acid until the pH was 2–3. The organic layer was extracted, washed with water to neutrality, dried over MgSO4 and the solvent removed. The resulting precipitate was filtered off with suction, washed with petroleum ether and recrystallized from chloroform. Pale yellow crystals of the title compound were obtained: yield 93.7%; M.pt. 430-432 K.
2.2. Electrospray Ionisation Mass Spectrum
- Mass spectrometry is a highly useful technique in the field of structural chemistry. Electrospray ionization mass spectrometry (ESI-MS), with an accuracy of about 0.01%, offers an extremely sensitive method for determining the precise molecular mass of small and biological molecules. The spectrum of figure 1 was recorded on a 3200 QTRAP (Applied Biosystems SCIEX) spectrometer equipped with a pneumatically assisted air pressure ionization (API) source for ESI-MS+ experiment.
2.3. IR Spectrum
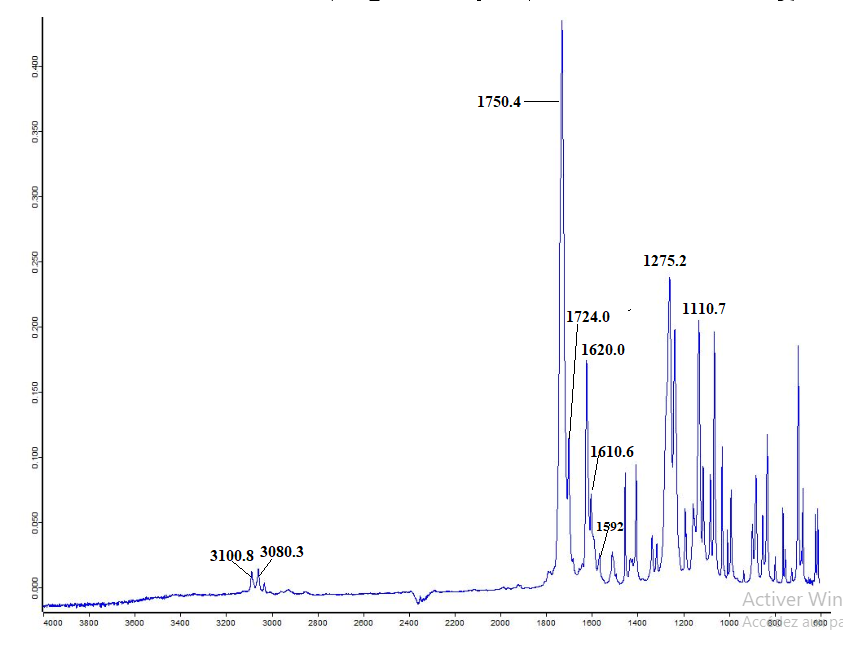
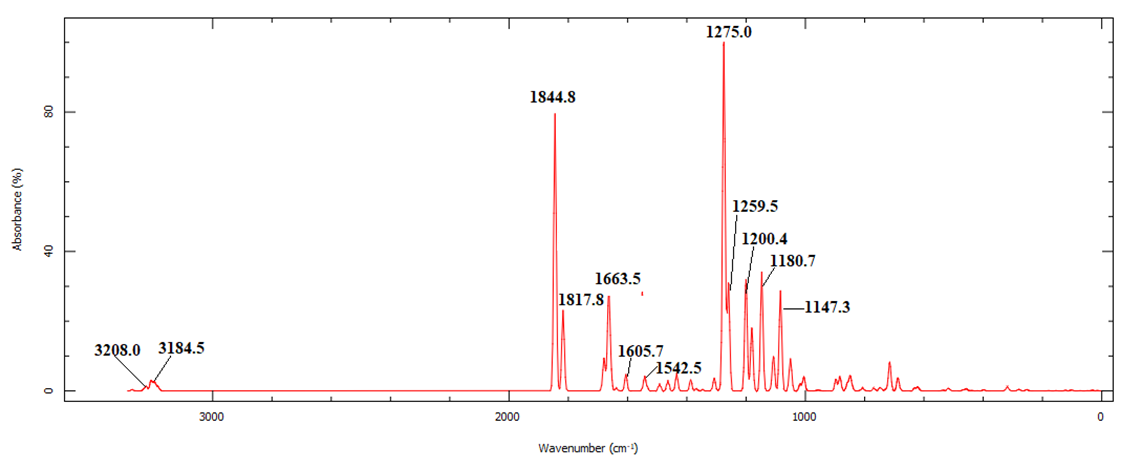
- The infrared (IR) spectrum, Figure 2, was recorded on a Bruker IFS 66/S Fourier Transform Infrared spectrometer (FT-IR), driven by the OPUS 6.5 software and using the ATR (Attenuated Total Reflection) technique. The absorption bands are expressed in wavenumber ῡ (cm-1).
2.4. 1H and 13C Spectra
 | Scheme 1. Numbering of carbon atoms used in spectra analysis |
2.5. Crystal Structure Analysis
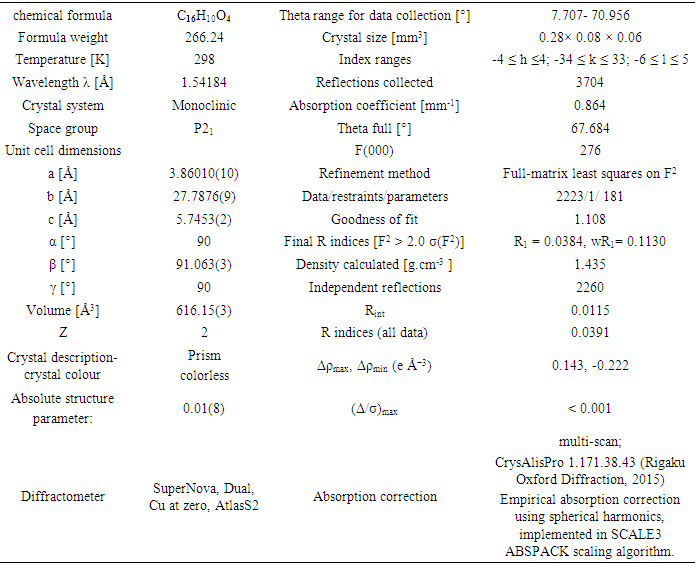
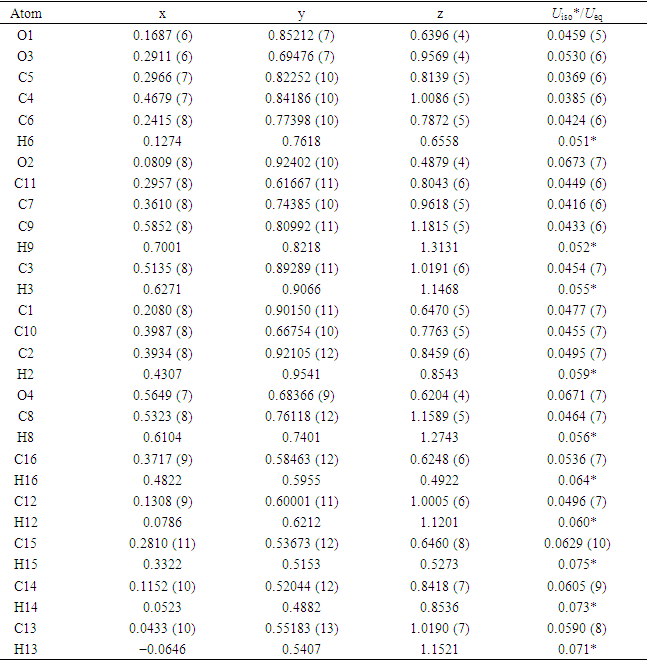
- Diffraction data for the title compound were collected on Rigaku Oxford Diffraction SuperNova, Dual, Cu at zero, AtlasS2 diffractometer [12] using a mirror monochromator and Cu Kα radiation (λ = 1.54184 Å) at 298 K. The structure was solved by direct methods using SIR 2014 [13] and implemented in the WinGX [14] program suite. The refinement was carried out by full-matrix least squares method on the positional and anisotropic temperature parameters of the non-hydrogen atoms, or equivalently corresponding to 181 crystallographic parameters, using SHELXL2014 program [15]. All H atoms were placed in calculated positions with C—H = 0.93 Å (aromatic) and refined using a riding model approximation with Uiso(H) constrained to 1.2 times Ueq of the respective parent atom. Data collection is by CrysAlis PRO [12], cell refinement by CrysAlis PRO [12], and data reduction by CrysAlis PRO [12]. The general-purpose crystallographic tool PLATON [16] was used for the structure analysis and presentation of the results. Details of the data collection conditions, and the parameters of the refinement process are given in Table 1. Flack x parameter was determined using 1036 quotients [(I+)-(I-)]/[(I+)+(I-)] [17] for absolute structure determination.
|
2.6. Hirshfeld Surface
- Molecular Hirshfeld surfaces of 2-oxo-2H-chromen-7-yl benzoate were calculated using a standard (high) surface resolution, and with the three-dimensional dnorm surfaces mapped over a fixed colour scale of -0.0368 (red) to 1.2776 a.u. (blue) and Shape-index mapped over -1.000 to 1.000 a.u. with the program Crystal Explorer 3.1 [18].
2.7. Computational Procedures
- The geometry optimization of compound (I) was performed by using the density functional theory (DFT) with restricted RB3LYP exchange correlation functional and the restricted Hartree-Fock (RHF) methods with the 6-311++G(d, p) basis set in ground state, and vibration calculations were computed using RB3LYP method with 6-31G(d,p) basis set. The crystal structure in the solid state was used as the starting structure for the calculations. All calculations were performed with the GAUSSIAN09 program package [19].
3. Results and Discussion
3.1. Spectra Analysis
3.1.1. Electrospray Ionisation Mass Spectrum
- In the spectrum (figure 1), the peak positions of [M+H]+, [M+NH4]+ and [M+Na]+ ions at m/z 267, 284 and 289 respectively, allowed us to determine the molecular weight of 266 g.mol-1 which is consistent with the chemical formula C16H10O4.
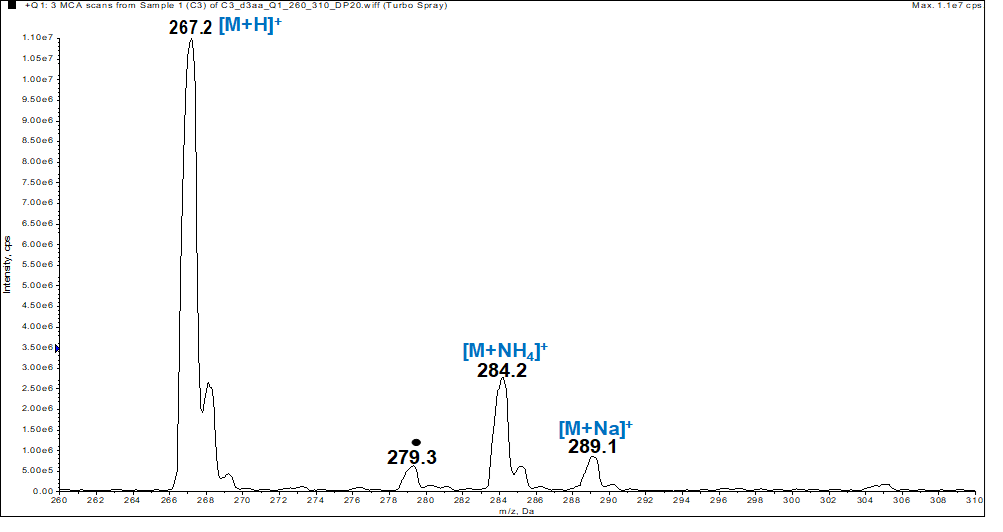 | Figure 1. ESI-MS spectrum of compound (I). The black dot denotes an ion that is not specific to the sample |
3.1.2. Infrared Spectrum
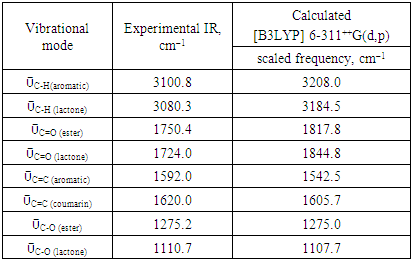
- The FT-IR spectrum of this compound (figure 2) showed a strong absorption band at 1750.4 cm-1 corresponding to ῡC=O (ester) and a medium absorption band at 1724.0 cm-1 attributed to ῡC=O (lactone). The bands observed at 1110.7 and 1275.2 cm-1 are assignable to ῡC-O (lactone) and ῡC-O (ester), respectively. The aromatic ring gave a weak band at 3100.8 cm-1 (ῡC-H) and a medium one at 1620.0 cm-1 (ῡC=C) as well as 3080.3 cm-1 (ῡC-H) and 1610.6 cm-1 (ῡC=C) for the lactonic ring.
 | Figure 2. 13C-NMR Spectrum of compound (I) |
3.1.3. 1H-NMR Spectrum
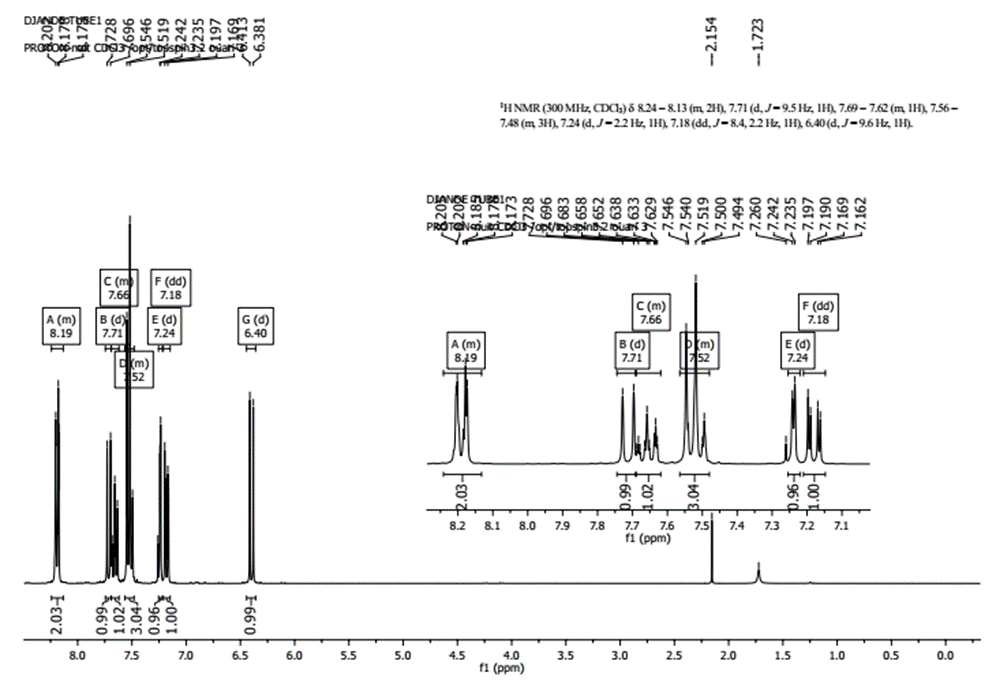
- The experimental values (chemical shifts and couplings) taken from the 1H NMR spectrum (figure 3) revealed the presence of signals in the range 6-8.5 ppm corresponding exclusively to aromatic protons: 8.24-8.13 (m, 2H, H-2’ and H-6’), 7.71 (d, 1H, J = 9.5 Hz, H-5), 7.69-7.62 (m, 1H, H-4’), 7.56-7.48 (m, 3H, H-4, H-3’ and H-5’), 7.24 (d, 1H, J = 2.2 Hz, H-8), 7.18 (dd, 1H, J = 8.4, 2.2 Hz, H-6), 6.4 (d, 1H, J = 9.6 Hz, H-3).
 | Figure 3. 1H-NMR Spectrum of compound (I) |
3.1.4. 13C-NMR Spectrum
- The 13C NMR spectrum (figure 4) exhibits, as expected, fourteen peaks.Chemical shift (ppm) and the corresponding carbon: 160.41 (C-2), 110.67 (C-3), 142.99 (C-4), 128.74 (C-5), 118.64 (C-6), 154.83 (C-7), 116.15 (C-8), 153.59 (C-9), 116.82 (C-10), 164.57 (C-11), 128.84 (C-1′), 130.38 (C-2′ and C-6′), 128.81 (C-3′ and C-5′),134.17 (C-4′).
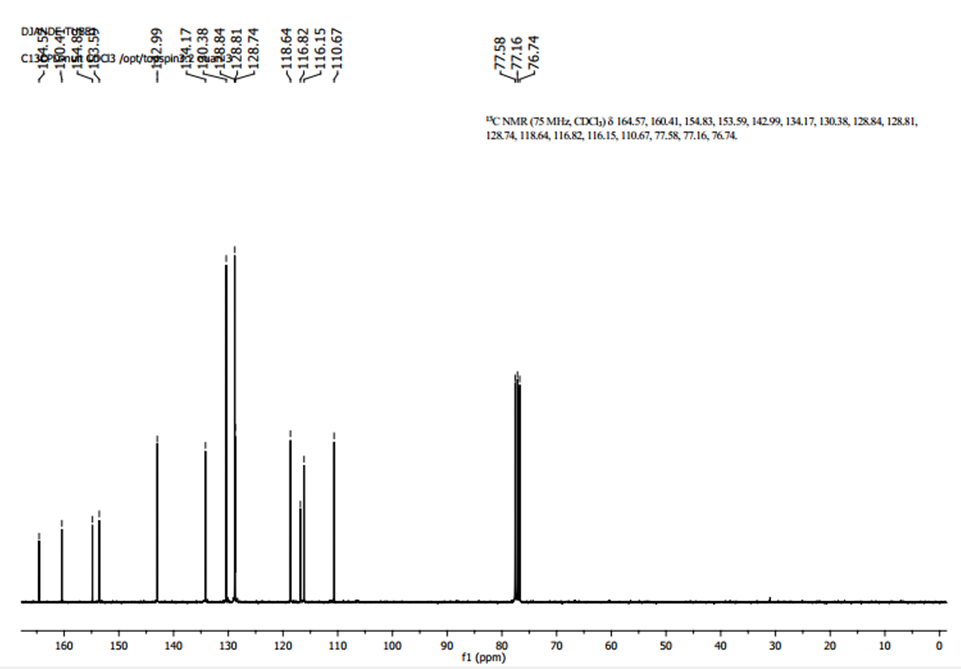 | Figue 4. 13C-NMR Spectrum for compound (I) |
3.1.5. DEPT-135 Spectrum
- The DEPT (Distorsionless Enhancement by Polarization Transfer) is a proton-carbon polarization transfer technique which has proven superior to others in providing information on attached protons reliably, efficiently and with high selectivity. So, The DEPT-135 spectrum presents positive CH3 and CH, and negative CH2 signals while quaternary carbons are invisible.The spectrum of compound (I) (Figure 5) showed only positive aromatic CH signals, note absence of quaternary carbons (C-2, C-7, C-9, C-10, C-11, and C-1′). Eight peaks were observed (δ, ppm): 110.67 (C-3), 142.99 (C-4), 128.74 (C-5), 118.64 (C-6), 116.15 (C-8), 130.38 (C-2′ and C-6′), 128.81 (C-3′ and C-5′), 134.17 (C-4′) suggesting the ten aromatic tertiary carbons.
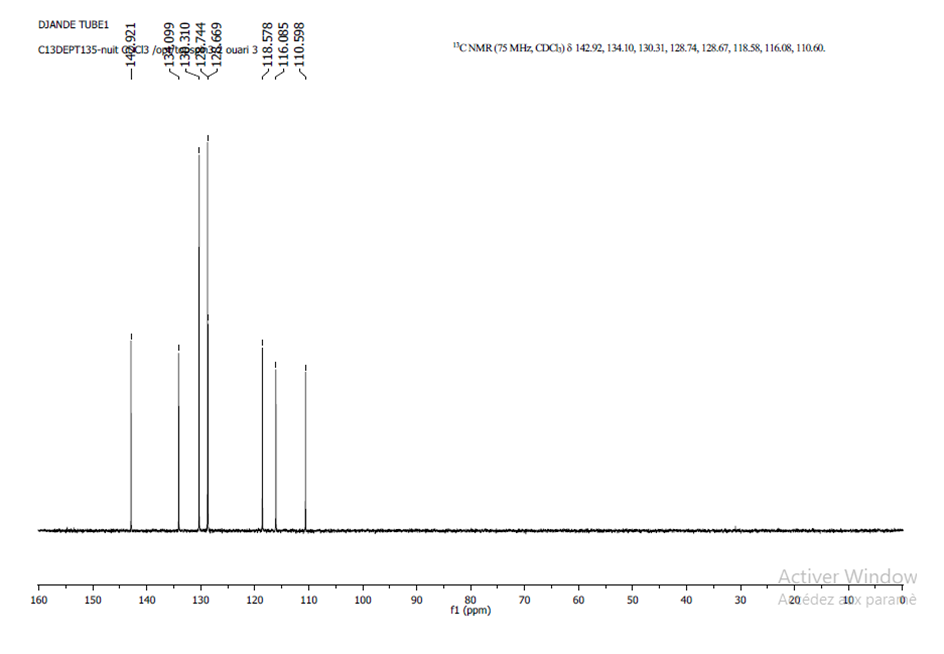 | Figue 5. DEPT-135 Spectrum of compound (I) |
3.1.6. Conclusion of Spectra Analysis
- The overlapping of the spectrometric results from the spectral analysis confirms the molecule drawn in Figure 1. Other studies such as X-ray and theoretical calculations have been used to confirm this conclusion.
3.2. Structural Description
- The molecular structure of the title coumarin derivative (I), is illustrated in Figure 6.
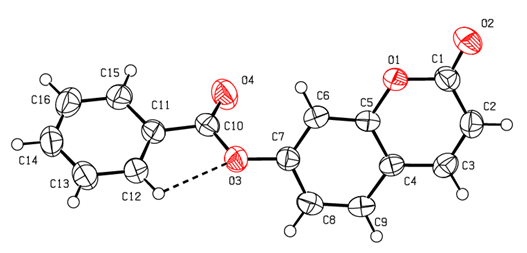 | Figure 6. An ORTEP [14] view of the title compound with the atom-numbering scheme. Displacement ellipsoids are shown at the 50% probability level. Dashed lines indicate hydrogen bonds |
3.2.1. Geometry and Conformation
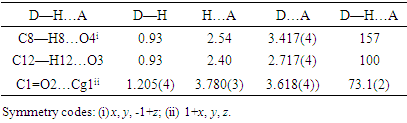
- The positional parameters, interatomic distances, bond angles and torsion angles are presented in Tables 4, 5, 6 and 7. The analysis and interpretation of the geometrical characteristics relating to bond distances compared to standard values [20] indicate that carbon-oxygen bonds:[d(C1-O1) = 1.381(4) Å and d(C5-O1) = 1.380(3) Å] are characteristic of Car-O(2) simple bond observed in other structures in coumarin ethers [21,22]. Moreover, the distance d(C10-O4) = 1.198(4) Å and d(C10-O3) = 1.355(4) Å indicate characteristic values of ester moiety. Besides, an examination of the bond lengths of the coumarin ring shows that there is a slight asymmetry of the electronic distribution around the pyrone ring: the C2—C3 [1.341(5) Å] and C1—C2 [1.443 (5) Å] bond lengths are shorter and longer, respectively, than those expected for a Car—Car bond. This suggests that the electron density is preferentially located in the C2—C3 bond of the pyrone ring, as seen in other coumarin derivatives [23,24].In the crystal structure, the planar chromene ring system (r.m.s deviation = 0.009 Å) resulting from the two coupled rings (benzene and 3,6-dihydro-2H-pyran) and the benzoate-benzene rings are oriented at a dihedral angle of 54.04(14)°. Furthermore, an S(5) ring motif [25] arise from intramolecular C12—H12…O3 hydrogen bonds (Table 1), and generate a pseudo bicyclic ring system (Figure 6). This pseudo bicyclic moiety is planar (r.m.s deviation = 0.017 Å) and makes an acute angle of 54.97(13)° with respect to the chromene ring system.
3.2.2. Supramolecular Features
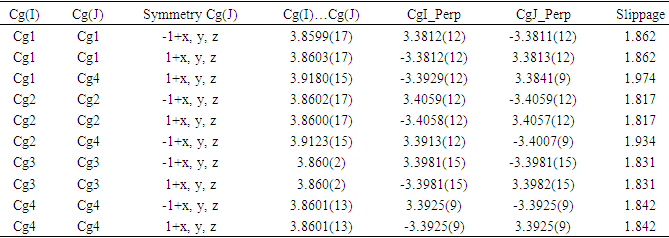
- In the three-dimensional crystal packing, molecules are bound by intermolecular C8—H8…O4 hydrogen bonds that extended as infinite 1D chain along [001] (Figure 7). Further, close contacts [O2…H3(1+x, y, 1+z) = 2.65 Å], [O4…H8(x, y, 1+z) = 2.54 Å] are found at a distance shorter than the sum of the van der Waals radii and C1=O2…Cg1(1+x, y, z) interactions are present (table 2), where Cg1 is the centroid of the pyrone ring. The resulting supramolecular aggregation is completed by the presence of π–π stacking interactions between centroids of adjacent molecules (Table 3 and Figure 8).
|
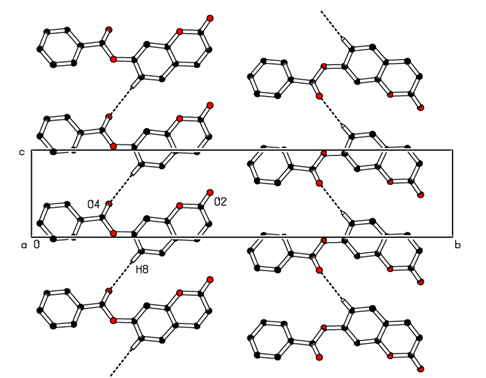 | Figure 7. Part of the crystal packing of the title compound showing the infinite 1D chain along [001]. Dashed lines indicate hydrogen bonds. H atoms not involved in hydrogen bonding have been omitted for clarity |
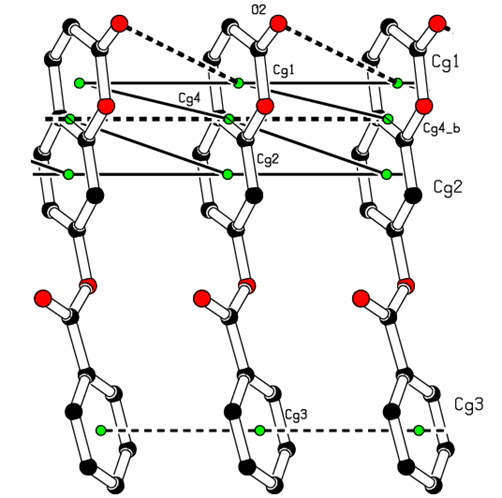 | Figure 8. A view of the crystal packing C=O…π and π–π stacking interactions (dashed lines). The yellow dots are ring centroids |
3.3. Hirshfeld Surface Analysis
- To provide an overall view of interactions between the molecules, a Hirshfeld surface analysis of compound (I) was performed with CrystalExplorer 3.1. The Hirshfeld surface was calculated using a standard (high) surface resolution with the three-dimensional (3D) dnorm surface plotted over a fixed colour scale of -0,149 (red) to 1,279 a.u. (blue). In (I), the surface mapped over dnorm highlights two brite red spots (negative dnorm values), reflecting distances shorter than the sum of the van der Waals radii. These dominant interactions correspond to intermolecular C—H…O hydrogen bonds. Besides, the shape-index map plotted over -1.00 to 1.00 a.u. highlights concave regions (adjacent red and blue triangle-like patches) that indicate C=O…π and π–π stacking interactions [26]. The mapping also shows white spots, with distances equal to the sum of the van der Waals radii, and blue regions with distances longer than the sum of the van der Waals radii. Transparent surfaces are displayed in order to visualize the molecule (Figures 9a and 9b).
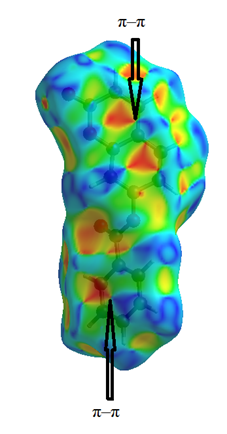 | Figure 9a. Shape-index map plotted over -1.00 to 1.00 a.u |
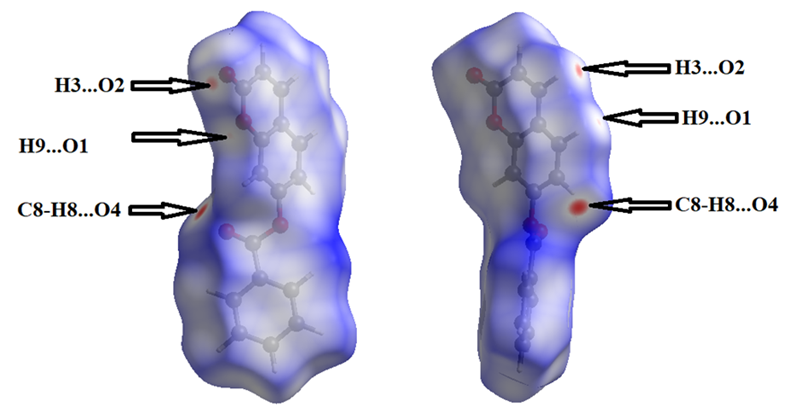 | Figure 9b. Hirshfeld surfaces mapped over dnorm (-0.149 to 1.279 a.u.) |
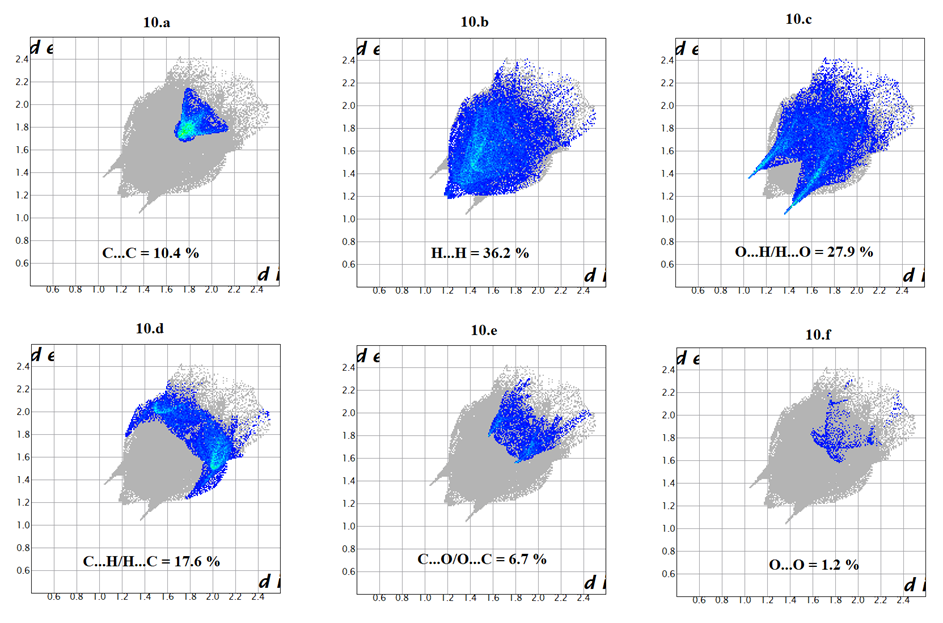 | Figure 10. Decomposed two-dimensional fingerprint plots for the title compound. Various close contacts and their relative contributions are indicated |
3.4. Theoretical Calculations
3.4.1. Comparison of Geometrical Parameters and Vibrational Frequencies
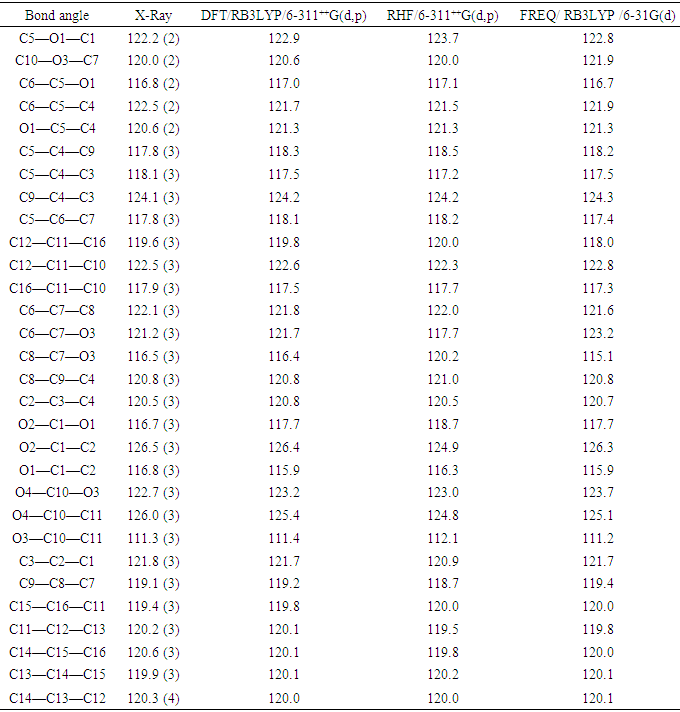
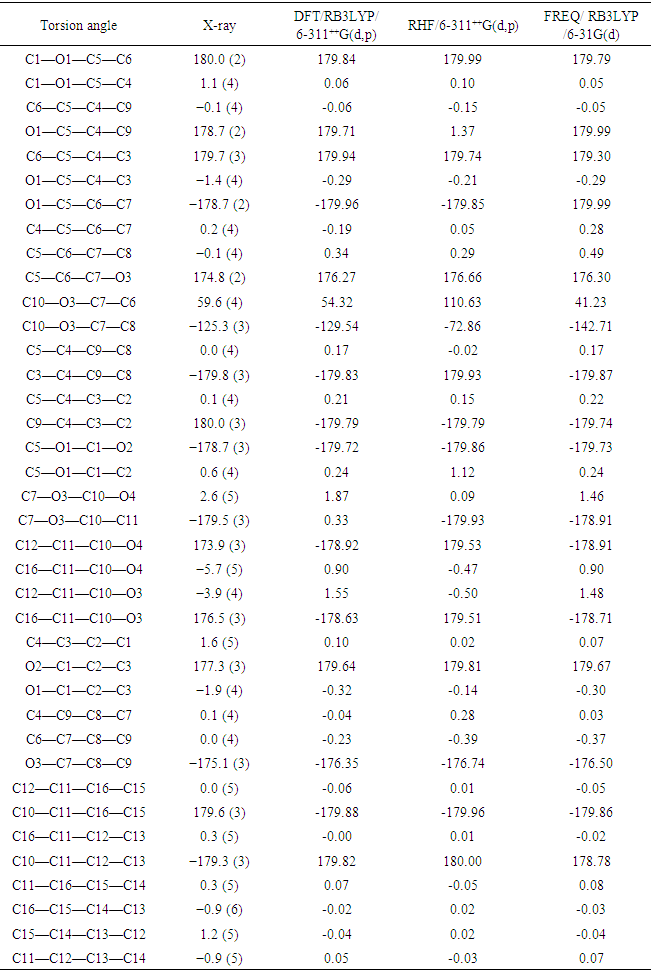
- The resulting geometrical parameters are compared with those obtained from the X-ray crystallographic study. An analysis of the computational bond lengths and bond angle and comparison with the crystallographic results shows a good agreement between them, with a root-mean-square deviation of 0.012 Å (DFT/RB3LYP), 0.015 Å (HF) and 0.014 Å (FREQ/RB3LYP) for bond lengths and 0.4° (DFT/RB3LYP), 1.2° (RHF) and 0.8° (FREQ/RB3LYP) for bond angles (Tables 5 and 6). These results show that the best agreement comes from the DFT methods. Furthermore, the calculated torsion angles’ inspection reveals the flatness of the coumarin ring system which is in good agreement with the crystallographic foresight, although the observed C10—O3—C7—C6 torsion angle between this ring system and the benzoate ring (59.6 (4)°) is somewhat larger than the DFT/RB3LYP calculated value (54.32°) and the frequency calculations values (41.23°) and lower than the RHF computed value (110.63°) (Table 7).
|
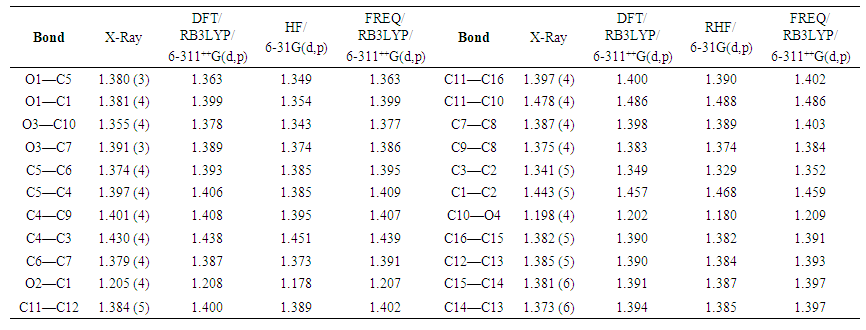 | Table 5. Experimental and calculated bond lengths (Å) |
|
|
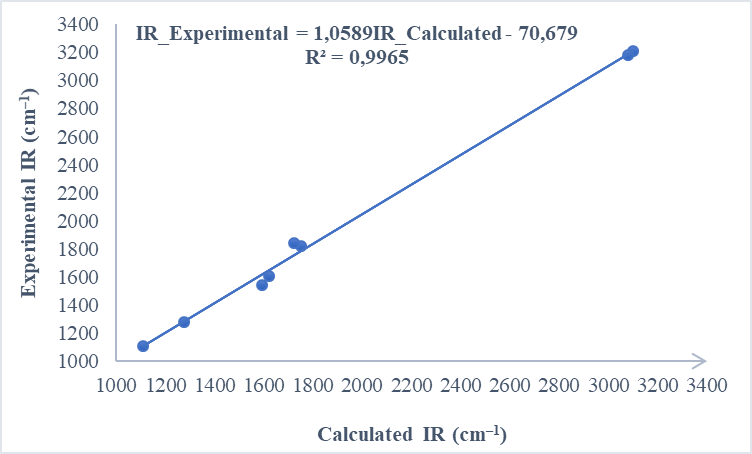 | Figure 11. Correlation graphic between the experimental and theoretical vibration frequencies of compound (I) (cm–1) |
|
3.4.2. Molecular Electrostatic Potential (MEP)
- The molecular electrostatic potential is an applicable property to explore the reactivity of various compounds and/or species. In fact, MEP is a physically observable property that can be measured experimentally by diffraction approaches [28,29]. Moreover, it can also be explored by computational means and therefore used to illustrate the wide-ranging electronic and nuclear charge distribution which is an appropriate feature for understanding the reactivity of various species [30].For convenience, the potential, V(r), is typically written in terms of atomic units, a.u.; it then has the following form [31]:
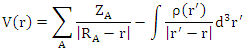 | (1) |
 | Figure 12. Calculated vibrational spectra of compound (I) |
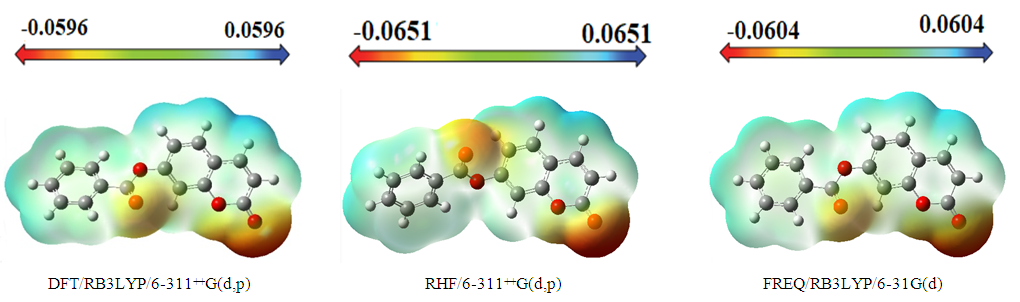 | Figure 13. Molecular electrostatic potential map (MEP) (in a.u.) calculated at DFT/RB3LYP/6-311++G(d,p), RHF/6-311++G(d,p) and FREQ/RB3LYP/6-31G(d,p) level frontier molecular orbitals analysis |
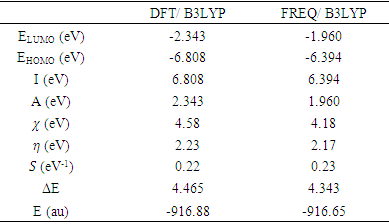
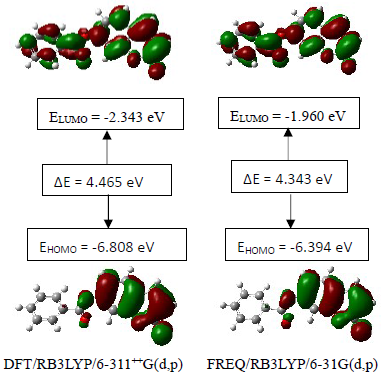
3.4.3. HOMO-LUMO Analysis
- The distributions and energy levels of the highest occupied molecular orbital (HOMO) and the lowest lying unoccupied molecular orbital (LUMO) calculated at the DFT/RB3LYP/6-311++G(d,p) and FREQ/RB3LYP/6-31G(d,p) level for the title compound are shown in Figure 14. The calculations indicate that the title compound has 69 occupied molecular orbitals and the value of the energy separation between the LUMO and HOMO are 4.465 and 4.434 eV for at the two levels, respectively. These frontier orbital gaps in the range 4.434-4.465 eV show that 2-oxo-2H-chromen-7-yl benzoate is polarizable and is associated with a high chemical reactivity and low kinetic stability and is also termed as soft molecule [32]. The HOMO and LUMO energies, the energy gap (Δ𝐸), the ionization potential (𝐼), the electron affinity (𝐴), the absolute electronegativity (𝜒), the absolute hardness (𝜂), softness (𝑆) and the optimization energy (E) for compound (I) have been computed and the results are given in Table 9. By using HOMO and LUMO energy values for a molecule, electronegativity and chemical hardness can be calculated as follows [33]:
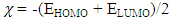 | (2) |
 | (3) |
 | (4) |
 | (5) |
 | (6) |
|
 | Figure 14. The distributions and energy levels of the HOMO and LUMO orbitals computed for compound (I) |
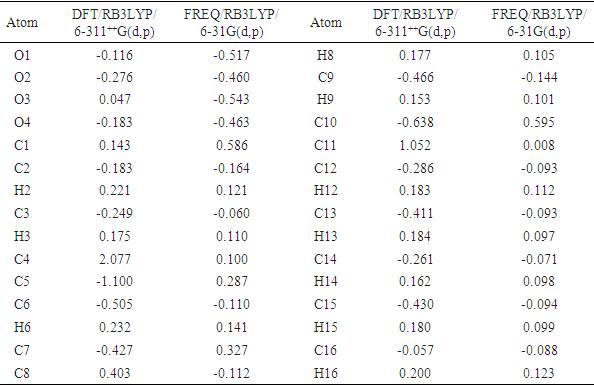
3.4.4. The Mulliken Charge Population
- The Mulliken atomic charge calculation has an important role in the application of quantum chemical calculation to molecular system because of atomic charges effect dipole moment, molecular polarizability, electronic structure, and a lot of properties of molecular systems. The charge distributions calculated by the Mulliken method [34-37] for the equilibrium geometry of the title compound is given in table 10. The computed Mulliken charges of (C8;H8) and (C12;H12;O3) atoms are determined as (0.404 e; 0.177 e) and (-0.286e;0.183e;0.047e) for the DFT/RB3LYP/6-311++G(d,p) and (-0.112e;0.105e) and (-0.093e;0.112e;-0.543e) for the FREQ/RB3LYP/6-31G(d) method. These values show that only FREQ/RB3LYP/6-31G(d) method confirms the intermolecular hydrogen bond C8–H8…O4[x,y,-1+z] and the intramolecular hydrogen bond C12–H12…O3. Likewise, the calculated Mulliken charges of (C2;H2), (C3;H3), (C6;H6), (C9;H9), (C13;H13), (C14;H14), (C15;H15) and (C16;H16) atoms (Table 10) may suggest other intermolecular contacts in the gaseous state.
|
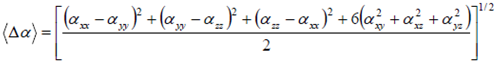
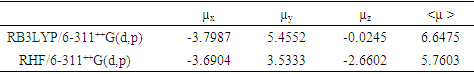
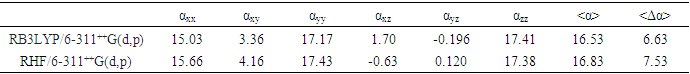
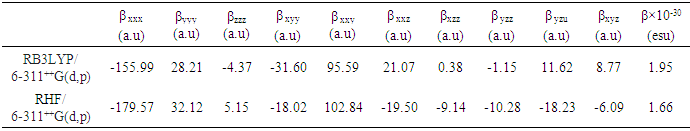
3.4.5. Non-Linear Optical Properties
- Nonlinear optical (NLO) effects arise from the interactions of electromagnetic fields in various media to produce new fields altered in phase, frequency, amplitude, or other propagation characteristics from the incident fields [38]. In the recent years, because of potential applications in modern communication technology, data storage, telecommunication, and optical signal procesing, a large number of research papers in new materials exhibiting efficient nonlinear optical (NLO) properties have been of great interest [39-43]. So, the use of quantum chemical methods as Hartree-Fock (HF) and density functional theory (DFT) for molecular hyperpolarizabilities is currently expected to supply a guidance and accelarate subsequent experimental studies [44,45].Thus, in the present work, the dipole moments (μ), the polarizabilities (<α>), the anisotropy of the polarizabilities (<Δα>) and the first-order hyperpolarizabilities (β) which gives information about the material capability to generate second order non-linear effects [46] was computed at RHF and DFT/RB3LYP optimized geometries using the 6-311++G(d,p) basis set with GAUSSIAN-09W program package [19]. These parameters are defined as [47-48]
 | (7) |
 | (8) |
 | (9) |
 | (10) |
|
|
|
4. Conclusions
- In this present investigation, molecular structure was analyzed by Spectrometry, X-ray cristallography, and the intermolecular interactions by Hirshfeld surface analysis.Then the computed geometric parameters (bond length, bond angle, torsion angle and infrared spectrum) with the DFT/RB3LYP/6-311++G(d,p), RHF/6-311++G(d,p) and FREQ/RB3LYP/6-31G(d) methods are compared with their experimental data. It is seen that there are no significant differences, when the experimental structure is compared with theoretical structures except the experimental torsion angle, C10—O3—C7—C6, which differs from those of the calculated values. Also, molecular electrostatic potential, HOMO-LUMO analysis and the Mulliken charge populations of 2-oxo-2H-chromen-7-yl benzoate have been investigated using DFT/RB3LYP/6-311++G(d,p) and FREQ/RB3LYP/6-31G(d) calculations. The resulted MEP maps show that the negative potential sites are on electronegative atoms and the positive potential sites are around the hydrogen atoms. These sites provide information concerning the region from where the compound can undergo intra- and intermolecular interactions. Likewise, Mulliken charges in the gaseous state are intended to validate or invalidate the intermolecular and intramolecular hydrogen bonds observed in the solid state. Hence, in this theoretical study, only FREQ/RB3LYP/6-31G(d) method have confirmed the intermolecular hydrogen bond C8–H8…O4[x,y,-1+z] and the intramolecular hydrogen bond C12–H12…O3.Finally, the computed values of the first-order hyperpolarizabilities (β) with DFT/B3LYP and HF methods have suggested non-linear optical properties of the studied compound.
ACKNOWLEDGEMENTS
- The authors are thankful to the Spectropole Service of the Federation of Chemical Sciences (Aix-Marseille University, France) for the whole analysis.
References
| [1] | Yu, D., Suzuki, M., Xie, L., Morris-Natschke, S. L. & Lee, K.-H.; (2003) Med. Res. Rev. 23, 322–345. |
| [2] | Yu, D., Morris-Natschke, S. L. & Lee, K.-H.; (2007) Med. Res. Rev. 27, 108–132. |
| [3] | Abernethy, J. L.; (1969). J. Chem. Educ. 46, 561–568. |
| [4] | Vukovic, N., Sukdolak, S., Solujic, S. & Niciforovic, N.; (2010) Arch. Pharm. Res. 33, 5–15. |
| [5] | Wang, M.,Wang, L., Li, Y. & Li, Q.; (2001) Transition Met. Chem. 26, 307–310. |
| [6] | Basanagouda M., Kulkarni M. V., Sharma D., Gupta V. K., Pranesha P., Sandhyarani P. and Rasal V. P.; (2009) J. Chem. Sci., 121, 485–495. |
| [7] | Emmanuel-Giota A. A., Fylaktakidou K. C., Litinas K. E., Nicolaides D. N. and Hadjipavlou-Litina D. J.; (2001) Heterocycl. Chem., 38, 717–722. |
| [8] | O’Kennedy, R. & Thornes, R. D. (1997). Coumarins: Biology, Applications and Mode of Action. Wiley & Sons, Chichester. |
| [9] | Lakshmi, G. S. P. B., Murthy, Y. L. N., Anjaneyulu, A. S. R. & Santhamma, C.; (1995) Dyes and Pigments 29, pp. 211–225. |
| [10] | Abou A., Djandé A., Kakou-Yao R., Saba A. and Tenon A. J.; (2013) Acta Cryst., E69, o1081–o1082. |
| [11] | Ouédraogo M., Abou A., Djandé A., Ouari O. and Zoueu T. J.; (2018) Acta Cryst., E74, 530–534. |
| [12] | Rigaku OD.; (2015) CrysAlis PRO. Rigaku Oxford Diffraction, Yarnton, England. |
| [13] | Burla M. C., Caliandro R., Carrozzini B., Cascarano G. L., Cuocci C., Giacovazzo C., Mallamo M., Mazzone A. and Polidori G., J.; (2015) Appl. Cryst., 48, 306–309. |
| [14] | Farrugia L. J.; (2012) J. Appl. Cryst., 45, 849–854. |
| [15] | Sheldrick G. M.; (2015) Acta Cryst., C71, 3–8. |
| [16] | Spek A. L.; (2009) Acta Cryst., D65, 148–155. |
| [17] | Parsons S., Flack H.D. and Wagner T.; (2013) Acta Cryst., B69, 249-259. |
| [18] | Wolff S. K., Grimwood D. J., McKinnon J. J., Turner M. J., Jayatilaka D. and Spackman M. A.; (2012) Crystal Explorer. The University of Western Australia. |
| [19] | Frisch M. J., Trucks G. W., Schlegel H. B., Scuseria G. E., Robb M. A., Cheeseman J. R., et al.; (2013) GAUSSIAN09. Gaussian, Inc., Wallingford, CT, USA. |
| [20] | Allen F. H., Walson D. G., Orpen A. G., Taylor R.; (1987) J. Chem. Soc., Perkin Trans. II, S1-S9. |
| [21] | Abou A., Yoda J., Djandé A., Coussan S. and Zoueu T. J.; (2018) Acta Cryst.; E74: 761–765. |
| [22] | Djandé A., Abou A., Kini F., Kambo K. R. and Giorgi M.; (2018) IUCrData, 3, x180927. |
| [23] | Gomes L. R., Low J. N., Fonseca A., Matos M. J. and Borges F.; (2016) Acta Cryst., E72, 926–932. |
| [24] | Ziki E., Yoda J., Djandé A., Saba A. and Kakou-Yao R.; (2016) Acta Cryst., E72, 1562–1564. |
| [25] | Bernstein J., Davis R. E., Shimoni L. and Chang N-L.; (1995) Angew. Chem. Int. Ed. Engl., 34, 1555–1573. |
| [26] | Bitzer S. R., Visentin C. L., Hörner M., Nascimento M. A. C. and Filgueiras C. A. L.; (2017) J. Mol. Struct., 1130, 165–173. |
| [27] | Hanwell M. D., Curtis D. E., Lonie D. C., Vandermeersch T., Zurek E., and Hutchison G. R.; (2012) Journal of Cheminformatics, 4(1), 17. |
| [28] | Politzer, P. & Truhlar, D. G. (1981). Editors. Chemical Applications of Atomic and Molecular Electrostatic Potentials. New York: Plenum Press. |
| [29] | Stewart, R. F. (1979) Chem. Phys. Lett. 65, 335–342. |
| [30] | Murray, J. S. & Politzer, P. (2011) WIREs Comput. Mol. Sci. 1, 153–163. |
| [31] | Politzer P. and J. S. Murray J. S.; (2002) Theoretical Chemistry Accounts, 108(3), 134–142. |
| [32] | Fleming I.; (1976) Frontier Orbitals and Organic Chemical Reactions, John Wiley & Sons, London, UK. |
| [33] | Pearson R. G.; (1986) Proceedings of the National Academy of Sciences of the United States of America, 83(22), 8440–8841. |
| [34] | Mulliken R. S.; (1955) The Journal of Chemical Physics, 23(10), 1833–1840. |
| [35] | Mulliken R. S.; (1955) The Journal of Chemical Physics, 23(10), 1841–1846. |
| [36] | Mulliken R. S.; (1955) The Journal of Chemical Physics, 23(12), 2338–2342. |
| [37] | Mulliken R. S.; (1955 The Journal of Chemical Physics, 23(12), 2343–2346. |
| [38] | Y.-X. Sun, Q.-L. Hao, W.-X.Wei et al., (2009) Journal of Molecular Structure: THEOCHEM, vol. 904, no.1–3, pp. 74–82. |
| [39] | R. Zhang, B. Du, G. Sun, and Y. Sun; (2010) Spectrochimica Acta A, vol. 75, no. 3, pp. 1115–1124. |
| [40] | S. Yazıcı, Ҫ. Albayrak, I. Gümrükçüoǧlu, I. Șenel, and O. Büyükgüngör; (2011) Journal of Molecular Structure, vol. 985, no. 2-3, pp. 292–298. |
| [41] | D. S. Chemia and J. Zyss, Non LinearOptical Properties of Organic Molecules and Crystal, Academic Press, New York, NY, USA, 1987. |
| [42] | J. Zyss, Molecular Non Linear Optics, Academic Press, Boston, Mass, USA, 1994. |
| [43] | A. Ben Ahmed, H. Feki, Y. Abid, and C. Minot; (2010) Spectrochimica Acta A, vol. 75, no. 4, pp. 1315–1320. |
| [44] | Suponitsky, K.Y., Tafur, S, Masunov A.E.; (2008) Journal of Chemical Physics, 129, 044109-11. |
| [45] | Avci, D., Başoğlu A., Atalay, Y.; (2011) International Journal of Quantum Chemistry, 111, 1, 130-147. |
| [46] | Machado, A.E.H., Neto, N.M.B., Ueno, L.T., et al.; (2008) Journal of Photochemistry Photobiology A-Chemistry, 199, 1, 23–33. |
| [47] | Abraham, J.P., Sajan, D., Hubert, Joe I.H. and Jayakumar, V.S.; (2008) Spectrochimica Acta Part A, 71, 2, 355-367. |
| [48] | Karamanis, P, Pouchan, C. and Maroulis, G.; (2008) Physical Review A, 77, 013201-013208. |
| [49] | Ben Ahmed, A., Feki, H., Abid, Y., Boughzala, H. and Mlayah, A.; (2008) Journal of Molecular Structure, 888, 1-3, 180-186. |
| [50] | Nkungli, N.K.; Ghogomu, J.N.; (2016) J. Theor. Chem., 2016, 1–19. |
| [51] | Pluta, T.; Sadlej, A.J.; (2001) J. Chem. Phys., 114, 136. |
| [52] | Song, X.; Farwell, S.O.; (2004) J. Anal. Appl. Pyrolysis, 71, 901–915. |
| [53] | Eșme , A., Güneșdoǧdu Saǧdinç, S.; (2014) BAÜ Fen Bil. Enst. Dergisi Cilt 16(1) 47-75. |