-
Paper Information
- Paper Submission
-
Journal Information
- About This Journal
- Editorial Board
- Current Issue
- Archive
- Author Guidelines
- Contact Us
American Journal of Mathematics and Statistics
p-ISSN: 2162-948X e-ISSN: 2162-8475
2026; 15(2): 21-30
doi:10.5923/j.ajms.20261502.01
Received: May 6, 2026; Accepted: May 28, 2026; Published: Jun. 4, 2026

Exploratory Spatial Risk Modeling of Chlamydia Vulnerability at the ZCTA Level Using Spatial Filtering and Sentinel-2 Data
 Abstract
 Reference
 Full-Text PDF
 Full-text HTML
Nicole I. Rodriguez1, Aarya Satardekar1, Namit Choudhari2, Spuritha Bhandaru1, Anusha Parajuli1, Rishil Shah3, Benjamin G. Jacob1
1Samuel P. Bell III College of Public Health, University of South Florida, Tampa, Florida, United States of America
2School of Geosciences, College of Arts & Sciences, University of South Florida, Tampa, Florida, United States of America
3Department of Computer Science and Engineering, Bellini College of Artificial Intelligence, Cybersecurity and Computing, University of South Florida, Tampa, Florida, United States of America
Correspondence to: Aarya Satardekar, Samuel P. Bell III College of Public Health, University of South Florida, Tampa, Florida, United States of America.
| Email: |  |
Copyright © 2026 The Author(s). Published by Scientific & Academic Publishing.
This work is licensed under the Creative Commons Attribution International License (CC BY).
http://creativecommons.org/licenses/by/4.0/

Chlamydia remains one of the most prevalent sexually transmitted infections in the United States, with substantial geographic and demographic disparities at fine spatial scales. Traditional surveillance methods often lack the environmental and contextual resolution needed to identify fine-scale spatial clustering patterns in disease burden. Emerging integration of satellite remote sensing and machine-learning approaches offers new opportunities for high-resolution spatial risk mapping. This study aimed to develop a ZCTA-level spatial modeling framework that integrates Sentinel-2 multispectral satellite data with machine-learning algorithms to identify and map exploratory spatial clustering patterns in estimated chlamydia vulnerability, while stratifying risk by socioeconomic, sociodemographic, and racial characteristics. Due to the absence of ZCTA-level chlamydia case data, incidence was approximated using proportional allocation based on population distributions, and subsequently linked with Sentinel-2 satellite spectral bands. Socioeconomic, sociodemographic, and racial covariates were incorporated from census-derived data sources. Three supervised machine-learning algorithms - Random Forest, Support Vector Machine, and Extreme Gradient Boosting (XGBoost) were evaluated to explore spatial patterns in estimated chlamydia vulnerability proxies across ZCTAs. The analyses revealed pronounced disparities, with persistent high-risk clusters concentrated in socioeconomically disadvantaged and racially marginalized ZCTAs. Integrating Sentinel-2 satellite-derived environmental covariates with machine-learning models may support exploratory fine-scale mapping of estimated chlamydia vulnerability patterns. This approach supports targeted surveillance and intervention strategies and provides a scalable framework for studying chlamydia in relation to environmental and social determinants of health.
Keywords: Chlamydia, Sentinel-2, Machine Learning, Poisson, XGBoost, Random Forest, Spatial Hotspot Analysis, Health Disparities
Cite this paper: Nicole I. Rodriguez, Aarya Satardekar, Namit Choudhari, Spuritha Bhandaru, Anusha Parajuli, Rishil Shah, Benjamin G. Jacob, Exploratory Spatial Risk Modeling of Chlamydia Vulnerability at the ZCTA Level Using Spatial Filtering and Sentinel-2 Data, American Journal of Mathematics and Statistics, Vol. 15 No. 2, 2026, pp. 21-30. doi: 10.5923/j.ajms.20261502.01.
Article Outline
1. Introduction
- Chlamydia infection remains one of the most reported bacterial sexually transmitted infections worldwide, with persistent public health significance due to its often-asymptomatic presentation, potential for long-term reproductive morbidity, and uneven geographic distribution across socio-demographic groups ([1,2]). Despite ongoing surveillance efforts, substantial challenges remain in accurately characterizing its spatial epidemiology at fine geographic scales. Reporting systems for chlamydia infection are frequently affected by underdiagnosis, incomplete case capture, and spatial heterogeneity in testing access, which collectively obscure localized spatial heterogeneity in estimated risk and hinder targeted intervention strategies. ([3]).Recent advances in geospatial epidemiology and data science offer new opportunities to address these current chlamydia infection mapping limitations by integrating heterogeneous data sources within unified analytical frameworks. In particular, the convergence of routinely collected epidemiological surveillance data with high-resolution Earth observation imagery enables the characterization of environmental and built-environment correlates of infectious disease risk at unprecedented spatial granularity. Satellite platforms such as Sentinel-2 provide multispectral imagery that can be transformed into informative covariates capturing land use and land cover patterns, urbanicity gradients, and surface reflectance properties, all of which may serve as proxies for underlying socio-environmental determinants of health (ESA Sentinel-2 documentation).In this study, we propose a spatially explicit statistical and machine learning framework to estimate zip-code–level prevalence of chlamydia infection by integrating epidemiological surveillance records with Sentinel-2–derived covariates. Our modeling strategy combines hierarchical spatial models—incorporating conditional autoregressive (CAR) structures and spatial lag/error specifications—with modern machine learning approaches, including Random Forests, Gradient Boosting Machines, and deep neural networks. We designed this hybrid framework to capture both structured spatial dependence and complex nonlinear relationships between environmental, demographic, and public health predictors and estimated chlamydia risk proxies. By leveraging complementary strengths of probabilistic spatial modeling and data-driven machine learning, the proposed approach aims to improve predictive accuracy, quantify spatial uncertainty, and enhance inference in regions with incomplete or sparse reporting of potential chlamydia infection. Ultimately, this framework may support more precise chlamydia infection risk mapping while providing a scalable methodology for integrating remote sensing and epidemiological data to inform targeted public health interventions at fine geographic resolution.Analyses conducted at broader geographic scales, such as counties or cities, can obscure meaningful heterogeneity in chlamydia incidence that exists at the neighborhood level, where localized social and structural determinants of health play a critical role in shaping infection risk ([4,5]). A growing body of research demonstrates that sexually transmitted infections (STIs), including chlamydia, are strongly influenced by neighborhood-level factors such as concentrated poverty, residential instability, access to healthcare, and social network dynamics, which are often masked when data are aggregated to larger administrative units ([6]). As a result, reliance on coarse spatial scales may lead to under-identification of high-risk micro-areas and limit the effectiveness of targeted public health interventions. ZCTA Tabulation Area [ZCTA]-level hot spot analysis can help reveal micro-patterns—areas where infection rates are significantly higher (hot spots) and areas where they are lower than expected (cold spots). Small-area analyses, including those conducted at the ZCTA level, may better capture localized spatial risk patterns and identify clusters of elevated risk that would otherwise remain undetected ([7]) Hot and cold spot modelling at the ZCTA Tabulation Area (ZCTA) level may be especially important for chlamydia infection prevention programs, as it may turn broad surveillance data into actionable, location-specific insight. Hot spot modelling may help direct those resources to the exact ZIP-level areas where they will have the greatest impact, rather than spreading them evenly and inefficiently across low-risk areas. ZCTA-level hot spot mapping may help identify where routine screening should be intensified (e.g., schools, community clinics, sexual health services). This is especially important because chlamydia is often asymptomatic, so cases cluster silently unless actively tested for. Public health messaging (awareness campaigns, condom distribution, education efforts) can be localized to communities most affected, making interventions more culturally and geographically relevant. ([8,9]) By tracking hot and cold spots over time, programs can evaluate whether interventions are working—e.g., whether a hot spot shrinks after increased testing or outreach. ZCTAs provide a finer spatial resolution than counties or states, which helps avoid “averaging out” high-risk pockets. However, they are still large enough to protect privacy and maintain statistical stability compared to exact street-level mapping. ZCTA-level hot and cold spot modelling turns chlamydia surveillance from a broad overview into a precision public health tool that may help programs find hidden clusters, respond faster, and use limited resources more effectively.Machine learning models may provide a flexible framework for spatial interpolation of satellite-derived environmental signatures beyond the original capture scale of ZCTAs to broader units such as counties, while preserving fine-grained heterogeneity relevant to broader spatial patterns of chlamydia vulnerability. For example, multispectral features extracted from Sentinel-2 10-m spatial resolution imagery at the ZCTA level can be combined with sampled online sociodemographic, socioeconomic, and racial composition data (e.g., population density, income, healthcare access, and racial/ethnic distribution) to train supervised learning models such as Random Forests, Gradient Boosting Machines, or deep neural networks. These models would then learn complex, nonlinear relationships between environmental signatures and underlying social determinants of health, enabling exploratory estimation of spatial chlamydia vulnerability surfaces in unsampled or sparsely reported areas. By incorporating spatial features and hierarchical structure, predictions can be aggregated or interpolated from ZCTA to the county level while maintaining sensitivity to localized variation. The resulting continuous risk surfaces may then be used in conjunction with spatial statistical techniques (e.g., local indicators of spatial association) to identify exploratory spatial clusters of elevated and reduced estimated risk, thereby improving detection of hidden clusters and enhancing the targeting of public health interventions in populations disproportionately affected by chlamydia.An eigenfunction eigen-decomposition approach may detect chlamydia stratified hot and cold spot clusters at the ZCTA level by transforming the spatial structure of the data into a set of orthogonal (independent) spatial patterns that reveal hidden geographic organization in the infection rates. At a high level, the method would begin by defining a spatial relationship matrix between ZCTAs—typically based on adjacency (shared borders) or distance. From this, a spatial weights matrix may be constructed and centered to reflect how each ZCTA relates to its neighbors. Performing eigen-decomposition on this matrix would then yield a set of eigenfunctions (also called spatial basis functions), each representing a distinct map pattern of spatial variation—some capturing broad regional gradients, others capturing localized clustering.Subsequently, these eigenfunctions may be used as predictors in a regression or machine learning model of chlamydia rates at the ZCTA level. Because each eigenfunction corresponds to a specific spatial pattern ([10]), the model effectively would decompose the estimated spatial risk surface. Eigenfunctions associated with large positive coefficients highlight areas where neighboring ZCTAs tend to have similarly high values—would indicate potential hot spots—while those with large negative coefficients would reveal cold spots or areas of comparatively lower estimated vulnerability. Importantly, this approach aligns with the logic of spatial autocorrelation measures such as Moran's I, but extends it by identifying where in space clustering occurs rather than just whether it exists globally. Moran's I is a measure of spatial autocorrelation that quantifies the degree to which similar values of a variable (e.g., disease rates) cluster together in geographic space, with positive values indicating clustering of similar values and negative values indicating spatial dispersion ([11]). By reconstructing the predicted surface using selected eigenfunctions (often those associated with statistically significant spatial structure), researchers can generate smoothed ZCTA, Moran’s I predictive risk maps that emphasize clustered regions while filtering out noise from underreporting or sparse data.When stratified by race, sociodemographic or socioeconomic variables (e.g., income, healthcare access), the model can be extended to include interactions between eigenfunctions and their covariates. This would allow the identification of stratified clusters—for example, stratified chlamydia elevated estimated-risk clusters specifically associated with high-poverty or underserved populations—thereby revealing how structural factors shape localized spatial heterogeneity in estimated risk.In practice, eigenfunction-based spatial filtering chlamydia estimator determinants may be particularly powerful at the ZCTA level, as they would capture both structured spatial dependence and complex nonlinear relationships between environmental, demographic, and public health predictors and estimated chlamydia risk proxies. Relying on strict parametric assumptions about the spatial process can be problematic when using Moran's I for ZCTA-level hot- and cold-spot mapping of chlamydia estimated vulnerability patterns, as real-world transmission patterns rarely follow simple, uniform, or stationary distributions. Parametric spatial models often assume properties such as normality, constant variance, and a single, smoothly varying spatial dependence structure across the entire study area ([12]).Unfortunately, chlamydia risk is shaped by highly heterogeneous and localized factors—such as differences in testing access, healthcare infrastructure, sexual network structure, and socioeconomic conditions—that vary sharply between neighboring ZCTAs. This heterogeneity creates sharp discontinuities in estimated risk that are not well approximated by smooth global trends. As a result, adjacent ZCTAs may exhibit markedly different reported rates due to localized clustering of risk behaviors, differential screening intensity, or access to sexual health services rather than true spatial continuity of estimated chlamydia vulnerability. In addition, sexual network structures are often geographically constrained but socially complex, meaning that chlamydia spatial connectivity patterns may extend across administrative boundaries while remaining invisible within aggregated surveillance data. These factors together can produce spatial patterns characterized by both clustering and abrupt variation, reinforcing the need for flexible modeling approaches that may accommodate non-stationarity and local dependence. These violations can lead to biased or oversmoothed estimates, masking true micro-clusters or falsely diluting high-risk pockets.In contrast, Moran’s I itself is a relatively assumption-light, exploratory measure that detects spatial clustering without requiring a fully specified parametric model. When strict assumptions are imposed (e.g., through global spatial regression frameworks), they may fail to capture non-stationarity (where relationships differ across space) and nonlinear dynamics inherent in transmission. This is especially important for chlamydia, where asymptomatic spread and uneven screening create patchy, underreported patterns. As a result, more flexible approaches—such as local indicators of spatial association (LISA), eigenvector-based methods, or machine learning—may be preferred alongside Moran’s I to better identify exploratory ZCTA-level spatial clustering patterns without forcing unrealistic spatial structure onto the data. Hence, the result would be a nuanced identification of hot and cold spots that reflects both geographic proximity and underlying social determinants of chlamydia infection. In this research, we evaluate the presence and magnitude of spatial autocorrelation in ZCTA-level infection rates using global and local spatial statistics and identify exploratory hot and cold spot patterns indicative of localized spatial heterogeneity in estimated vulnerability in Hillsborough County, Florida. Chlamydia remains one of the most commonly reported sexually transmitted infections in Hillsborough County, reflecting both high reported incidence rates and ongoing public health challenges in STI prevention and control. Surveillance data indicate that Hillsborough County consistently experiences chlamydia incidence rates above both state and national averages, placing it among the higher-burden counties in Florida ([13]). For example, recent estimates report incidence rates exceeding 600 cases per 100,000 population, highlighting the continued need for targeted intervention strategies in the region ([14]). In response, the Florida Department of Health in Hillsborough County has implemented a range of prevention, screening, and treatment services aimed at reducing transmission and improving early detection. These include low-cost and confidential STI testing services for chlamydia, as well as disease intervention programs that actively conduct surveillance, partner notification, and linkage to care for individuals diagnosed with infection ([15]). The county also supports community-based outreach initiatives and partnerships designed to increase awareness, expand testing access, and reduce barriers to care, particularly among high-risk and underserved populations. Collectively, these efforts reflect a comprehensive public health approach that combines surveillance, clinical services, and prevention programming to address the persistent burden of chlamydia in Hillsborough County and reduce long-term reproductive health complications associated with untreated infection. Unfortunately, currently, chlamydia cases in Hillsborough County, Florida, have still shown a sustained increase, reflecting persistent disease burden. We constructed a harmonized dataset linking chlamydia surveillance data with ZCTA-level sociodemographic, socioeconomic, and racial composition variables sampled in Hillsborough County, along with environmental covariates derived from Sentinel-2 imagery. We implemented a hybrid modeling framework combining spatial statistical methods (e.g., conditional autoregressive models and eigenvector-based approaches) with machine learning algorithms (e.g., Random Forests and Gradient Boosting Machines) to estimate and interpolate ZCTA-level infection risk. We generated high-resolution risk maps and evaluated how detected clusters were associated with underlying sociodemographic, socioeconomic, racial, and environmental determinants. Optimally, we wanted to attain actionable, location-specific chlamydia risk-related spatial risk insights to inform targeted screening, outreach, and prevention strategies, improving the allocation of limited public health resources.The overall objective of this study was to develop a spatially explicit, data-integrated modeling framework to estimate and map ZCTA-level prevalence of chlamydia infection and identify localized spatial clustering patterns in estimated vulnerability in Hillsborough County. The central hypothesis was that integrating satellite-derived environmental features with sociodemographic and socioeconomic data within a hybrid spatial–machine learning framework would improve the detection of fine-scale clustering patterns. To achieve this objective, we proposed the following specific aims: Aim 1: Quantify spatial clustering of chlamydia at the ZCTA level. Aim 2: Develop an integrated geospatial dataset. Aim 3: Build and compare spatial and machine learning models. Aim 4: Identify and characterize micro-geographic hot and cold spots. Aim 5: Translate findings into public health action.We assumed that this project would advance precision public health by providing a scalable framework for integrating epidemiological surveillance, remote sensing, and machine learning to uncover hidden spatial clustering patterns in estimated chlamydia vulnerability. We also assumed that the potential to significantly enhance early detection of high-risk ZCTA areas would support exploratory geographically targeted public health planning in Hillsborough County.
2. Methods
2.1. Hillsborough County Study Site Description
- The study area encompasses Hillsborough County, Florida, United States, consisting of 55 ZCTA Tabulation Areas (ZCTAs), which served as the primary spatial unit of analysis. Hillsborough County is located in the west-central portion of the U.S. state of Florida, as part of the Tampa–St. Petersburg–Clearwater Metropolitan Statistical Area. According to the U.S. Census Bureau [17], the population in this county was 1,459,762, one of the most populous counties in the state. The estimated population in 2022 of Hillsborough County was 1,513,301 people, with a yearly growth rate of 3.7% ([16]). The state of Florida features a highly urbanized population concentrated along coastal corridors, including the Miami-Fort Lauderdale-West Palm Beach, Tampa-St. Petersburg-Clearwater, Orlando-Kissimmee-Sanford, and Jacksonville metropolitan statistical areas, interspersed with extensive rural and agricultural regions in the interior and panhandle ([17]). This urban-rural gradient provides a diverse landscape for assessing how environmental and socioeconomic factors relate to patterns of unsafe sexual activity. These characteristics collectively position Florida as an informative case study for developing and evaluating statewide geospatial models of Chlamydia infection activity.
2.2. Hillsborough Study Site Map
- We constructed ZCTA-level estimator determinant probabilities from population-stratified, sociodemographic, socioeconomic, and racial, non-time series, sampled chlamydia infection-related covariates, which were acquired from ([18]), for Hillsborough County. The vulnerability indices included chlamydia-related stratification for county-level mortality incidence of chlamydia. The number of cases for each ZCTA was calculated by cross-multiplying the total chlamydia- related activity cases for the county, the population of the county, and the population for each ZCTA. This had to be performed since the data for cases at a ZCTA level was unavailable. Therefore, all subsequent analyses should be interpreted as exploratory spatial modeling of estimated vulnerability patterns rather than analyses of directly observed ZCTA-level surveillance counts.Initially, we utilized a count variable Poisson model to evaluate covariates associated with the reported county-level incidence estimates in Hillsborough County. We employed census data and literature to create a population stratification for the entire county, which incorporated all 55 ZCTAs (Figure 1). The study utilized publicly available sociodemographic indicators and county-level chlamydia incidence estimates for Hillsborough County, which had a chlamydia incidence of 610 per 100,000 (2025). We created the conversion of potential chlamydia cases using the ratio 610/ 1.58 million. Thereafter, we quantified chlamydia cases at a ZCTA level using the following equation: 610 (ZCTA population) / 1.58 million. We used this information to run the model population stratification covariates with Poisson Regression to generate a parameter estimator hierarchy.
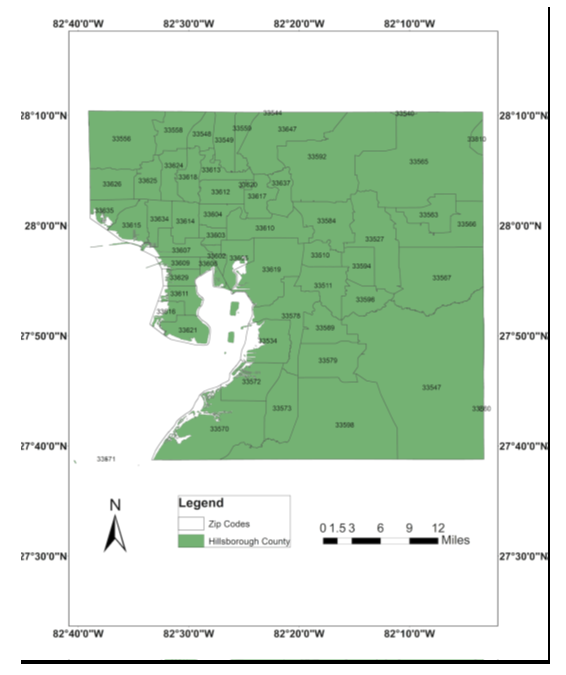 | Figure 1. Study Site Map of Hillsborough County, Florida |
2.3. Population Vulnerability Stratification
- We employed satellite-sensed, Sentinel 2, 10m, spatial resolution, visible and NIR, ZCTA-stratified, LULC, capture point, signature surveys of the potential, georeferenced, ZCTA-level, stratified, sampled chlamydia-related covariates. The combination of 10m spectral bands [Table 1] enables a wide range of uses, including the monitoring of vegetation, soil, and water cover, and observing inland waterways and urban and rural areas in Hillsborough County ([19]). The digital overlay revealed the capture point, LULC-classified surface area (m2) of each remote, sampled, georeferenced, sentinel site, stratified, racial, sociodemographic, and socioeconomic estimator determinants in Hillsborough County. Land cover types were classified into urban commercial, urban residential, rural, farmland, and greenways.
2.4. Study Design and Data Sources
- This ecological spatial analysis integrated Chlamydia surveillance data with sociodemographic indicators and satellite-derived environmental covariates to model infection risk at the ZCTA level. Estimated ZCTA-level counts were generated using proportional allocation from county-level incidence and linked with population denominators to derive exploratory incidence proxies. Sociodemographic and socioeconomic variables (e.g., income, racial composition, population density, and healthcare access proxies) are obtained from publicly available census-based datasets. Environmental covariates are derived from multispectral imagery from Sentinel-2.
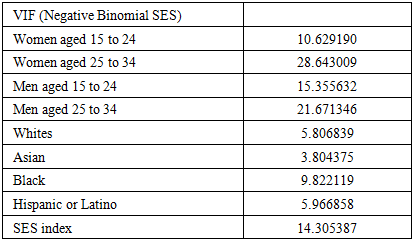
2.5. Poisson Regression for Disease Count Modelling
- Chlamydia case counts at the ZCTA level were modelled using a Poisson regression framework in R with an offset for population size:
 where
where  represented the estimated chlamydia case count in ZCTA
  was the population offset, and
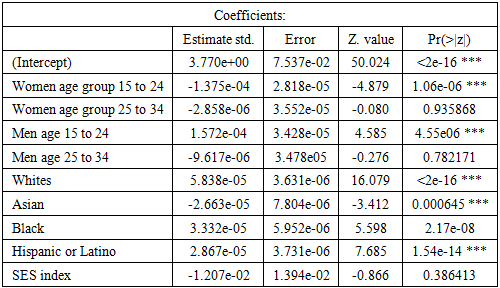
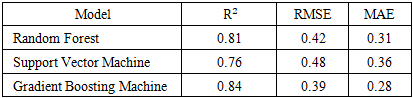
  included the sampled online, socioeconomic, racial, and sociodemographic predictor variables, machine learning–derived Sentinel-2 features, and spatial covariates. Overdispersion was assessed. Spatial dependence was further incorporated through random effects and spatial filtering terms derived from eigenfunctions.First, pixel-level spectral features were aggregated to ZCTA boundaries using spatial averaging and histogram-based descriptors (mean, variance, and texture metrics). Second, to enable inference at broader spatial scales (county-level), we apply machine–learning–based spectral upscaling models. Specifically, Random Forest regression, Support Vector Regression (SVR), and Gradient Boosting Machines (GBM) were trained as independent supervised learning models to capture nonlinear relationships between environmental features and estimated chlamydia vulnerability proxies. Model performance was evaluated using cross-validated R² and root mean squared error (RMSE), and the best-performing model was used to generate continuous county-level environmental surfaces from ZCTA inputs.
2.6. Eigenfunction Decomposition for Spatial Structure and Hot/Cold Spot Detection
- To explicitly model latent spatial dependence structures and identify localized clustering, we applied eigenfunction-based spatial filtering using a spatial weights matrix defined by ZCTA adjacency (queen contiguity) or distance decay in R. The centered spatial connectivity matrix was decomposed into orthogonal eigenvectors representing independent spatial patterns. Eigenfunctions serve as spatial basis functions capturing multiscale structure—from broad regional gradients to fine-scale local clustering ([10]). Significant eigenvectors were selected via Moran’s I screening, which were included in the Poisson regression model to remove residual spatial autocorrelation.Reconstructed spatial surfaces derived from selected eigenfunctions were subsequently used to explore localized spatial clustering patterns in estimated chlamydia vulnerability proxies across ZCTAs in Hillsborough County. Positive eigenfunction loadings correspond to clusters of elevated relative risk (hot spots), while negative loadings identify regions of suppressed incidence (cold spots) ([5]). This approach enabled decomposition of observed spatial variation into interpretable latent spatial dependence structures without imposing restrictive parametric assumptions ([20]).
2.7. Spatial Risk Mapping and Model Integration
- Predicted relative risks from the Poisson–eigenfunction model were combined with machine learning–derived environmental surfaces to produce high-resolution risk maps. These outputs were aggregated from ZCTA to the county level using population-weighted averaging, enabling comparison across spatial scales.To assess robustness, predictions were compared across modeling frameworks, including 1. Poisson regression with and without spatial eigenfunctions 2. Random Forest 3. Gradient Boosting Machines and 4 Support Vector Regression. Model performance was evaluated using spatial cross-validation to reduce bias from spatial autocorrelation.
2.8. Hot and Cold Spot Validation
- Cluster detection results were validated using local spatial statistics, including Moran's I and related local indicators of spatial association. Stability of detected clusters was assessed through bootstrap resampling and sensitivity analyses across different spatial weight definitions.
2.9. Software and Implementation
- All analyses were implemented using R. Spatial modelling was conducted using standard spatial econometrics and geospatial libraries, while machine learning models were implemented using ensemble learning frameworks. Geospatial processing of Sentinel-2 imagery was performed using cloud-based or high-performance computing environments in ArcGIS Pro to manage large raster datasets.
3. Results
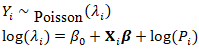
- A Poisson regression model output revealed a total of ZCTA-level Chlamydia case counts, which demonstrated substantial heterogeneity across the intervention study area. Summary statistics indicated strong overdispersion in case counts relative to population size, supporting the use of a Poisson-based or quasi-Poisson modeling framework (Table 1).
|
|
|
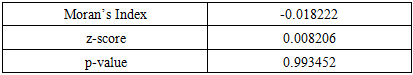
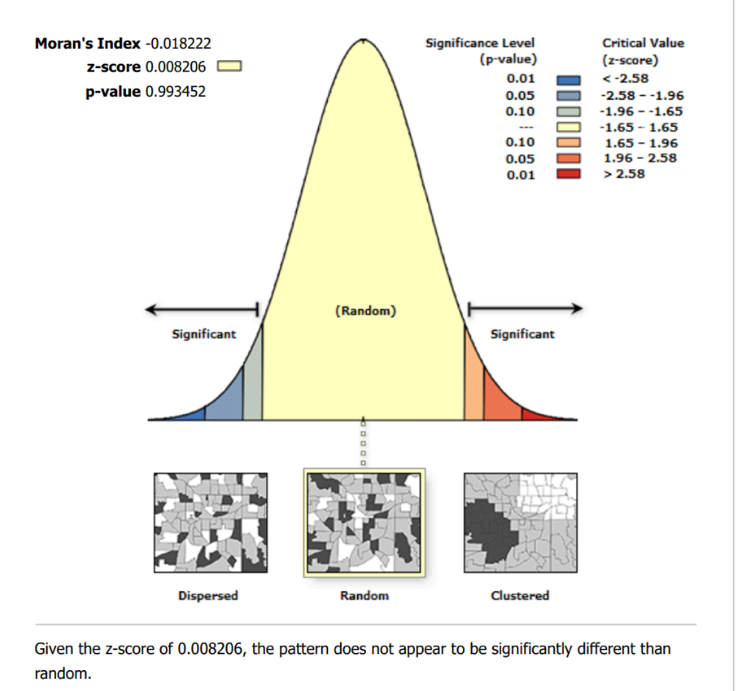 | Figure 2. Spatial Autocorrelation Report |
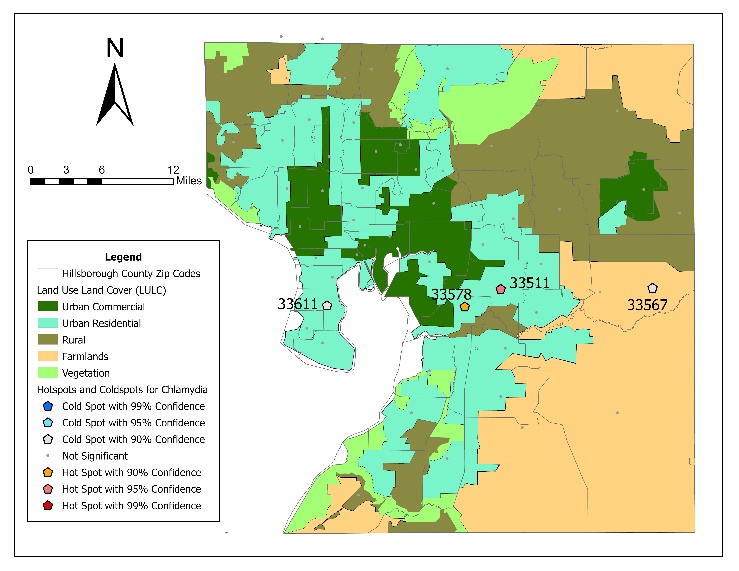 | Figure 3. Hot and cold spot map of Chlamydia cases in Hillsborough County by ZCTA |
|
4. Discussion
- This study identified localized clustering patterns in chlamydia incidence despite the absence of statistically significant global spatial autocorrelation, with hot and cold spot patterns consistent with localized spatial variability in estimated risk patterns (Figure 2). The absence of significant global spatial autocorrelation (e.g., Moran’s I) and exploratory local clustering patterns suggested that chlamydia burden in Hillsborough County is not evenly distributed across space but is instead concentrated within geographically constrained and socially patterned risk environments. (2 Table) These findings reinforce prior epidemiological evidence that chlamydia infections cluster in space due to the interaction of sexual network structure, structural inequality, and differential access to prevention and screening services ([4,6]).A key contribution of this study is the integration of satellite-derived environmental information from Sentinel-2 with sociodemographic, racial, and socioeconomic epidemiological data to improve fine-scale risk estimation. Machine learning–based spectral upscaling models successfully translated ZCTA-level environmental signatures into higher-level spatial representations, enabling scalable inference from local to county-level patterns. The strong performance of Gradient Boosting and Random Forest models highlights the importance of nonlinear interactions between built-environment characteristics and underlying socioeconomic conditions in shaping Chlamydia infection risk. These results suggest that remotely sensed indicators of urban form, vegetation, and land use can serve as meaningful proxies for structural determinants of Chlamydia infection when direct survey data are incomplete or unavailable.The eigenfunction decomposition approach provided an important advancement in identifying multiscale spatial dependence in chlamydia incidence. Unlike traditional parametric spatial models, eigenfunction-based spatial filtering does not impose restrictive assumptions about stationarity or global smoothness. Instead, it decomposes spatial autocorrelation into orthogonal components that capture both broad regional trends and localized clustering. The removal of residual spatial autocorrelation after the inclusion of eigenfunctions indicates that this approach effectively accounted for latent spatial processes not captured by the observed Chlamydia infection covariates alone. Importantly, the resulting hot- and cold-spot maps revealed stable microgeographic clusters that likely reflect underlying sexual network connectivity and persistent structural vulnerabilities.The comparatively stronger performance of the eigenfunction–Poisson hybrid model over non-spatial and purely machine learning approaches highlights a broader methodological implication: accurate modeling of chlamydia risk requires explicit representation of spatial dependence rather than treating geography as an incidental feature. While machine learning models were effective at capturing complex nonlinear relationships, they did not fully eliminate spatial autocorrelation in residuals of our predictive ZCTA model, suggesting that purely data-driven approaches may overlook latent spatial structure critical for modeling spatial heterogeneity in estimated chlamydia vulnerability. In contrast, the integration of spatial eigenfunctions ensured that unobserved spatial processes were directly incorporated into the modeling framework, resulting in improved predictive accuracy and more reliable uncertainty quantification of the sampled chlamydia estimator determinants.The findings of this study have direct implications for precision public health and chlamydia infection control strategies. First, the identification of stable ZCTA-level hot spots suggests that current surveillance systems in Hillsborough County rely on county- or state-level aggregation, which may mask critical micro-epidemiological heterogeneity. Public health programs in Hillsborough and other counties should therefore consider adopting finer spatial units such as ZCTAs for routine monitoring and intervention planning, particularly in urban settings where Chlamydia infection spatial heterogeneity in estimated vulnerability may be highly localized. Second, the integration of remotely sensed environmental data from Sentinel-2 with sociodemographic, racial, and socioeconomic stratified indicators provides a scalable approach for identifying high-risk ZCTA areas in near real time. This capability could help inform exploratory public health planning and geographically targeted surveillance prioritization. In practice, this may translate into targeted deployment of mobile testing units, school-based screening programs, and community outreach in identified hot spot ZCTAs.Third, the persistence of spatial clustering after adjustment for the observed covariates underscores the importance of addressing structural drivers associated with elevated estimated chlamydia vulnerability, including poverty, housing instability, and unequal access to healthcare. Policy interventions that focus exclusively on individual-level behavior change are likely to be insufficient in isolation. Instead, our results support place-based interventions that address upstream determinants of risk, such as expanding sexual health clinic coverage in underserved areas and improving access to low-cost or free screening services in identified high chlamydia burden ZCTAs.Finally, the modeling framework developed in this study provides a transferable tool for other communicable diseases exhibiting spatial clustering. By combining machine learning–based environmental scaling with eigenfunction-based spatial filtering, public health agencies can develop robust, interpretable risk maps even in the presence of incomplete surveillance data. This supports a shift toward predictive, data-integrated surveillance systems that can support exploratory spatial monitoring of potentially elevated-risk areas.A major limitation of this study is that ZCTA-level chlamydia case counts were not directly available from surveillance systems. Therefore, ZCTA estimates were generated using proportional allocation from county-level incidence and population distributions. These estimates should not be interpreted as observed surveillance counts or definitive measures of localized transmission. Consequently, identified hotspot patterns represent exploratory spatial risk approximations rather than validated transmission clusters. Chlamydia surveillance data may be subject to well-known biases, including underdiagnosis and underreporting, which may vary systematically across ZCTAs depending on healthcare access, testing availability, and healthcare-seeking behavior ([21,22,23]). As a result, observed case counts may reflect differences in screening intensity as much as true infection prevalence, potentially introducing measurement bias into both the Poisson and machine learning models.Second, the use of ZCTAs as the primary spatial unit introduces a degree of spatial aggregation error, including the Modifiable Areal Unit Problem (MAUP). While ZCTAs provide a practical compromise between spatial resolution and data availability, they do not necessarily correspond to true social or sexual network boundaries. This may lead to smoothing or misalignment of underlying spatial dependence processes, particularly in densely populated urban areas where micro-scale heterogeneity is likely to be high.Third, although the integration of machine learning–based spectral upscaling using Sentinel-2 imagery improves environmental characterization, satellite-derived proxies remain indirect measures of social and behavioral determinants of infection risk. Consequently, their interpretation requires caution, as correlations between spectral indices and chlamydia incidence may be mediated by unobserved confounding factors such as mobility patterns or healthcare infrastructure.Fourth, while eigenfunction decomposition effectively captures latent spatial structure and reduces residual spatial autocorrelation, it remains a descriptive rather than a mechanistic approach. The eigenvectors themselves do not directly represent causal spatial epidemiologic processes but instead approximate spatial dependence structures. Therefore, while useful for prediction and mapping, they do not alone establish causal pathways of transmission.Future research should focus on improving both the temporal and mechanistic resolution of spatial chlamydia ZCTA modeling frameworks. One important direction is the integration of longitudinal data streams to enable dynamic modeling of infection spread over time. Spatiotemporal extensions of eigenfunction-based models or Bayesian hierarchical frameworks could better capture evolving transmission patterns and allow for early detection of emerging hot spots. Incorporating individual-level or network-informed data where available could help bridge the gap between ecological spatial patterns and underlying spatial heterogeneity, potentially associated with structural vulnerabilities. This could include anonymized partner services data or mobility-informed contact structures, which may improve mechanistic interpretation of identified clusters. Additionally, future work should expand the use of high-resolution Earth observation data beyond Sentinel-2 to include additional satellite platforms (e.g., nighttime lights, thermal imagery, and radar-based systems) to better capture multidimensional aspects of the built environment, including economic activity, housing density, and environmental stressors. Importantly, methodological advances in interpretable machine learning and spatial deep learning could further improve the ability to disentangle nonlinear relationships between environmental features and disease risk while maintaining spatial coherence. Graph-based neural networks and spatial attention models may offer particularly promising extensions for capturing complex spatial dependencies beyond eigenfunction decomposition.Furthermore, from a public health implementation perspective, future studies should focus on translating static risk maps into operational decision-support systems. This includes developing real-time or near-real-time surveillance dashboards that continuously update ZCTA-level risk estimates and support adaptive intervention strategies such as targeted screening, resource allocation, and outbreak response. Evaluating the real-world impact of such systems on reducing chlamydia incidence should be a key priority in future applied research.Exploratory hotspot visualization suggested localized spatial heterogeneity in estimated chlamydia risk proxies. Among the evaluated exploratory models, Gradient Boosting demonstrated comparatively stronger predictive fit metrics. The resulting hot and cold spot maps revealed fine-scale heterogeneity in estimated vulnerability patterns that is not observable in coarser county-level analyses, supporting the importance of high-resolution spatial epidemiology for Chlamydia infection surveillance.
5. Conclusions
- Overall, this study demonstrates that integrating geospatial machine learning, satellite-derived environmental data, and eigenfunction-based spatial modeling provided an exploratory framework for evaluating fine-scale spatial heterogeneity in estimated chlamydia vulnerability patterns. The results highlight the importance of explicitly modeling spatial dependence and leveraging multi-source data integration to support exploratory geospatial public health surveillance frameworks. These approaches offer a pathway toward more targeted, efficient, and equitable public health interventions aimed at reducing the burden of chlamydia infection at the neighborhood level.