-
Paper Information
- Paper Submission
-
Journal Information
- About This Journal
- Editorial Board
- Current Issue
- Archive
- Author Guidelines
- Contact Us
American Journal of Mathematics and Statistics
p-ISSN: 2162-948X e-ISSN: 2162-8475
2024; 14(1): 9-15
doi:10.5923/j.ajms.20241401.02
Received: Apr. 14, 2024; Accepted: May 5, 2024; Published: May 8, 2024

Exploring Optimal Probability Distribution for Consecutive Wet Spells in Chittagong Division, Bangladesh
 Abstract
 Reference
 Full-Text PDF
 Full-text HTML
Sanjib Ghosh1, Lipon Chandra Das2, Rezaul Ahmed1, A. S. M. Mohiul Islam2
1Department of Statistics, University of Chittagong, Chittagong, Bangladesh
2Department of Mathematics, University of Chittagong, Chittagong, Bangladesh
Correspondence to: Lipon Chandra Das, Department of Mathematics, University of Chittagong, Chittagong, Bangladesh.
| Email: |  |
Copyright © 2024 The Author(s). Published by Scientific & Academic Publishing.
This work is licensed under the Creative Commons Attribution International License (CC BY).
http://creativecommons.org/licenses/by/4.0/

Bangladesh heavily depends on rainfall, with critical factors being the timing and duration of both dry and wet periods. The main objective of this study is that to find suitable probability distribution fit wet spell data. The daily rainfall data for the period of 1981 to 2021 of distantly located stations in Bangladesh such as Chittagong, Rangamati and Cox’s Bazar. Because, the likelihood of a wet period in nature is obvious, and empirical probability distribution models are positively skewed, we postulated distributions such as the Poisson, Geometric, Log-normal, Weibull, and Gamma distribution. The Kolmogorov-Smirnov goodness-of-fit test is used to assess the fit of probability distributions by isolating wet spells and regular rainfall durations from daily rainfall data across three seasons: cool dry monsoon, cool wet monsoon, and hot humid summer. The Akaike Information Criteria (AIC) and Bayesian Information Criteria (BIC) are employed for the purpose of selecting the most appropriate fitted model. The test result shows that the Log-normal distribution is the best fitted model for the wet spell data during cool wet monsoon and cool dry monsoon for all the three selected stations. For hot humid summer geometric distribution shows close fit to the wet spell data but from model selection procedure AIC and BIC produce least value for Log-normal distribution.
Keywords: Probability distribution, Rainfall, Wet spell, Kolmogorov-Smirnov, AIC, BIC
Cite this paper: Sanjib Ghosh, Lipon Chandra Das, Rezaul Ahmed, A. S. M. Mohiul Islam, Exploring Optimal Probability Distribution for Consecutive Wet Spells in Chittagong Division, Bangladesh, American Journal of Mathematics and Statistics, Vol. 14 No. 1, 2024, pp. 9-15. doi: 10.5923/j.ajms.20241401.02.
Article Outline
1. Introduction
- Bangladesh is an agricultural country, with around 80% of its 145 million inhabitants directly or indirectly involved in a variety of agricultural activities (Banglapedia, 2003). Rainfall is the most important natural factor affecting agricultural production in Bangladesh. Rainfall unpredictability and extreme high or low precipitation patterns are critical to the country's agriculture and economy. Everywhere in the world, the need of developing adequate models to reflect the distribution of daily rainfall occurrence, specifically the succession of rainy days, has been recognized. The suitable probability model is quite beneficial, as practically all climate variables are dependent on the occurrence of a rainfall event. Furthermore, the models would help not just data gathering goals, but also the different associated sectors, such as water resource management, hydrology, and agriculture. The best probability model found throughout the investigation might also be used for data generation and prediction. Researchers in the field have always been interested in analyzing the spatial distribution of dry and wet spells in daily rainfall events (Wilks, 1999; Dobi-Wantuch et al., 2000). Rainfall is changing globally (Hulme et al., 1998; Lambert et al., 2003) and regionally (Gemmer et al., 2004) as a result of global warming. The first-order, two-state, homogeneous model is the most commonly employed for creating a sequence of rainy and dry days. Gabriel and Neumann (1962) applied a Markov chain to Tel Aviv data. This approach is widely used because of its simplicity of calculations (Katz, 1974; Geng et al., 1986). This model predicts a geometric distribution for the probability of long dry or wet spells. However, it tends to overestimate short dry sequences while underestimating long dry sequences (Berger and Goossens, 1983). Although a number of studies on rainfall patterns have been conducted (Ahmed and Karmakar, 1993; Hussain and Sultana, 1996; Rahman et al., 1997; Shahid, 2008; Das and Zhang, 2021), only a few studies have been found on well-fit wet spell data in Bangladesh. Rahman et al. (1997) employed trend analysis to investigate variations in Bangladesh's monsoon rainfall and found no significant change. Ahmed (1989) predicted probabilistic rainfall extremes in Bangladesh during the pre-monsoon season. Karmakar and Khatun (1995) conducted a similar investigation of rainfall extremes during the southwest monsoon season. However, both studies focused solely on maximum rainfall events during a brief time span. According to May (2004), the frequency of wet days has increased significantly across the tropical Indian Ocean. He anticipated that the intensity of heavy rain occurrences in Bangladesh would rise in the future. Immerzeel (2007) predicted that seasonal precipitation would grow more rapidly in the twenty-first century, with the Brahmaputra basin experiencing the greatest increase. Mahsin et.al. (2012) have studied time series modeling for monthly rainfall data of Dhaka station over period 1981 to 2010. They used Box-Jenkins methodology to build seasonal ARIMA model for monthly rainfall data and found ARIMA (0, 0, 1) (0, 1, 1) be adequate fit to the data. Alam and Hossain (2016) have studied geostatistical approach to predict average annual rainfall of Bangladesh. They collect data from 46 stations of Bangladesh from www.barc.gov.bd. They used four theoretical semivariogram models such as Exponential, Sphercial, Gaussian and Matern were used to explain the spatial variation among the average annual rainfall. They found that ordinary kriging performs better then compared to k-fold cross validation when the spatial dependency in average annual rainfall of Bangladesh is modeled through Gaussian semivariogram model.The preceding investigation reveals that the predominant focus of researchers has been on analyzing rainfall data quantity, employing various methodologies. However, scant attention has been directed towards studying dry spell patterns utilizing a probabilistic framework, with a notable absence of research concerning wet spell patterns during the growing or rainy seasons. Our study addresses this gap by investigating wet spell and growing season patterns at Chittagong, Rangamati, and Cox’s Bazar stations. Our main objective is to determine suitable probability distribution models for wet spell data at these stations, utilizing rigorous evaluation methods such as the Kolmogorov-Smirnov test, AIC, and BIC.
2. Methods
2.1. Study Area
- As all climate events are the complex combination of various meteorological factors, in this study we tried to take into account the data over a best possible long period. The daily rainfall data for the period 1981 to 2021 collected by the Meteorological Department, Government of People’s Republic of Bangladesh is the most reliable main source of rainfall data. The missing values in the data series were estimated using various weighting methods, such as the inverse distance, the normal ratio, and the correlation between the targets and neighboring stations (Suhaila et al. 2008; Teegavarapu and Chandramouli 2005). The entire year is divided into three distinct time periods based on the occurrence of rainfall: the cool dry season from October 15th to March 14th; the hot humid summer from March 15th to June 14th; and the cool wet monsoon season from June 15th to October 14th. A wet spell is the rainy day or days between two dry whereas a dry spell is the day or days between two wet day or days. A wet day is defined as a day with a rainfall amount of at least 0.1 mm. A wet spell is a period of consecutive days of exactly, say, x wet days immediately preceded and followed by a dry day. The minimum length of a wet spell is taken as one day, which means a single wet day. Traditionally monsoon period is considered as June 15 to August 15. The duration of the growing season, the start of the monsoon, and its end are all relative to one another and change significantly from year to year. The term "growing season" here refers to the length of the monsoon season. To find the optimal distribution and best model of wet spells data of the three selected rainfall stations in the Chittagong division, which are Chittagong City, Rangamati Hill Track Station, and Cox's Bazar Coastal Area. Figure 1 depicts the Chittagong division map as well as the data collecting locations. The environmental condition of the selected region is described as follows:
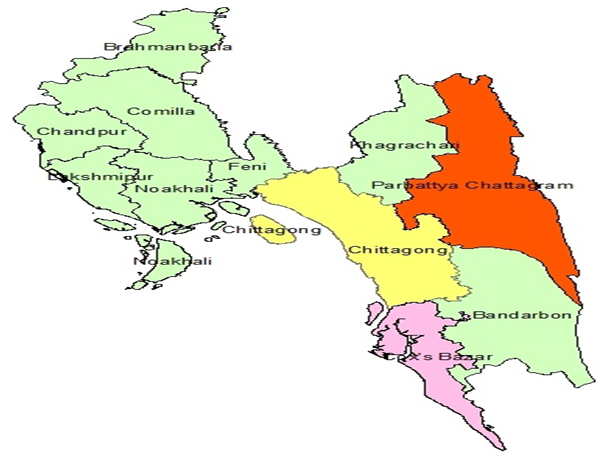 | Figure 1. Location of rainfall station at Chittagong Division in Bangladesh |
2.1.1. Chittagong
- The port city Chittagong is the second largest city in Bangladesh. It is situated in the south-eastern portion of the country and was built on the bank of the Kornofulli River. Its graphical coordinates are 22°21′49″ N and 91°48′12″ E. The total area of the district 5282.98 square kilometer. Chittagong experiences an average annual maximum temperature of 30°C and a minimum of 23°C. Typically, the city receives about 138.66 millimeters (5.46 inches) of precipitation and has 155.82 rainy days (42.69% of the time) annually.
2.1.2. Rangamati (Parbattya Chattagram)
- Rangamati serves as the administrative headquarter and main town of the Rangamati Hill District located in the Chittagong Hill Tracts of Bangladesh. Its geographical coordinates are 22°37' N and 92°12'0″ E. Located at an elevation of 44.52 meters (146.06 feet) above sea level, Rangamati has a Tropical monsoon climate. The district’s yearly temperature is 27.17°C (80.91°F) and it is -0.57% lower than Bangladesh’s averages. Rangamati typically receives about 141.7 millimeters of precipitation and has 159.23 rainy days (43.62% of the time) annually.
2.1.3. Cox’s Bazar
- Cox's Bazar is situated 150 kilometers south of Chittagong, the divisional headquarter city. The town itself spans an area of 6.85 square kilometers and is bordered by the Bakkhali River to the north and east, the Bay of Bengal to the west, and Jhilwanj Union to the south (Ahmed et. al. 2012). The beach in Cox's Bazar has a gentle slope and with an unbroken length of 155 km it is often termed the "longest natural unbroken sea beach" in the world. The climate of Cox's Bazar is mostly similar to the rest of the country, but with an even wetter southwest monsoon season due to its coastal location. The annual average temperature in Cox's Bazar is a maximum of 30.1°C (86.2 °F) and a minimum of 22.0°C (71.6 °F). The average annual rainfall is 3,524 mm.
2.2. Modeling the Duration of Wet Spell
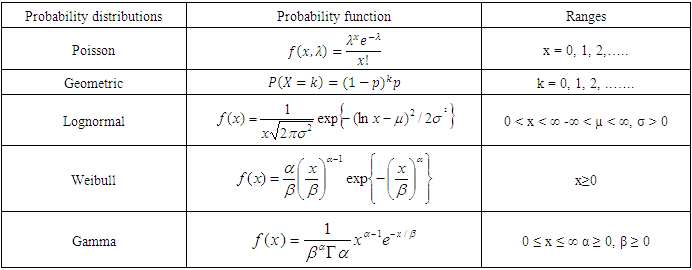
- To fit a probability model to observed dry and wet spell distributions, parameters are using maximum likelihood, moment, or factorial moment approaches. Throughout the analysis, the following notations will be used: Nx is the observed frequencies of wet spell of length x days, N is the total observed frequencies of wet spells, while
 and s2 denote the sample values of E(X) and Var(X), respectively. Table 1 briefly describes the probability distribution applied, including the probability functions and ranges for the 5 models tested.
|
2.3. Goodness-of-Fit Test (GOF)
- The Goodness-of-Fit (GoF) test is utilized to ascertain the most suitable model among the distributions examined for wet spell characteristics. The goodness-of-fit test is performed in order to test the following hypothesis: H0: The wet spells data follow the specified distributionH1: The wet spells of data do not follow the specified distributionA Kolmogorov-Smirnov test at significance level (α=0.05) for choosing the best probability distribution (Sharma and Singh, 2010). The Kolmogorov-Smirnov test (Chakravarty et al., 1967) is used to determine whether a sample comes from a population with a specific distribution. This test relies on the empirical distribution function (ECDF). Given N ordered data points Y1, Y2, ..., YN, the ECDF is defined as follows:
 , where n(i) represents the number of points less than Yi and the Yi are ordered from the smallest to largest value. The ECDF is a step function that increases by 1/N at the value of each ordered data point.
 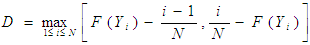 Where F is the theoretical cumulative distribution and it must be fully specified.
2.4. Akaike’s Information Criteria (AIC)
- Akaike’s Information Criteria (AIC) procedure aims to characterize the goodness of fit and closeness of a model with the actual situation. This statistic is introduced as a measure of the deviation of the fitted model from the true structure by measuring the Kullback-Leibler information (Kullback-Leibler, 1951) using mean expected log-likelihood of the model interest. The reason behind the fact that AIC is an estimate of the mean expected log-likelihood which can be defined as the mean of the expected log-likelihood of the maximum likelihood model where the mean is measured with respect to the data. The large the mean expected log-likelihood the better the fit of the model. To develop the autoregressive model Akaike (1974) has defined final prediction error (EPE) as the mean square prediction error of a predictor. Again, to develop the general statistical model he has also extended (Akaike, 1974) the EPE procedure under AIC which is defined as:AIC = -2 (maximum log likelihood) + 2(number estimable parameter in the model)
2.5. Bayesian Information Criteria (BIC)
- The Bayesian Information Criterion (BIC) was introduced by Gideon E. Schwarz in 1978. Schwarz provided a Bayesian rationale for its adoption, offering a principled approach to model selection by balancing goodness of fit against model complexity. It is closely related the AIC. In fact, Akaike was so impressed with Schwarz’s Baysian formalism that he developed his own Bayesian formalism, now often referred to as the ABIC for “a Bayesian Information Criterion” or more casually “Akaike Bayesian Information Criterion”. The BIC is an asymptotic result derived under the assumptions that the data distribution is in exponential family. Let, x is the observed data, n is the number of observations, k is the number of free parameter and L is the maximized value of the likelihood function for the estimated model.The formula for BIC is given by-BIC = -2 ln L + l ln (n)
3. Result and Discussion
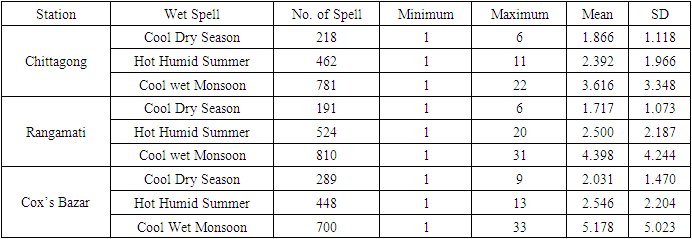
- The table 2 summarizes the statistical parameters including the total number of spells, minimum, maximum, mean, and standard deviation (SD) for wet spells data recorded at three selected stations and across three different time durations.
|
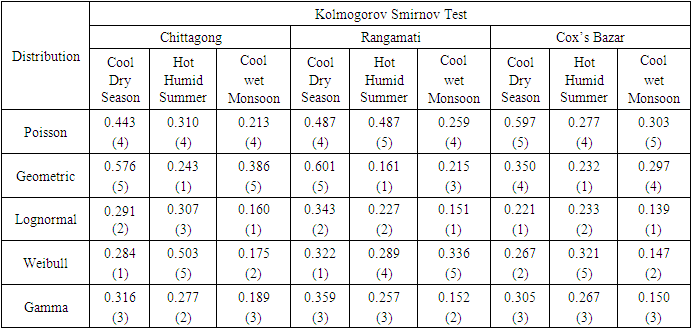
3.1. Cool Dry Monsoon
- According to the Kolmogorov Smirnov test value in Table 3, the wet spell data at Chittagong, Rangamati, and Cox's Bazar stations during the cool dry monsoon season is well fitted by the Weibull, Weibull and Lognormal distributions. However, based on the model selection criteria, we can see in tables 4, 5, and 6 that the lognormal distribution has the lowest AIC and BIC values. Because AIC and BIC model selection criteria are also based on the probability principle, examining wet spell data using AIC and BIC for the cool dry monsoon lognormal distribution may be the best model for the selected stations.
3.2. Hot Humid Summer
- According to the Kolmogorov Smirnov test value in Table 3, the wet spell data from Chittagong, Rangamati, and Cox's Bazar stations during the hot and humid summer season fits well with the geometric distributions. However, based on the model selection criteria, the lognormal distribution has the least AIC and BIC values, as shown in tables 4-6. Because AIC and BIC model selection criteria are also based on the probability principle, analyzing wet spell data for the hot humid summer lognormal distribution may be the best model for the selected stations.
3.3. Cool Wet Monsoon
- From the Kolmogorov Smirnov Test value of Table 3, we observed that Chittagong, Rangamati and Cox’s Bazar station of the wet spell data during cool wet monsoon season lognormal distribution shows the significance fit of the data. But from model selection criteria we see the tables 4-6 that the AIC and BIC value is least for Lognormal distribution. The AIC and BIC suggest that the lognormal distribution for the cool wet monsoon may be the optimal model for the selected stations in analyzing wet spell data, as both criteria are grounded in the principle of probability.
|
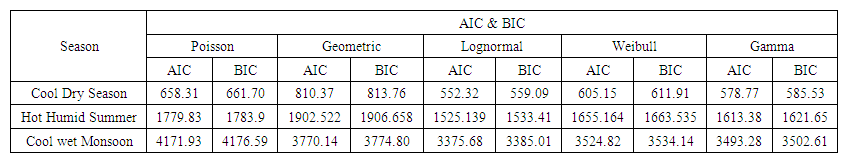 | Table 4. Best model using AIC and BIC for Chittagong Station |
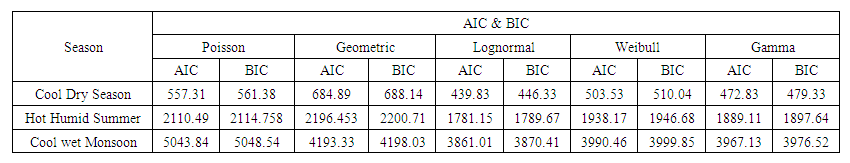 | Table 5. Best model using AIC and BIC for Rangamati Station |
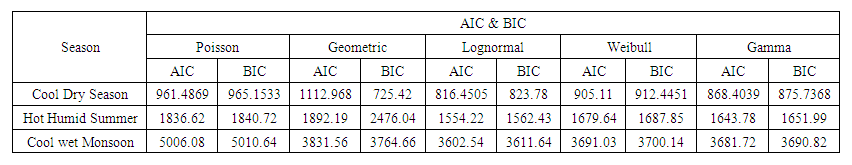 | Table 6. Best model using AIC and BIC for Cox’s Bazar Station |
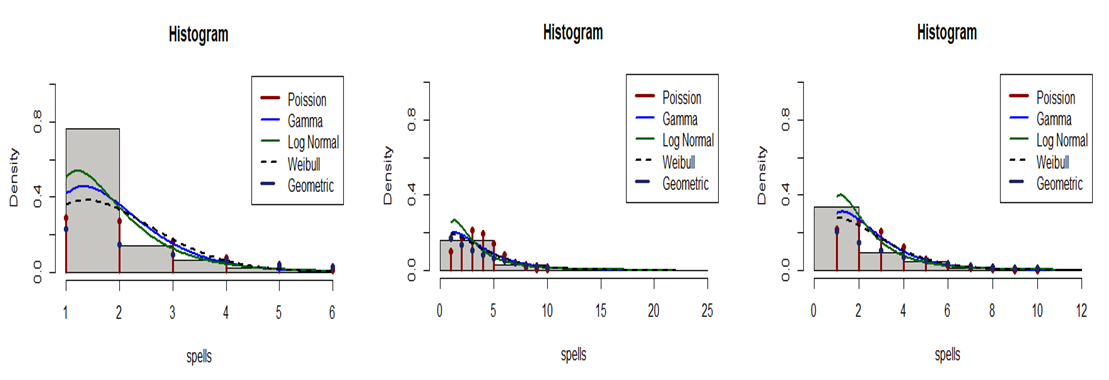 | Figure 2. PDFs fit to histogram of wet spells different duration of cool dry season, hot humid summer and cool wet monsoon (left to right) for Chittagong station |
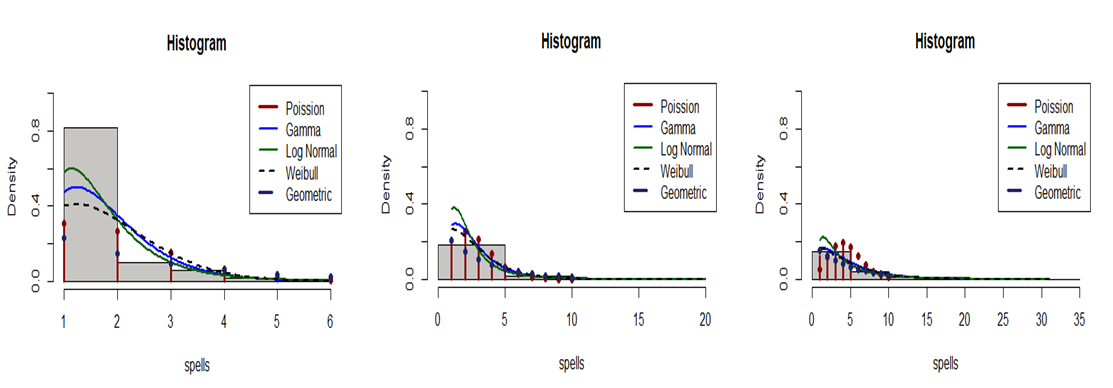 | Figure 3. PDFs fit to histogram of wet spells different duration of cool dry season, hot humid summer and cool wet monsoon (left to right) for Rangamati station |
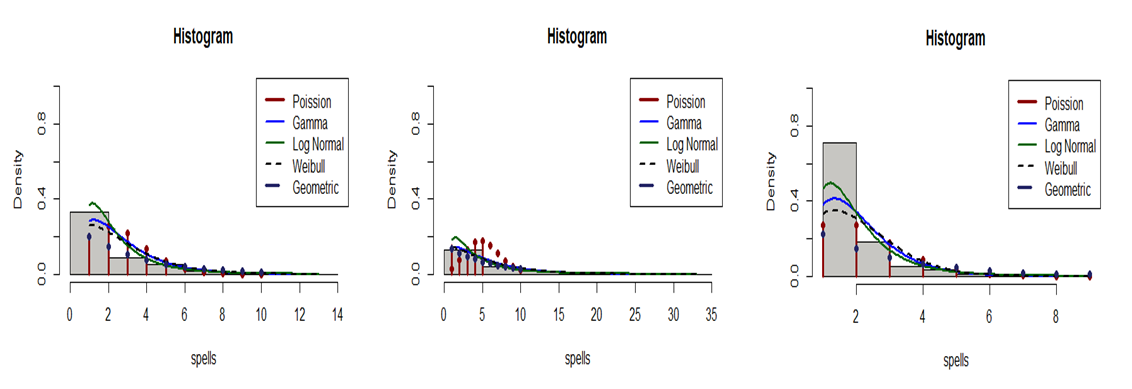 | Figure 4. PDFs fit to histogram of wet spells different duration of cool dry season, hot humid summer and cool wet monsoon (left to right) for Cox’s Bazar station |
4. Conclusions
- In this study we observed that the Log-normal distribution is the best fitted model for the wet spell data during cool dry season and cool wet monsoon for all the three stations. For hot humid summer geometric distribution shows close fit to the wet spell data but from model selection procedure AIC and BIC produce least value for Log-normal distribution. According to the earlier explanation, wet spell data for the cool wet monsoon, cool dry season, and hot humid summer follow a Log-normal distribution and are regarded as the best model based on model selection criteria. This paper proposes probability models to improve the stochastic weather generator model, with potential applications across various domains. Future investigations will delve into identifying optimal probability models for diverse geographical locations, accounting for seasonal variations and the impact of global warming. Additionally, forthcoming research endeavors will concentrate on analyzing extreme dry and wet spells, offering valuable insights for hydrological and agricultural practices.