-
Paper Information
- Paper Submission
-
Journal Information
- About This Journal
- Editorial Board
- Current Issue
- Archive
- Author Guidelines
- Contact Us
American Journal of Mathematics and Statistics
p-ISSN: 2162-948X e-ISSN: 2162-8475
2023; 13(2): 84-98
doi:10.5923/j.ajms.20231302.03
Received: Nov. 7, 2023; Accepted: Nov. 20, 2023; Published: Dec. 13, 2023

Spatial Modelling of Health Insurance Uptake Among Women of Reproductive Age in Tanzania
 Abstract
 Reference
 Full-Text PDF
 Full-text HTML
Doreen Laurent1, Hamad Zahor Hamad2
1Lecturer Department of Mathematics and Actuarial Studies, Institute of Finance Management, Dar Es Salaam, Tanzania
2Assistant Lecturer Department of Mathematics and Statistics, The University of Dodoma, Dodoma, Tanzania
Correspondence to: Doreen Laurent, Lecturer Department of Mathematics and Actuarial Studies, Institute of Finance Management, Dar Es Salaam, Tanzania.
| Email: |  |
Copyright © 2023 The Author(s). Published by Scientific & Academic Publishing.
This work is licensed under the Creative Commons Attribution International License (CC BY).
http://creativecommons.org/licenses/by/4.0/

Health insurance is considered to be an essential part of health care financing around the world and one of the mechanisms to achieve universal health coverage. However, in Tanzania, the coverage of health insurance among women aged 15-49 years is very low. This study examined the spatial distribution patterns of health insurance uptake among women of reproductive age. This study used secondary data derived from the 2015 TDHS-MIS whereby 13,266 reproductive-age women used as the sample. The Bernoulli model was adopted by applying Kulldorff methods using the SaTScan software to analyse the purely spatial clusters of uptakes of health insurance. ArcGIS version 10.3 was used to visualize the distribution of health insurance coverage across the country. The generalized estimating equation (GEE) logistic regression model was used to assess factors associated with uptake of health insurance using SAS version 9.4. The study found that the distribution of health insurance uptake among women aged 15-49 years had spatial patterns and clustered across the country. Women from Mainland Tanzania were about eleven times more odds of purchasing health insurance compared to those from Zanzibar. Place of residence, wealth index, level of education, marital status, age, visits to health facilities, and watching television were the important factors associated with health insurance coverage among reproductive-age women in Tanzania. Stakeholders should act on factors that reduce the chance of health insurance uptake by taking coherent and harmonized actions such as strengthening financial fortification through national health packages, sharing the experience with the regions having higher health insurance coverage, and increasing awareness and confidence of potential in the systems, which may encourage them to join.
Keywords: Health insurance uptake, Spatial modelling, Women of reproductive age, Tanzania
Cite this paper: Doreen Laurent, Hamad Zahor Hamad, Spatial Modelling of Health Insurance Uptake Among Women of Reproductive Age in Tanzania, American Journal of Mathematics and Statistics, Vol. 13 No. 2, 2023, pp. 84-98. doi: 10.5923/j.ajms.20231302.03.
Article Outline
1. Introduction
- As the globe pushes for universal health coverage, about two billion people are facing catastrophic or impoverishing health spending. By shielding people from the financial repercussions of paying for healthcare out of their own pockets, it is less likely that they will become impoverished because of unexpected illness that forces them to spend all their savings, sell off their assets, or take out loans, often at the expense of their futures and frequently those of their children (WHO, 2021). Developing nations have been constructing health insurance schemes to increase access to healthcare more frequently in recent years as a response to such devastations (Domapielle, 2014).One way to achieve universal health coverage, which is the core goal of health transformation in many countries and a top WHO priority is through health insurance. Health insurance plays a vital role in not just preventing and treating sickness and illness, but also enhancing the quality of life for the people and entire communities. It is acknowledged as the dominant approach to achieving universal health coverage and aids in ensuring a balance between population health investments and health care finance (Evans and Etienne, 2010; Evans et al., 2013). While there are other health insurance plans, community-based insurance, social insurance, private insurance, and micro (small-scale) insurance are the most widely used plans in Tanzania (Borghi and Joachim, 2011; Musau et al., 2011). The capacity of women of reproductive age to obtain inexpensive insurance and medical care could have repercussions for society and is reliant on the financial gains for women and their families (Finkelsteinet al., 2012; Bailey and Lindo, 2017). For instance, coverage before and during pregnancy can permit access to interventions to eliminate behavioral risk factors, manage chronic disease, and improve overall preconception health, which relates to mother and baby health outcomes (Stephenson et al, 2018). Evidence has also indicated that health insurance enhances access to contraception which reduces unintended pregnancies and improves pregnancy spacing. Subsequently after delivery, insurance could ease women’s access to diagnosis and treatment of pregnancy-related physical and mental health issues, including postpartum anxiety and depressive disorders (Ghosh et al., 2017). However, the availability of low-quality healthcare services, financial limitations, and a lack of pre-payment financial arrangements for healthcare remain significant hurdles to lower utilization of healthcare services among women of reproductive age (see, Kimani et al., 2014; Adebayo et al., 2015; Demissie and Gutema, 2020; Shudra et al., 2020; Adisu et al., 2021).All population groups should have health insurance, but it is especially beneficial for the most vulnerable, including pregnant women, infants, and children. Health insurance also helps most Tanzanian families become more socially integrated by establishing fair and long-lasting financial protection. Women frequently find it difficult to get care on their own because they lack financial independence and health insurance, particularly in underdeveloped nations like Tanzania (Adebayo et al., 2015). The focus on women of reproductive age is because, in a developing country, these demographic experiences greater health issues than males, notably due to risks to reproductive health (Kumi-Kyereme and Amo-Adjei, 2013). This is only to highlight that women are a unique group in this setting and not trying to minimize the demands of males in terms of health. A study by Mensah et al. (2010) discovered that increasing health insurance coverage could hasten the fulfillment of the Millennium Development Goals since insured women reported better reproductive health outcomes than uninsured women did. Thus, by focusing on reproductive age women one can draw attention to the traits of the women who might be the subject of interventions.To explain decision-making processes towards up taking health insurance in underdeveloped areas, several theoretical hypotheses have been developed in the literature on health insurance. One of these important reviews of related theoretical frameworks was presented by Schneider (2014). Consumer choice, expected utility, state-dependent utility, prospect, cumulative prospect, endowment/status quo/veil of experience, regret and disappointment, time preferences, poverty, and social capital are a few of the decision-making model variations supported. The time preferences, the state-dependent utility, and the poverty models help us examine the impact of specific demographic and socioeconomic factors on insurance membership among low country women like Tanzanian women. Also give us several instinctive justifications for why individuals buy or do not buy insurance (Kumi-Kyereme and Amo-Adjei, 2013). From spatial perspective, according to the Jehu-Appiah et al. (2010) cited in Kumi-Kyereme et al. (2013), geographic targeting offers a practical method for determining which individuals, based on physical location, need insurance the most. More than an individual level metric, geographic targeting is a population level measure. The requirement to identify populations who live in places with significantly higher levels of poverty is frequently the basis for this approach.The geographic distribution of health insurance uptake, as reported by the Tanzania Demographic and Health Survey and Malaria Indicator Survey 2015, has been varied. Spatial analysis, however, have not been carried out to pinpoint Tanzanian hotspots (poor health insurance uptake) among women. Consequently, we used the TDHS-MIS 2015 to determine the spatial variation of uptake health insurance and related factors among reproductive age women in Tanzania.To prioritize and create targeted intervention programs to address universal health coverage through health insurance, it is critical to identify regional distributions of health insurance and the impact of risk factors on uptake of health insurance by area. Additionally, it is essential to comprehend the spatial variation in health insurance uptake to design community-based interventions in the areas with low health insurance uptake that have been identified as hotspots. This will help maximize the use of scarce resources and ensure proper mobilization, accumulation, and allocation of funds for meeting the needs of the populace's health.
2. Literature Review
2.1. Theoretical Literature
- Health insurance is a dominant mechanism to have good health spending; it supports and inspires the health scheme functions. It offers the best prepayment arrangements thus individuals obtaining services to level where marginal benefits from substandard care provided is balanced out by the marginal gains (Cutler and Zeckhauser, 2000).The theories that applied to clarify the reasons for up taking health insurance, one is the conventional theory whereby given the same magnitude, an individual favors certain loss to uncertain ones. Moreover, one is the alternative theory that consumer chooses transfer of income therefore premiums are transferred from healthy to unhealthy individuals allowing client access to the care they could not otherwise afford (Nyman, 2006).
2.1.1. Moral Hazard Theory
- Moral hazard described as the propensity to alter the behavior when the cost of that behavior will be borne by others. The theory specifies that people or organizations with insurance may take risks that are greater than what they would have taken if they did not have insurance because they know they have monetary protection from the adverse effects that might arise out of the hazardous behavior (Pauly, 1968; Arrow, 2009). It was emphasized that the presence of insurance presents a problem, as individual would want to consume more medical care because of its availability, however this rise the medical insurance premiums. Moreover, moral hazard leads the insurer to face excessive claims than expected (Pauly, 2000). In a health insurance setting, everybody is at risk of demanding medical care at some point. The care costs money and the insurer agree to pay for it if the protected pays a monthly premium. The main idea of this theory is that insurance removes all or part of the inducement to limit the use of insured services. With full insurance, there is no financial motive for insured not to visit the doctor (De Allegri et al., 2006). The presence of asymmetric information underlies the problem of this theory (Sinha, 2002). The asymmetry occurs because the insurer has less information about the health status of the insured. The insurer cannot check whether a physician visit would have made without insurance or because of some avoidable risks that the insured took.
2.1.2. Adverse Selection Theory
- This theory demonstrates the normal theoretical conclusions about the optimality and possibly even the presence of a competitive market equilibrium that can fail in the presence of asymmetric information. As the good risks start to exit, the regular quality of those insured remaining falls and prices rise in a spiteful circle, ending in a so called "death spiral" where no one is covered.Different theoretical models conclude that when adverse selection is a problem, good risks controlled. The insured allowed purchasing only limited coverage in an attempt to make such coverage less gorgeous to the bad risks, which would otherwise be keen to purchase it given its favorable price. It is relevant in the health insurance market since each individual chooses among the set of contracts offered by the insurance company according to their probability of using health services. That means, those who predict an intense use of health services will tend to choose more substantial plans than those who anticipate a more limited use of them. The high-risk individual will look for health insurance while a low risk individual will evade health insurance up to the point of requiring medical services to be paid (Belli, 2001; Siegelman, 2004).
2.1.3. Expected Utility Theory
- This is the descriptive model for decisions under risk holds that the health insurance demand is a demand for certainty. Given the rational choice, the model used to enlighten the decision-making under risk. While acquiring health insurance, there is an assumption that utility obtained when insured is higher than the cost given the utility forfeited for different goods and services. This theory can be explained in two viewpoints, one individual participates in health insurance schemes pay premiums from their income thus in event of sickness the cost of medical care which by that time is higher than premiums will be paid by the health insurance company. On the other hand, those not participating in a health insurance scheme do not pay premiums thus they will suffer the burden of paying for their medical care (Nyman, 2001). When making a decision that can result in a loss, individuals are risk-averse, they will prefer buying insurance meaning accepting certain losses of small premiums in exchange to uncertain ones (medical costs) (Friedman and Savage, 2003).
2.2. Empirical Literature
- This part reviews literature from different prior scholars regarding spatial modelling of health insurance uptake. It specifies what has been done including research methodologies used.A study used the 2002 Jamaican Survey of Living Conditions to model the determinants of health insurance uptake using logistic regression. The results found that durable goods, social standing, marital status, income, area of residence, education, crowding, social support, psychological conditions, retirement benefits, living arrangements, number of males in the household and good health affect the health insurance consumption. (Bourne and Kerr-Campbell, 2010).The study conducted to analyse the factors associated with health insurance coverage among women in sub-Saharan Africa. The study analyzed cross-sectional data of 307,611 reproductive-aged women from the most recent demographic and health surveys of 24 sub-Saharan African countries. Using chi-square test of independence and multilevel logistic regression, the findings of this study revealed that, the overall coverage of health insurance among women of reproductive age in Sub-Saharan Africa is 8.5%, with cross-country variations. Individual-level factors significantly associated with health insurance coverage included age, place of residence, level of formal education, frequency of reading newspapers/magazines and watching television. Wealth status and place of residence were the contextual factors significantly associated with health insurance coverage (Amu, et al., 2021).In Ghana, the study conducted to determine the effects of spatial location and household wealth on health insurance subscription among women in Ghana. The study used the 2008 Ghana Demographic and Health Survey. Using bivariate descriptive analysis coupled with binary logistic regression the findings showed that wealth and ecological zone were significant predictors of health insurance consumption among women in Ghana (Kumi-Kyereme and Amo-Adjei, 2013).Another study conducted in Ghana to investigate health insurance subscription among women in reproductive age in Ghana using 2014 Ghana Demographic and Health Survey. Using bivariate descriptive analysis and binary logistic regression the study found that education, wealth status, age, religion, birth parity, marriage and ecological zone predict health insurance consumption among women in their reproductive ages in Ghana (Hubert and Kwamena, 2016).The same to Ethiopia the research study to examine spatial distribution and associated factors of health insurance coverage in Ethiopia using Ethiopia demographic and health survey 2016 conducted. Using the Bernoulli model by applying Kulldorff methods to analyses the purely spatial clusters as well as Mixed-effect logistic regression revealed that health insurance consumption among women aged 15-49 years had spatial variations across the country. Also, reading newspapers, age, clerical working mothers, education, family size, wealth, were crucial predictors of health insurance consumption among women of reproductive age group in Ethiopia (Sewnet, et al., 2020).By using multilevel mixed effects generalized linear model the results this study showed that health insurance coverage in East Africa among women aged 15-45 was below ten percent. Educational status, working status, place of residence, wealth index, media exposure, visiting health facilities within 12 months, and being visited by field workers were significantly associated with health insurance coverage among reproductive age group women in East Africa. Improving women’s access to health facilities, promoting field workers visits, and media exposure targeting uneducated, unemployed, and rural resident women of reproductive age are a gateway to promote health insurance coverage. The most recent DHS data of the ten East African countries (Burundi, Comoros, Ethiopia, Kenya, Malawi, Mozambique, Tanzania, Uganda, Zambia, and Zimbabwe) were included (Adisu, et al., 2021).In Kenya, the 2008/09 Kenya Demographic and Health Survey data used to explore the determinants of health insurance choice in Kenya. Using the multinomial logit model, the study found that wealth index, marital status, education level and household size were influential determinants of health insurance consumption and choice (Kiplagat, 2011). Kimani, et al., (2014) conducted a study to examine the determinants of health insurance ownership among women in Kenya: the evidence from the 2008/09 Kenya demographic and health survey. Using descriptive statistics and multivariable logistic regression analysis the study revealed that, employment, marital status, mass media, education, wealth index, and head of household were associated with having health insurance among women in Kenya.Bintabara et al, (2018) conducted research in Tanzania to improve access to healthcare for women in Tanzania by addressing socioeconomic determinants and health insurance: a population-based cross-sectional survey. The study used a partial generalized ordered logistic regression model with alternative gamma parameterization to analyse the 2015 TDHS-MIS data. The findings showed that women without any type of health insurance were associated with greater problems in accessing healthcare.Another study was conducted in Tanzania to examine the determinants of health insurance uptake in Tanzania using THDS-MIS 2015. The descriptive statistics and probity model the study revealed that age, marital status, education level, place of residence, occupation, wealth index, visit to health facility, reading magazine or newspaper, watching television, listening to the radio and using the internet had a significant association with health insurance consumption (Lutinah, 2020).Based on the extant literature reviewed, it is evident that, the majority of the researches conducted on health insurance cantered the entire general population while few have focused on women. In addition, many studies performed globally tended to use logistic regression (probit or logit model) only, and few used spatial setting to assess the factors affecting the uptake of health insurance while adjusting for location and time effect. Moreover, the results from previous studies indicated that, women face more health challenges than men mostly because of reproductive health risks (Mensah et al., 2010). However, there are limited studies from other developing countries while the subject of discussion is relatively underexplored in Tanzania. To the best of our knowledge, this study will, for the first time, examined the spatial distribution patterns of health insurance uptake among women of reproductive age. The study focused on women of 15-49 years since they belong to the health-risky group compared to other groups (Mensah et al., 2010). Besides, this study employed spatial settings since the coverage of health insurance was spatially clustered across the regions of Tanzania to map, visualize and examine the significant spatial clusters of health insurance uptake in Tanzania. Additionally, the study adopted Generalized Estimating Equation (GEE with logit model) to consider the correlation of the observations within the clusters to determine the important factors affecting the uptake of health insurance (Adisu, et al., 2021).
3. Methods
3.1. Study Design and Sampling Procedures
- This study adopted community-based cross-sectional study design as study analyzed a nationwide population-based cross-sectional survey using information obtained a population 2015 TDHS-MIS. The 2015-16 TDHS-MIS used a two-stage cluster sampling technique to obtain a sample designed to provide nationally representative results according to all thirty regions of Tanzania. In the first stage, sample points (a total of 608 clusters) consisting of enumeration areas delineated for the 2012 Tanzania Population and Housing Census were selected. In the second stage, households were selected systematically. A complete listing of households was established for all 608 selected clusters prior to the fieldwork. From this list, twenty-two households were then systematically selected from each cluster, yielding a representative probability sample of 13376 households. Among them, 3960 households were from urban areas, and 9416 households were from rural areas. For this study individual dataset was used and extracted the outcome and explanatory variables. Latitude and longitude coordinates were also taken from selected enumeration areas (clusters). The detailed sampling procedure was presented in the full TDHS-MIS 2015-2016 report.A representative probability sample of 13376 households was selected for the 2015 TDHS-MIS. Among them, 3960 households were from urban areas, and 9416 households were from rural areas. From 13634 eligible women about 368 who missed potential information were excluded from the study, thus the data was obtained from the individual file containing responses from 13,266 women of reproductive age (15–49 years) with complete observations of all data needed for analysis. To achieve a large sample that is more representative of the target population as well as higher statistical precision. This study decided to use the whole sample size (13266 women) used by the 2015 TDHS.Due to the non-proportional allocation of the sample to the different regions and the possible differences in response rates, this study weighted the data using sampling weight, primary sampling unit and strata to ensure the actual representative of the survey results at the national as well as the domain level.
3.2. Data Type and Source
- This study used secondary data derived from the 2015-16 Tanzania Demographic and Health Survey and Malaria Indicator Survey (TDHS-MIS) conducted by the National Bureau of Statistics and the Office of Chief Government Statistician, Zanzibar, in collaboration with the Ministry of Health, Community Development, Gender, Elderly and Children of the Tanzania Mainland and the Ministry of Health, Zanzibar. The technical support for the surveys was provided by ICF International under DHS programme. The 2015 Tanzania Demographic and Health Survey and Malaria Indicator Survey is the ninth in a series of national sample surveys conducted in Tanzania to measure levels, patterns, and trends in demographic and health indicators (TDHS, 2015).
3.3. Variables
- The dependent (outcome) variable of the study was uptake of health insurance, which is dichotomous in nature. The TDHS has measured this variable in terms of the question: "Are you covered by any health insurance?" And it was coded 1 “If an individual covered by health insurance” 0 “Otherwise”. The independent variables include state, place of residence, age, marital status, education level, wealth index, visits to health facilities, reading newspapers, listening to radio and watching television. The choice of these variables in the study were mainly influenced by their inclusion in TDHS data sets and suggestions derived from previous literature (see, Amul et al., 2021; Ahinkorah, 2022; Aboagye et al., 2022; Aboagye et al., 2023).
3.4. Statistical Analysis
- The uptake of health insurance variable was used throughout for descriptive, bivariate and multivariate analysis. Categorical variables were presented as the number (frequency) and its corresponding percentage. Likewise, the Pearson’s chi-square
 test was used to test an association between categorical variables at
  . ArcGIS version 10.3 was used to visualize the distribution of health insurance coverage across the country. The generalized estimating equation (GEE) logistic regression model was used to assess factors associated with uptake of health insurance using SAS version 9.4, whereby variables with a p-value ≤ 0.05 were declared as significant associated factors of uptake of health insurance. Statistical adjustments were made to get robust standard errors since the sampling procedures in the TDHS involved stratification and clustering (Kulldorff, 2006; Diggle at el., 2020).Geographic visualization using maps is a powerful tool for providing a visual representation of the distribution of health insurance coverage. This form of visualization allows for the exploration and analysis of spatial patterns and disparities in access to health insurance across different regions. The use of maps for geographic visualization of health insurance coverage enhances the understanding of the spatial dynamics of healthcare access. This approach not only aids in identifying areas of concern but also supports evidence-based decision-making, helping to shape more targeted and effective health policy interventions. As technology continues to advance, interactive and dynamic mapping tools further empower stakeholders to explore, analyze, and address issues related to health insurance coverage on a geographical scale.One key advantage of using maps for geographic visualization is the ability to convey complex information in a way that is easy to understand. Moreover, geographic visualization facilitates the representation of geographical clusters or hotspots with high or low health insurance coverage rates identified by SaTScan. This information can be crucial for targeting interventions and policy initiatives to areas where they are most needed.The Bernoulli model was adopted by applying Kulldorff methods using the SaTScan software to analyse the purely spatial clusters of health insurance uptake among women of reproductive age. The Bernoulli model is the statistical model that assesses the probability of an event occurring in different units, such as census tracts or counties. The model was used to analyze binary data such as the presence or absence of an event. In the context of health insurance, individuals or households are often categorized as either covered or not covered. So, the Bernoulli model assesses the probability of an event (having health insurance) occurring in different spatial units. By applying this model, researchers can identify areas where the likelihood of having health insurance significantly deviates from what would be expected by random chance. The Kulldorff method, on the other hand, is a spatial scan statistic used to detect clusters or spatial patterns of events. This method compares the observed number of cases (e.g., individuals with health insurance) within a circular window that systematically moves across the study area against the expected number based on the overall distribution. The method identifies clusters with higher or lower rates than expected, and it calculates statistical significance to determine whether these clusters are likely due to random chance. In this study, the number of cases in each location had Bernoulli distribution whereby women without health insurance were taken as controls (coded “0”) while the others taken as cases (coded “1”) variable to fit the Bernoulli model. A Likelihood ratio test statistic was used to determine whether the number of observed insured cases within the potential cluster was significantly higher than the expected or not, such that the scanning window with the maximum likelihood taken as the most likely high performing clusters. The clusters were identified using p-values and likelihood ratio based on the Monte Carlo (Kulldorff, 2006).Scan statistics are a class of statistical methods used for detecting and locating clusters of events within a given data set. They are particularly useful in fields such as epidemiology, spatial statistics, and quality control. One notable feature of scan statistics is their ability to adapt to the underlying distribution of the data such coverage of health insurance, making them versatile in various applications. One common method often compared with scan statistics is the spatial autocorrelation analysis. Spatial autocorrelation examines the degree of similarity in health insurance uptake among nearby locations. While both methods aim to identify patterns and clusters of health insurance coverage, scan statistics specifically focus on identifying circular or elliptical clusters, making it suitable for these types of spatial patterns.In contrast, kernel density estimation is a non-parametric method commonly used for visualizing the spatial distribution of events. While scan statistics explicitly identify statistically significant clusters, kernel density estimation provides a smooth estimate of the health insurance coverage intensity across the entire study area. This method is not as useful as scan statistics since is mostly used for gaining a comprehensive understanding of spatial patterns without focusing solely on localized clusters. Hence, in this study Scan statistics were deemed powerful for pinpointing specific clusters with high or low health insurance coverage. However, other methods, such as spatial autocorrelation, space-time permutation scan statistics, and kernel density estimation, offer complementary insights and may be more appropriate for certain types of spatial analyses.Generalized Estimating Equation (GEE) is the statistical technique that models clustered binary outcome with set of independents variables while accounting for correlation among the subjects within a cluster (Diggle et al., 2020). In health-related studies, individuals within the same community, household, or other groups may share similarities that can influence the outcome of interest, such as health insurance uptake. The GEE approach allows researchers to model these correlations, providing more accurate estimates of the associations between predictor variables and the likelihood of obtaining health insurance.Unlike standard logistic regression, the GEE logistic regression model provides robust standard error estimates, even in the presence of correlated data. This is particularly important when dealing with observations that are not independent, as failing to account for correlation can lead to inaccurate parameter estimates and overly optimistic assessments of statistical significance. By using GEE, researchers can obtain more reliable and unbiased estimates of the effects of various factors on health insurance uptake.Therefore, this study employed this model since had binary outcome (covered or not covered with health insurance) and the unit of sampling was the household, in which all the eligible women in the sampled households were sampled thus bringing in a cluster of household members who are likely to have similar background characteristics. Thus, the assumption of independence of observations within a cluster did not hold because the subjects share the same cluster. Therefore, for a clustered binary outcome a Generalized Estimating Equation (GEE with logit model) became a candidate model to account for Logit model:
  Hypothesis:
  Where;
 These are all 10 independent variables that are state, place of residence, age, marital status, education level, wealth index, visit to health facility, reading newspaper, listening to radio and watching television.
 These are coefficients of logistic regression that explain the magnitude of association between dependent variable and independent variables.
 It is the chance of women to uptake the health insurance.
4. Results and Discussion
4.1. Descriptive Analysis
- Only 8.13% of the surveyed women were covered by health insurance as shown in figure 1. In Tanzania Mainland, the proportion of women (9.17%) covered by health insurance were found to be higher compared to that of women from Zanzibar (2.71%).
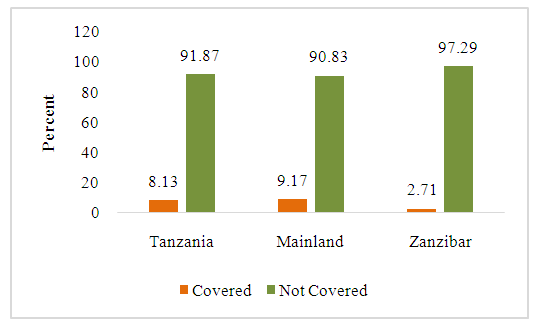 | Figure 1. Prevalence of Health Insurance Coverage among Women aged 15-49 in Tanzania, 2015/2016 TDHS-MIS |
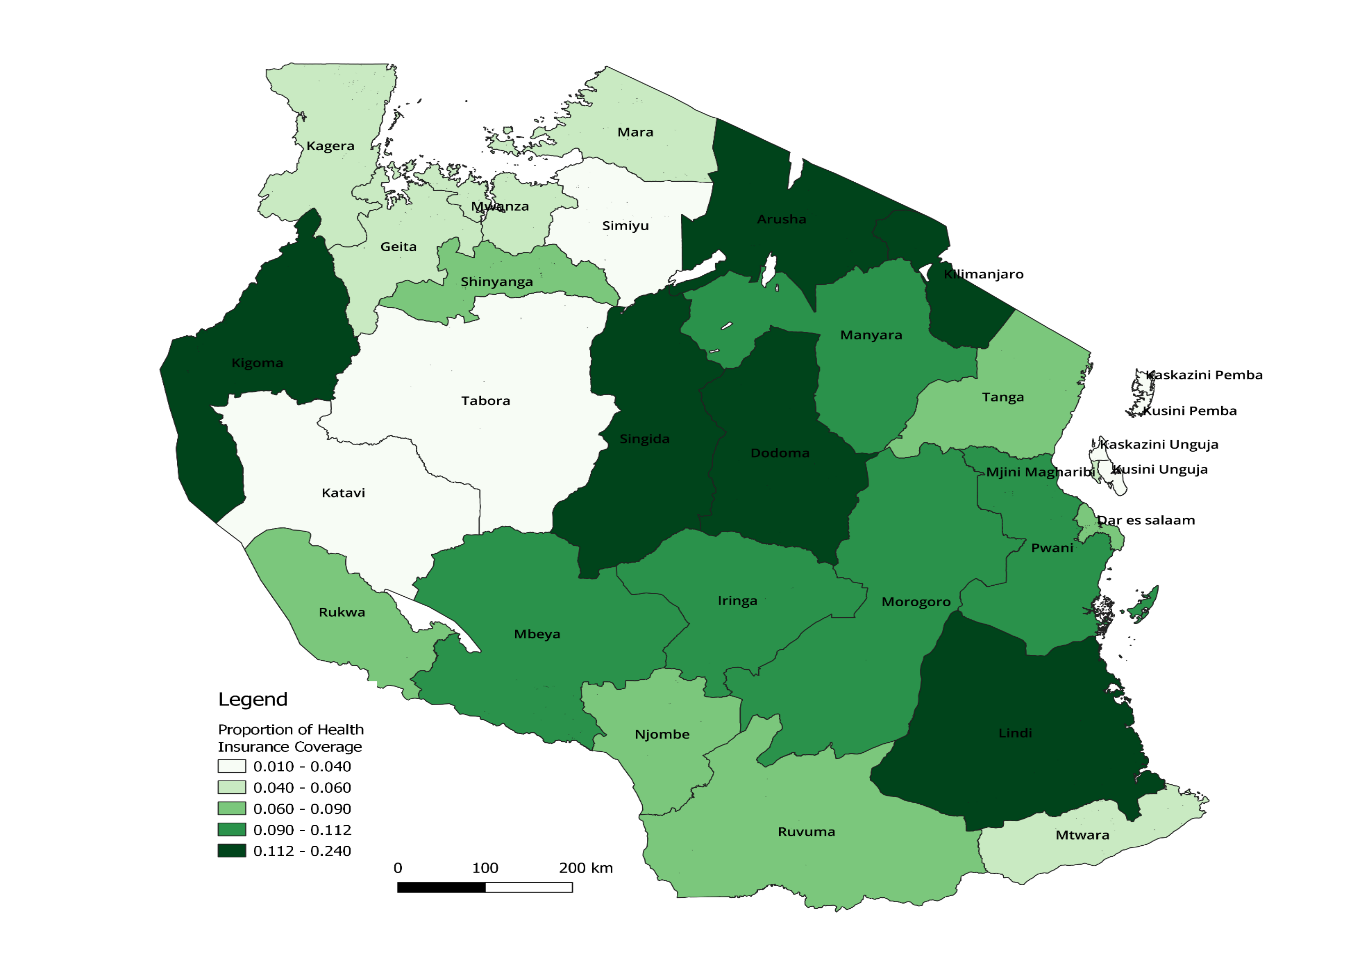 | Figure 2. Proportion of Health Insurance Coverage by Region of Residence among Reproductive Age Women Based on the 2015/2016 TDHS-MIS |
4.2. Bivariate Analysis
- Table 1 displays the result of the bi-variate analysis. The result showed significant association between all explanatory variables and women’s health insurance coverage in Urban Tanzania. In Rural Tanzania, all the underlying characteristics except women’s marital status (p=0.0509) were significantly associated with women’s health insurance coverage. Health insurance coverage among women living in both Urban (11.01%) and Rural (8.28%) Tanzania Mainland was significantly higher (p<0.0001) as compared to women living in Urban and Rural Zanzibar (5.94% and 1.63% respectively). Similarly, majority of women belonging to the richest wealth category were covered by health insurance regardless of the place of residence.
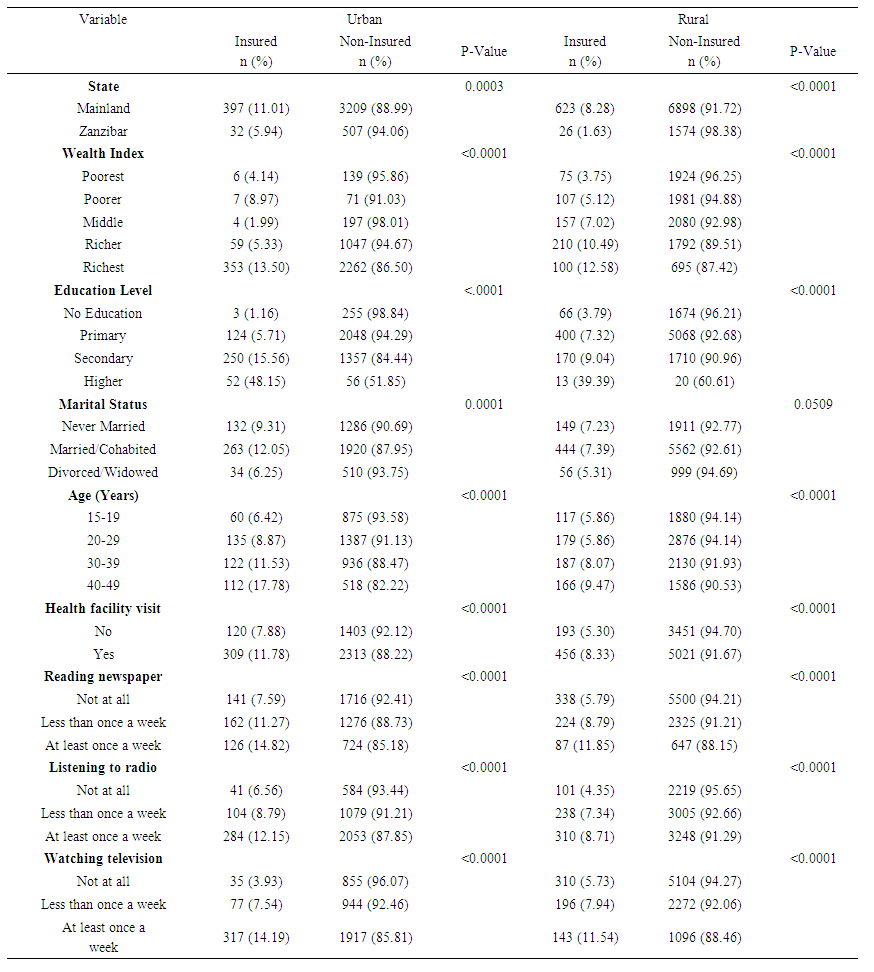 | Table 1. Distribution of Health Insurance Coverage among Women of Reproductive age by Baseline Characteristics and Place of Residence, 2015/2016 TDHS-MIS |
4.3. Univariate and Multivariate Analysis
- The results of univariate GEE analysis for pooled sample presented in table 2 reported that, all explanatory variables were significantly associated with the uptake of health insurance among women of reproductive age in Tanzania. However, the results of multivariate GEE analysis revealed that, reading newspaper and listening to radio had insignificant (p > 0.05) relationship with the uptake of health insurance. Women from Tanzania Mainland were 10.65 times more odds of purchasing health insurance compared to those coming from Zanzibar (AOR=10.65, 95% CI: 7.52-15.08). Women living in urban settings were significantly more prevalent of purchasing health insurance than their rural counterparts (AOR=1.45, 95% CI: 1.36, 1.55). The chance of being covered by health insurance among women of reproductive age was positively associated with the family wealth index.
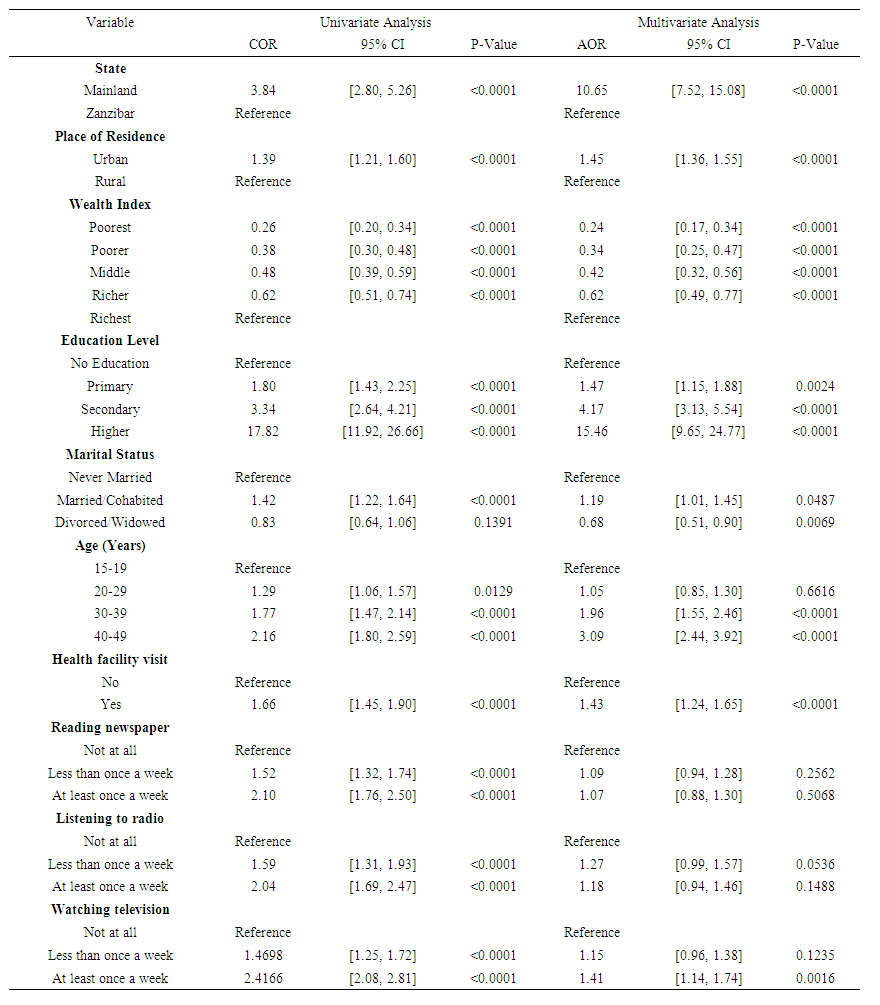 | Table 2. Crude and Adjusted Odds Ratios of Health Insurance Coverage among Women of Reproductive age in Tanzania (Pooled Sample), 2015/2016 TDHS-MIS |
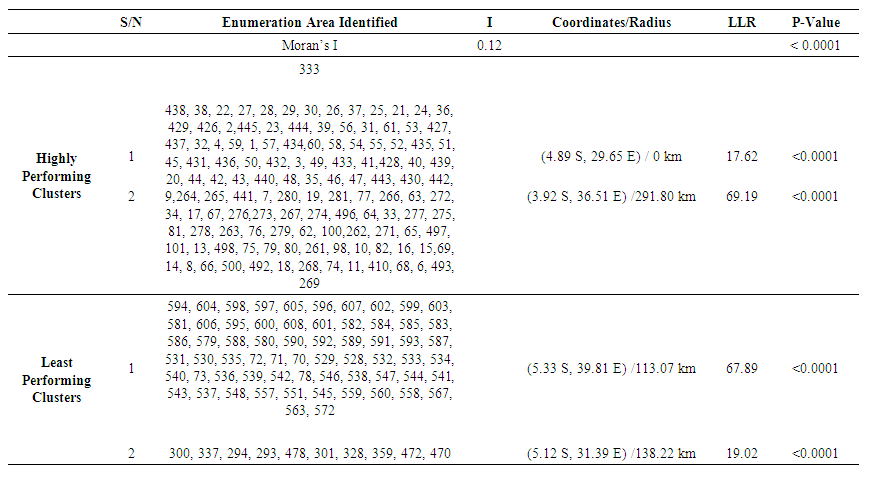 | Table 3. Significant spatial clusters with a high and low rate of health insurance coverage among women of reproductive age in Tanzania, 2015 TDHS-MIS |
4.4. Comparison of the Models
- In examining the effect of socio-demographic, economic and health related factors associated with uptake of health insurance, three distinct models were checked for goodness of fit, each characterized by its own procedure and information criteria, including AIC (Akaike Information Criterion), AICC (Corrected Akaike Information Criterion), and BIC (Bayesian Information Criterion) as shown in table 4. These criteria are commonly used for model selection, with lower values indicating better-fitting models. The models under consideration were the Ordinary Logit Model, Mixed Effect Model, and GEE Logit Model.
|

4.5. Discussion
- In Tanzania, access to healthcare services, including health insurance coverage among women of reproductive age, has been a significant concern and is a key approach to attain UHC. The UHC is based on the 1948 WHO Constitution, which upholds that everyone has the right to the best possible health (Kozhimannil et al., 2012). In this study we examined the spatial modeling and its associated factors of health insurance uptake among women of reproductive age in Tanzania. Data was drawn from Tanzania Demographic and Health Survey and Malaria Indicator Survey (2015 TDHS-MIS). The study revealed positive significant clustering (spatial patterns) of uptake of health insurance across the country, whereby neighboring regions were observed to influence each other toward the uptake of health insurance. This might be due to the availability of insurance providers and agents within a region where better to healthcare services are readily available. Regional differences in socioeconomic level may also have an influence on health insurance affordability and perceived need. Higher uptake rates could be attributed to better financial capabilities in wealthier regions. This finding was consistent with study conducted by Sewnet et al. (2020) in Ethiopia and Kumi-Kyereme and Amo-Adjei, (2013) who found a significant difference in health insurance coverage among women of reproductive age by spatial location in Ghana. In this study, we noticed that the uppermost level of health insurance uptake was recorded in Tanzania Mainland rather than in Zanzibar regions. This probably could be due to economic disparities in which Tanzania Mainland has a larger and more diverse economy compared to the Zanzibar regions making it feasible for individuals to afford health insurance premiums. The other reason could be urbanization in which the access to tertiary-level care and premium payment methods across the Tanzania Mainland regions is high. This escalates the convenience of health insurance facilities (Yilma et al., 2015; Amu et al., 2021). Consistent with previous studies (see for example, Sewnet et al., 2020; Amu et al., 2021; Adisu et al., 2021), the current study showed that reproductive-age women in urban areas had a higher likelihood of being covered by health insurance than those living in rural settings. The reason for this might be due to economic challenges hence residents might prioritize other essential needs over health insurance. Also, women from rural settings could be lacking education campaigns about the importance of health insurance, as well as lack of health insurance system which is mostly concentrated in urban areas thus led them to have a lower chance of being covered by health insurance.Despite health insurance systems aimed to help ease the financial liability of the poorest homes, the result of this study revealed that the probability of health insurance coverage was higher among the richest women. This finding is similar to previous studies (Kumi-Kyereme and Amo-Adjei, 2013; Lutinah, 2020) on determinants of health insurance coverage. This could be due to financial capacity such that richest women are less likely to face financial barriers that can hinder access to healthcare services. Furthermore, wealthier individuals may have a greater aversion to financial risk. They may be more willing to invest in health insurance as a means of protecting themselves and their families. Other reason might be preventive healthcare practices in which the richest women might be more inclined to invest in preventive healthcare measures, including regular check-ups and screenings. This proactive approach to health may make them more likely to seek and maintain health insurance coverage.The results are similar with prior studies (Hubert and Kwamena, 2016; Adisu et al., 2021; Amu et al., 2021) the recent study disclosed that the chance of being covered by health insurance was highest among educated women as matched with women with no education. The possible reason could be educated women are familiar with and have more information about the benefits of health insurance and hence make informed choices and decisions, involve themselves in diverse knowledge enrichment activities like reading materials, give more concern for their health and assure themselves against the unanticipated out-of-pocket payments. Moreover, education can lead to higher earning potential and financial literacy hence educated women may be more adept at managing their finances, including budgeting for health insurance premiums. Other conceivable reason is employment opportunity whereby educated women may be more likely to work in formal employment settings where health insurance is provided as part of the compensation package.Our study findings revealed that being married was associated with the uptake of health insurance compared to never been married and widowed or divorced. This recommends that having a spouse/partner is advantageous probably because of the financial backing consequential from being in a dual-income home, which transforms into more chances for accessing health insurance coverage. This is in line with previous studies (Boateng and Vitor, 2013; Kimani et al., 2014) who found that married women are more prevalent to purchase health insurance compared to their counterparts. The study results revealed maternal age as an important predictor of health insurance coverage among reproductive age women in Tanzania. Comparatively older women exhibited greater propensity to purchase health insurance in contrast to their younger counterparts. This aligns with previous studies which also established a direct association between motherly age and uptake of health insurance (Adisu et al., 2021, Amu et al., 2021; Aboagye et al., 2023). This could be justified that as maternal age increases, their health status weakens. As a result, the need for healthcare use increases just to refrain from financial tragedies linked with health complications. Moreover, older women tend to have more established financial stability due to family responsibilities like caring for children or elderly family members. They might have consistent income streams and savings, which helps them understand the long-term advantages of health insurance in protecting their family's health and wellbeing.Besides, this study identified a strong association between health facility visits and uptake of health insurance. The findings indicated that women who visited health facilities had a higher possibility of purchasing health insurance coverage than women who did not. This finding is in line with the study done in East Africa (Adisu et al., 2021). This is because, women who visit health facilities may have a greater perceived need for health insurance, as they are actively seeking out and utilizing healthcare services. This suggests that first hand experiences with healthcare can serve as a catalyst for recognizing the value of insurance coverage in managing healthcare costs and accessing necessary medical services.Our results revealed a significant association between mass media exposure and uptake of health insurance. We found lower likelihoods of health insurance coverage among mothers who were not exposed to mass media (newspapers, radio, and television), compared to those who use mass media frequently. This finding is congruent with findings of previous studies that reported a significant association between mass media exposure and health insurance coverage (Kimani et al., 2014; Amu et al., 2021; Amu et al., 2021; Sewnet etal., 2021). A plausible explanation for these findings is that mothers who have regular access to information via mass media might have a higher likelihood of being exposed to educational content, advertisements, or public service announcements on health-related issues, such as health insurance. This exposure increases their awareness and understanding of the importance of having health insurance coverage.
5. Conclusions and Policy Recommendations
- This study revealed that, only 8.13 percent of Tanzanian women were covered by health insurance leaving more than 90% of women not involved in the health insurance schemes. It was observed that the health insurance was spatially clustered across the country whereby women from Tanzania Mainland regions had higher rate of health insurance coverage as compared to women from Zanzibar. Place of residence, wealth index, education level, marital status, age, frequency of health facility visits and watching television were found to be important predictors of uptake of health insurance among women of reproductive age in Tanzania. With the URT, health stakeholders and partners commitment to achieve universal health coverage and reduce maternal mortality, the priority should be given to the clusters with low health insurance coverage in order to reinforce health system funding and act on factors causing low coverage health insurance. This will drive growth in health care utilization and eventually better health outcomes. Likewise, Stakeholders should act on factors that reduce the chance of health insurance uptake by taking coherent and harmonized actions such as strengthening financial fortification through national health packages, sharing the experience with the regions having higher health insurance coverage, and increasing awareness and confidence of potential in the systems, which may encourage them to join. Further, government premium subsidization should be put in place to ensure affordability in purchasing health insurance from the lowest wealth group families.