Ibrahim H. Ibrahim, Ghada Taha, Mahmoud Sadek
Department of Mathematics, Insurance, and Applied Statistic, Helwan University, Cairo, Egypt
Correspondence to: Ghada Taha, Department of Mathematics, Insurance, and Applied Statistic, Helwan University, Cairo, Egypt.
| Email: |  |
Copyright © 2023 The Author(s). Published by Scientific & Academic Publishing.
This work is licensed under the Creative Commons Attribution International License (CC BY).
http://creativecommons.org/licenses/by/4.0/

Abstract
The Behrens-Fisher (B-F) problem is the problem of testing equality of two population means using two independent samples when the quotient of the population variances is unknown. Ibrahim et al. (2023) introduced two modified tests that are based on the method that was provided by Chen et al. (2022). In this paper, a new modified test is proposed which depends on Fisher’s fiducial argument to estimate the variances of the sample means. A comprehensive simulation study is designed for balanced and unbalanced samples with different sizes and various ranges of variances. The simulation study shows that the power of the suggested modified test is outperform Welch test and the two tests of Ibrahim et al. (2023) especially, for large sample sizes and wide range of variances of two independent samples with balanced or unbalanced sample sizes.
Keywords:
Balanced data, Behrens-Fisher problem, Fisher’s fiducial argument, New modified test, Two modified tests, Unbalanced data, Welch test
Cite this paper: Ibrahim H. Ibrahim, Ghada Taha, Mahmoud Sadek, New Modified Test for Behrens-Fisher Problem, American Journal of Mathematics and Statistics, Vol. 13 No. 2, 2023, pp. 76-83. doi: 10.5923/j.ajms.20231302.02.
1. Introduction
The Behrens-Fisher (B-F) problem is the problem of testing the hypothesis of equality of the means of two normal populations using two independent samples when the population variances are unknown or with possibly unequal variances [18] [8] [3] [1]. Several solutions have been developed and these solutions are divided into parametric solutions and non-parametric solutions. Behrens (1929) introduced a parametric test that was the first parametric solution of B-F problem and confirmed by Fisher (1939) but the estimated type Ι error of this test is frequently smaller than the nominal level [10] [8] [3] [1]. Many solutions proposed for B-F problem, such as the Welch test as an approximation solution that introduced by Welch (1938). Welch approximation is the popular approximation solution for the B-F problem. Also, several approximation solutions have been proposed, such as Cochran Approximation (1964), Fenstad (1983), Wald test, which proposed by Best and Rayner (1987) [18] [6] [5] [3]. The latest parametric solutions have been proposed by Ibrahim et al. (2023), Chen et al. (2022), and Hong et al. (2022). In this study, we propose new modified test using the same technique used in [10] by making modifications to the assumed value of the random variable, as shown in section 3.The new test is based on Fisher’s fiducial argument to estimate the variances of the sample means, as the method that was suggested by Chen et al. (2022). This study aims to compare a new modified test with Welch test, which is widely used to deal with the B-F problem, and two tests that were introduced in [10]. This comparison was made by using a comprehensive Monte Carlo simulation with different scenarios and factors to assess the size and the power of these tests. This simulation study consists of three factors: (i) sample sizes (ii) balanced or unbalanced data, (iii) various wide ranges of populations’ variances values to assess the impact of the gap between population variances. This study proceeds as follow: Section 2 introduces available solutions to the B-F problem. Then, Section 3 presents the suggested solutions. Section 4 demonstrates the simulation study. Finally, Section 5 shows the conclusion of the study.
2. Available Solutions to the B-F Problem
Many solutions have been introduced to the B-F problem. These solutions can be classified into exact and approximated solutions. In this paper, we focused on the approximation solutions. These solutions, such as (i) the Welch test (T1), (ii) the two tests that have been introduced by Ibrahim et al. (2023) (T2 and T3).For testing the equality between two normal populations means when the variances are unknown or unequal based on two independent samples: the first sample  from
from  and
and  from
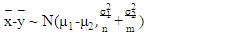
from  where
where  and k =1, 2. The null and alternative hypotheses are:
 Initially, we define some statistics as:
 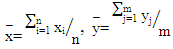 | (1) |
 | (2) |
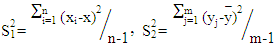
Where  are the sample mean and sample variance for the first sample and
  are the sample mean and sample variance for the second sample respectively, So that:
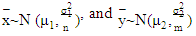 | (3) |
 | (4) |
Therefore 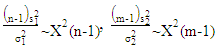 | (5) |
Where,  is the chi-square distribution with k degrees of freedom. Then,
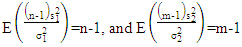 | (6) |
Therefore,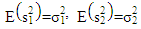 | (7) |
Where,  are the unbiased estimators for
  respectively.i) Welch test (T1): This is a popular test of B-F problem, which proposed by Welch (1938). This test is considered as the standard solution to testing the equality between two population means from an independent normal population with unequal variances [6] [4] [3]. The Welch statistic T1:
 | (8) |
Where,  approximated by t-distribution with degrees of freedom
  as:
as: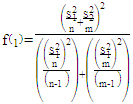 | (9) |
ii) Two tests of Ibrahim et al. (2023) (T2 and T3):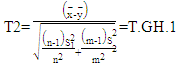 | (10) |
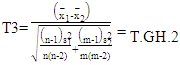 | (11) |
Where,  approximated to t-distribution with degrees of freedom
 and constant
 respectively. The degrees of freedom are:
 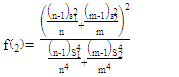 | (12) |
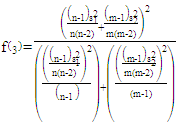 | (13) |
The constants are: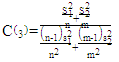 | (14) |
 | (15) |
3. Suggested Solution to the B-F Problem
In this paper, we suggest a new modified test as an alternative to t-test when the B-F problem occurs. This test is based on the method that was proposed by Chen et al. (2022) with some modifications which depends on Fisher’s fiducial argument to estimate the variances of the sample means. The test statistic, degrees of freedom, and constant could be derived as follows:Let T be the test statistic: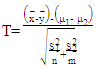 | (16) |
 | (17) |
When  is true, the test statistic can be rewritten as:
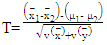
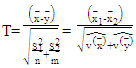 | (18) |
This test statistic could be approximated by the student t-distribution as a Welch approximation. Where:  To get the values of the test statistic, we need to get:
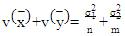 | (19) |
Where,  is often unknown when the B-F problem occurs, we can use the variance estimate
  instead of
  Then, equation (19) can be written as:
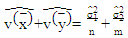 | (20) |
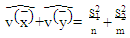
We can estimate  by using the following relationships [4]:
 Let:
Let: 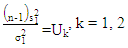 | (21) |
Where,  is a random variable that follows a chi-square distribution with k degrees of freedom.Therefore:
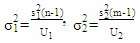 | (22) |
To estimate  let some values for
  to get the values of
  corresponding to them. Various values for
  will lead to various values of
  As shown in [10], we can get the degrees if freedom f and constant c as the following formulas:
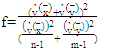 | (23) |
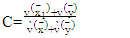 | (24) |
 | (25) |
Where  are the values of the variances for the first sample mean and second sample means, respectively.
 are the values of variances for the first sample mean and second sample mean which were used by Behrens and Fisher before, respectively. In [10], Chen et al. (2022)
  is replaced by (n-3), which is the maximum value of the probability density function. If we use the same method to estimate the variances at
  we will get the Welch statistic. Where, (n-1) is the mean of the chi-square distribution. If we replace
  with (n-)
  as it has been shown in [10]. Also, we can get
  when we replace
  by (n-2). Thus, in this paper, we proposed a new test statistic by replacing
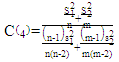
  by (n-4) and follow the same method to estimated variances as follows:Assuming that
 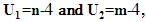 In this case, we can get the estimated variances by replacing the variables
  with
with  respectively. Therefore, we can reformulate equation (22) as:
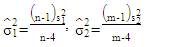 | (26) |
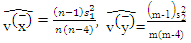 | (27) |
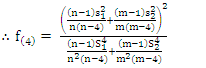
Then, we can use  in equation (18) to get the test statistic T4 as:
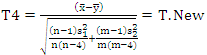 | (28) |
We can approximate this test statistic T4 to t-distribution with  degrees of freedom and constant
  as:
as: | (29) |
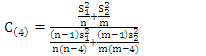
And we can get  and
and  by using the formulas in equations (23) and (24), respectively as the following:
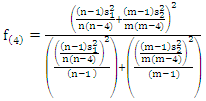 | (30) |
 | (31) |
 | (32) |
4. Simulation Study
The simulation studies were designed to compare four tests (T1- T.GH.1- T.GH.2- T.New) by using the Monte Carlo method and applying these simulations on R- package as shown in the following steps:1- The data for samples were generated randomly from the normal populations at various configurations of the factors (μ1, μ2, n, m, Var(1), Var(2)). 2- For each simulation, the sample means  were estimated.3- For each simulation, the variances were estimated
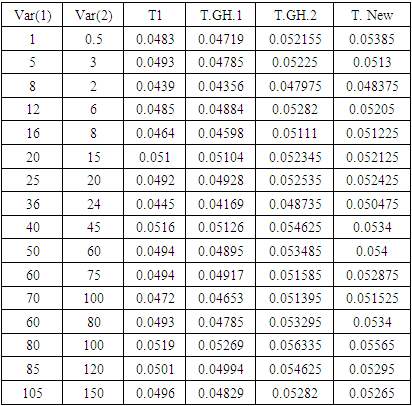
  4- The test statistics were calculated for the four tests (T1 - T.GH.1- T.GH.2- T.New). 5- The probability of Type-I error or (size of the test) was calculated for the four tests (T1 - T.GH.1- T.GH.2- T.New). 6- The power of the test were calculated for the four tests (T1 - T.GH.1- T.GH.2- T.New).A comparative study was designed to evaluate the performance of the four tests: (1) (Welch test (T1), (2) The first proposed test in [10] is represented by (T2 or T.GH.1).(3) The second proposed test in [10] is represented by (T3 or T.GH.2).(4) The new suggested test in this paper (T.New).These simulation studies were based on three factors: (i) sample sizes (ii) balanced or unbalanced data, (iii) various wide ranges of populations’ variances values to assess the impact of the gap between population variances. The simulation studies were conducted on different scenarios to compare the probability of Type-I error or size and power of each test under various configurations. These studies are conducted on samples generated from the normal populations with different means and different variances in two scenarios:Case 1: Balanced data.Case 2: Unbalanced data.These simulation studies were based on 10000 generated samples at a significance level α = 0.05, the samples generated from the normal distribution at μ = 2 and different variances. Where Var(1) and Var(2) are the variances of the first and second population, respectively. The estimated Type-I error probabilities for the four tests (T1 - T.GH.1- T.GH.2- T.New) for balanced samples at (n, 𝑚 = 20, 50, and 100) are shown in tables (1, 2, and 3).
Table 1. The Probability of Type-I Error for The Four Tests (T1 - T.GH.1- T.GH.2- T.New) Under Different Variances, μk = 2 and n = m = 20
 |
| |
|
Table 2. The Probability of Type-I Error for The Four Tests (T1 - T.GH.1- T.GH.2- T.New) Under Different Variances, μk = 2 and n =m = 50
 |
| |
|
Table 3. The Probability of Type-I Error for The Four Tests (T1 - T.GH.1- T.GH.2- T.New) Under Different Variances, μk = 2 and n= m = 100
 |
| |
|
As we showed in the previous table, the probability of Type-I error for Welch test (T1) is closer to the significance level 5% than other tests (T.New (T4), T.GH.2 (T3)). Also, these tests are acceptable sizes in all configurations at 5%. But, the probability of Type-I error for T.GH.1 (T2) is far from 5% compared with other tests.By increasing the sample sizes to 50 and 100, as we showed in tables 2 and 3, the probability of Type-I error for all tests is acceptable. The estimated Type-I error for Welch test is the closest to the significance level 5%. The estimated Type-I error probabilities (transformed by log10) for the four tests (T1 - T.GH.1- T.GH.2- T. New) in Tables (1, 2 and 3) can be represented graphically in Figure 1. In Figures 1,` and 3 as we can see two vertical lines and different symbols. These two lines, represent the solid and broken lines equivalent to 0.05 and 0.06, respectively. The different symbols represent the different sample sizes (n, 𝑚 = 20, 50 and 100) as shown in Figures 1, 2, 3, and 4.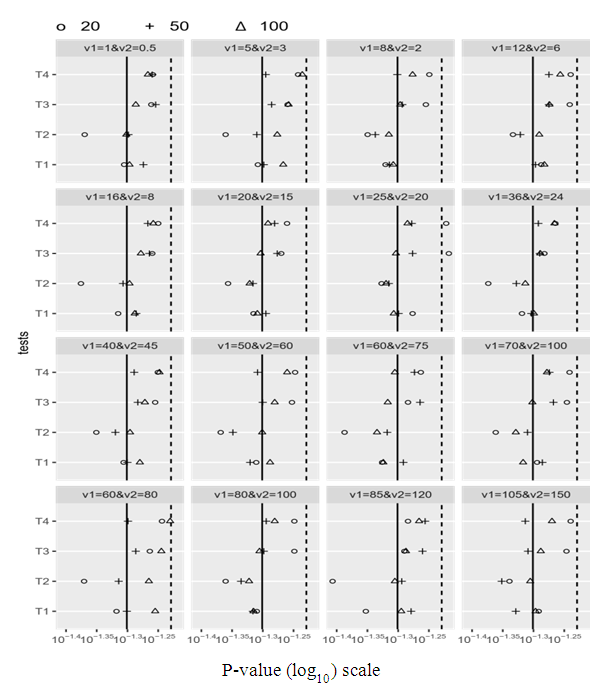 | Figure 1. The estimated probabilities of Type-I error for the four tests |
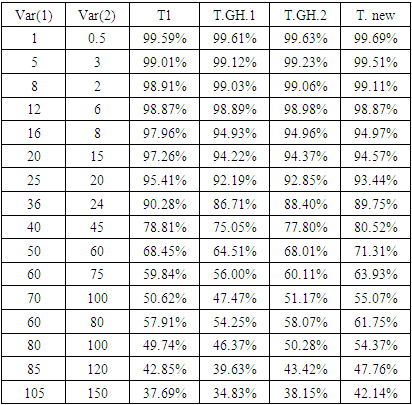
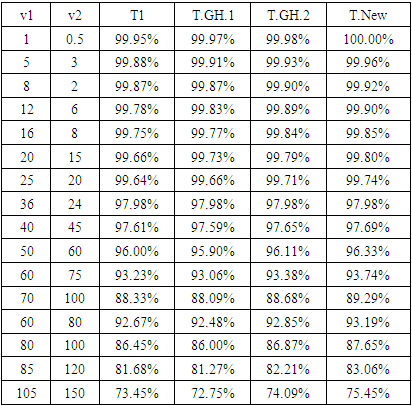
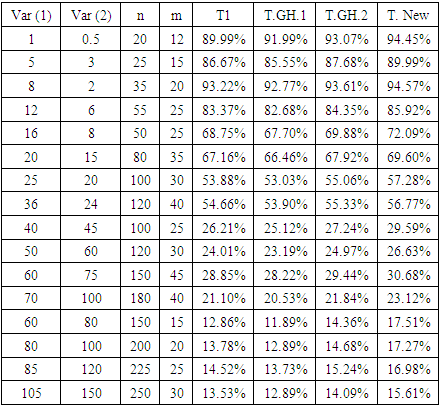
As we will show in Figure 1, the probability of Type-I error for tests T1 (Welch test), T. GH.2, and (T.New) is closed to a nominal probability of 0.05 in all combinations (acceptable size). But the probably of Type-I error for test T.GH.1 is far from the significance level 5% when the sample sizes are small and become close to 5% when the sample sizes are increasing. But the size of this test becomes closer to 0.05 when the sample size and the value of variances are increasing. The results of the power of the test for the four tests (T1 - T.GH.1- T.GH.2- T.New) can be seen in Tables (4, 5, and 6). These powers were calculated for balanced data that were generated at (μ1= 2, μ2 = 8) under different variances. Table 4. The Power of the Test for the Four Tests (T1 - T.GH.1- T.GH.2- T. New) Under Different Variances, μ1 = 2, μ2 = 8 and n=m=20
 |
| |
|
Table 5. The Power of the Test for the Four Tests (T1 - T.GH.1- T.GH.2- T.New) Under Different Variances, μ1 = 2, μ2 = 8 and n= m= 50
 |
| |
|
Table 6. The Power of the Test for the Four Tests (T1 - T.GH.1- T.GH.2- T.New) Under Different Variances, μ1 = 2, μ2 = 8 and n=m= 100
 |
| |
|
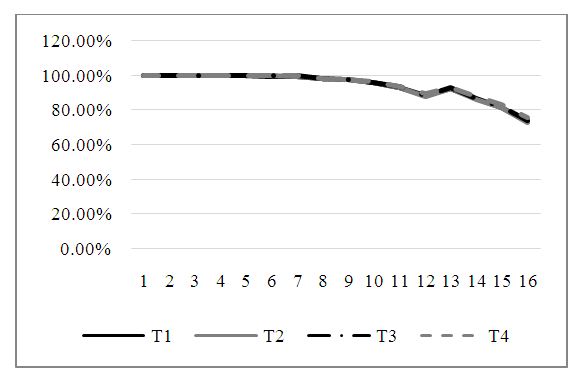
We can represent the results in Tables (4, 5, and 6) graphically, as we shown in Figure 2.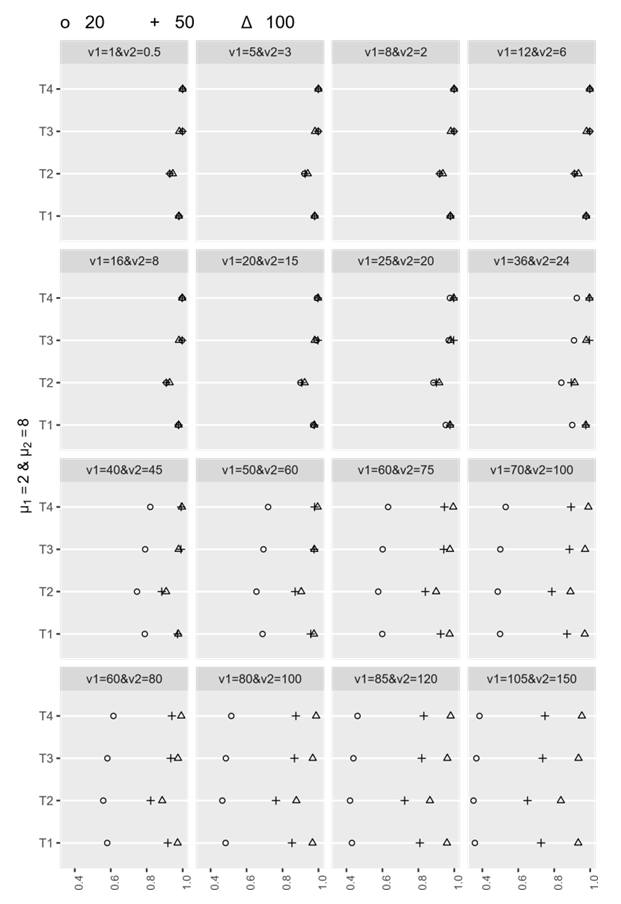 | Figure 2. The estimated power of the four tests |
The power of the test for test T4 (T.New) is the best in all cases, reaching to 100% when the sample sizes are large (n, m >30) and variances are small. The power for test T3 (T. GH.2) is better than the power for T1 (Welch test) in most cases, regardless of the variance values at the large sample size. Also, the power for test T3 (T. GH.2) is better than the power for T1 (Welch test) in most cases. Generally, the power of the test for the four tests is decreasing with increasing the values of the variances and gap between the variance values.In Figures (3, 4, and 5) the values of the power for the four tests in Tables (4, 5 and 6) can be represented graphically in the simplified graphs to give an overview of opinion about the estimated power of the tests when the data is balanced. 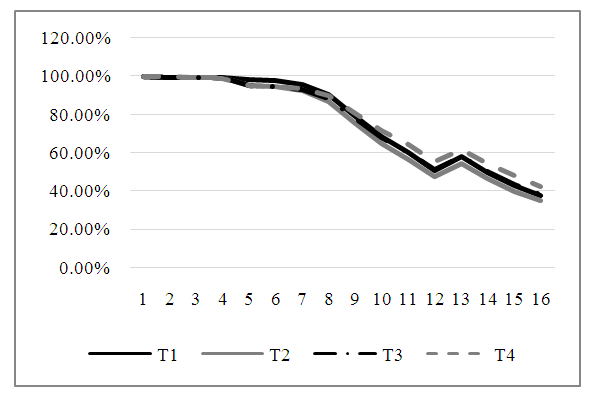 | Figure 3. The estimated power of the four tests |
 | Figure 4. The estimated power of the four tests |
 | Figure 5. The estimated power of the four tests |
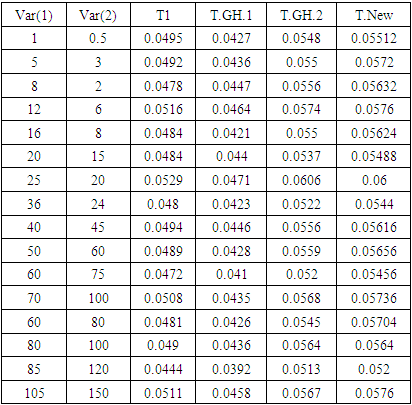
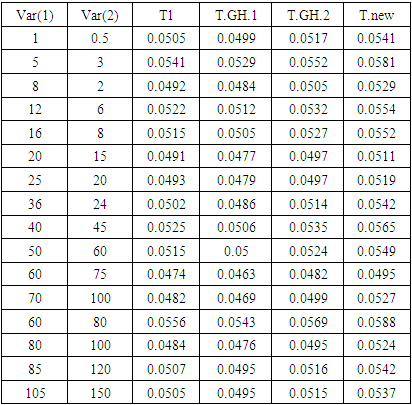
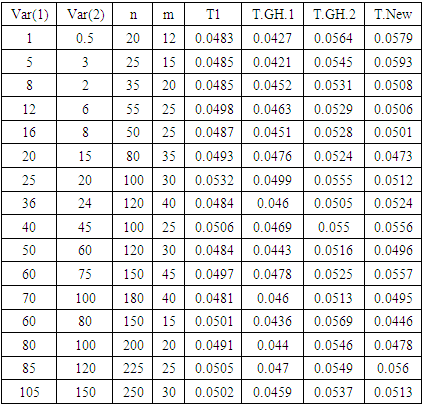
As we can see in Figures (3, and 4) the power of the test for tests T1 (Welch test), T2 (T.GH.1), T3 (T.GH.2), and T4 (T.New) is very close in most cases because the difference between them is small. In Figure. 5, the power of the test for T4 (T. New) is the best. Also, the power of the test for T1 is better than other tests (T2 (T.GH.1), T3 (T.GH.2)). In Table 7, the estimated Type-I error probabilities for the four tests (T1 - T.GH.1- T.GH.2- T.New) can be shown when the sample sizes are unbalanced data at a significance level α = 0.05, and μk = 2 under different variances. Table 7. The Probability of Type-I Error for The Four Tests (T1 - T.GH.1- T.GH.2- T.New) Under Different Variances, Different Sample Sizes (Unbalanced Data) and μk = 2
 |
| |
|
In Figure 6, the estimated Type-I error probabilities in Table 7. after transformed by log10 for the four tests (T1 - T.GH.1- T.GH.2- T.New) can be represented graphically for unbalanced data at μk = 2 under different variances. 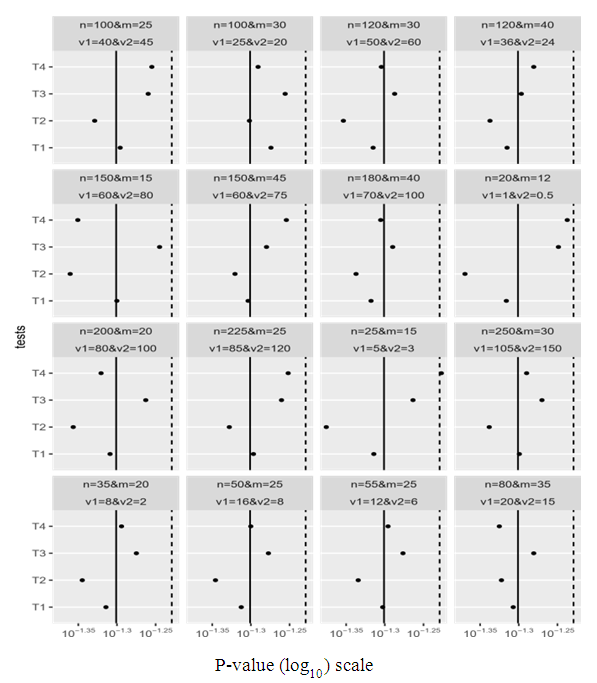 | Figure 6. The estimated probabilities of Type-I error for the four tests |
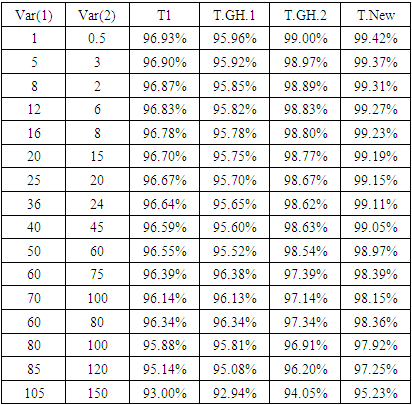
Figure 6 shows that the estimated Type-I error probabilities for the test T2 is far from the significance level 5% especially when the sample sizes and variances are small, and become closer to this significance level when both sample sizes and variances are increasing. Also, this figure showed that the estimated Type-I error probabilities for other tests are acceptable.Also, in Table 8 the power of the four tests can be shown when the sample sizes are unbalanced at (μ1 = 2, μ2 = 8) under different variances.Table 8. The Power of the Test for the Four Tests (T1 - T.GH.1- T.GH.2- T.New) Under Different Variances, Different Sample Sizes and (μ1 = 2, μ2 = 8)
 |
| |
|
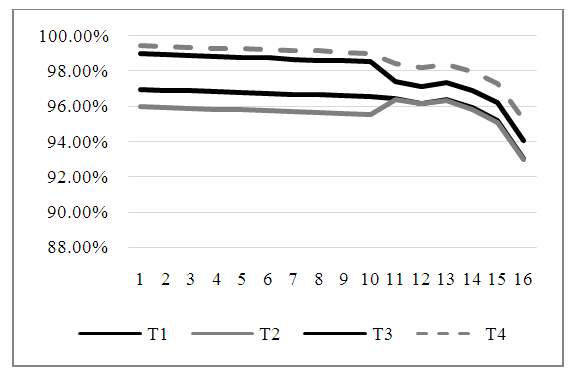
Figure 7 shows the power of the test of the four tests obtained in Table 8. This figure shows that the power of T.New is the best. Also, we can conclude that the power of the test of T3 (T.GH.2) is better than the power of the test of T1 (Welch test) in all cases. When the variances increase, the power of all tests will decrease for unbalanced data.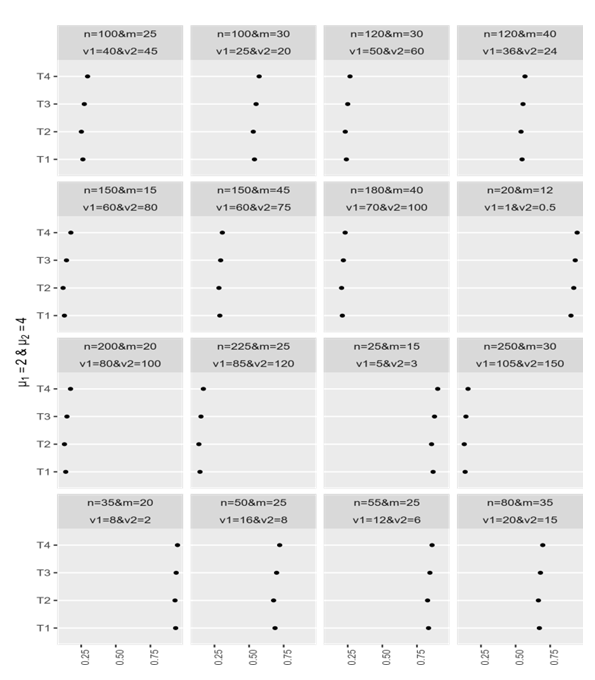 | Figure 7. The estimated power of the four tests |
In Figure 8, the power of the test of the four tests (T1, T2, T3 and T4) that are shown in Table 8 can be represented graphically for unbalanced data. 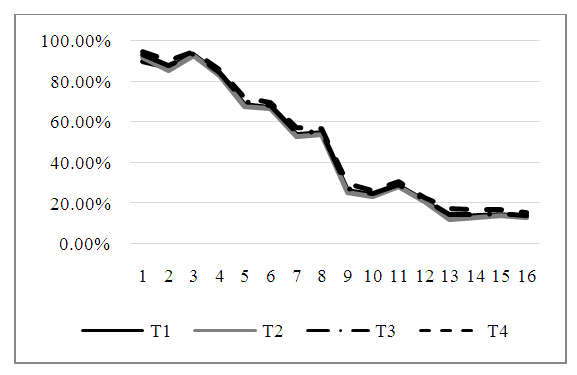 | Figure 8. The estimated power of the four tests |
Figure 8 shows that the new modified test (T.New) is outperform other compared tests for the estimated power of the test.
5. Summary and Conclusions
In this paper, we suggested a new modified test (T.New) as an alternative for t-test when the homogeneity assumption is violated. This new modified test is based on the method that was proposed by Chen et al. (2022) with some modifications which depends on Fisher’s fiducial argument to estimate the variances of the sample means. The degrees of freedom (f ) and the constant (C) for the new modified test are derived to approximate the new modified test statistic to t- distribution as shown in Welch approximation. A comprehensive simulation study with different factors and scenarios has been conducted to evaluate the performance of the new modified test comparing with Welch test and the two other tests that have been introduced by Ibrahim et al. (2023). This comparison was based on the size of the tests and the power of the tests. The main statistical findings can be summarized in the following:1) The probability of Type-I error probabilities for tests T1 (Welch test), T.GH.2, and T.new (the new suggested test) are acceptable when the data is balanced and small sample sizes at μ = 2 with different variances.2) The probability of Type-I error for all tests is acceptable when increasing the sample sizes to 50 and the data are balanced at μ = 2 and variances different. 3) In most cases, the power of the test for the new suggested test T4 is the best when the data is balanced at μ = 2 under different variances.4) In most cases, the power for test T3 (T. GH.2) is better than the power for T1 (Welch test) for the balanced data at μ = 2 under different variances.5) Generally, the power of the test for the four tests is very close in most cases, as previously shown in Figures 3 and 4. These powers are decreasing when increasing the values of variances and gap between the values of variances for the balanced sample sizes.6) When the data is unbalanced, the estimated Type-I error probabilities for test T2 are far from the significance level 5% for the small sample sizes and variances.7) By increasing the sample sizes and variances, the estimated Type-I error probabilities for test T2 become closer to this significance level 5%. 8) When the data is unbalanced, the estimated Type-I error probabilities for tests (T1, T3, and T4) are acceptable.9) The power of the test for T4 (T.New) is the best for unbalanced data in all cases studied.10) Also, the power of the test for T3 (T.GH.2) is better than the power of the test for T1 (Welch test) in all cases studied. 11) When the variances increase, the power of all tests will decrease for the unbalanced data.Finally, we conclude that the suggested test T4 (T.New) has the best power when compared to the other tests and can be recommended to use as an alternative test for t-test when the homogeneity assumption is violated.
References
| [1] | Aoki, S. "Effect Sizes of the Differences between Means without Assuming Variance Quality and between a Mean and a Constant." Heliyon 6 (2020). |
| [2] | Behrens, W V. "Ein Beitrag Zur Fehlerberechung beiwenigen Beobachtungen." Landwirtsch. (Jahrbucher) 68 (1929): 807-837. |
| [3] | Best, D. J., and J. C. Rayner. " Welch's Approximate Solution for the Behrens-grimes Problem." Technometrics 29 (1987): 205-2010. |
| [4] | Chen, CH., Yilin Li, K. Liang, and J. Du. "A Test for the Behrens-Fisher Problem Based on the Method of Variance Estimates Recovery." Communication in Statistic- Theory Methods 51 (2022). |
| [5] | Cochran, W. G. "Approximation Significance Levels of the Behrens-Fisher Test." Biometrics 20 (1964): 191-195. |
| [6] | Fenstad, G. U. "A Comparison between U and V Tests in the Behrens-Fisher Problem." Biometrika 70 (1983): 300-302. |
| [7] | Fisher, R. A. "The Comparison of Samples with Possibly Unequal Variances." Annals of Eugenics 9 (1939): 174-180. |
| [8] | Grimes, B. A., and W. T. Federer. "Comparison of Means from Populations with Unequal Variances." (Biometrics Unit Series, Cornell University, Ithaca, new york) 1982. |
| [9] | Hong, s., A. Gelhoc, and J. Park. "An Exact and Near-Exact Distribution Approach to the Behrens–Fisher Problem." Mathematics 10 (2022). |
| [10] | Ibrahim, I. H., GH. Taha, and M. Sadek "Parametric Solutions to the Behrens-Fisher Problem." American Journal of Mathimatics and Statistics 13 (2023): 60-68 |
| [11] | Ibrahim, I. H. "On the Behrens-Fisher Problem and The Bootstrabe Solution An Alternative Approch." Journal of the faculty of commerch for scientific research, faculty of commece, Alexandria university XXXVII (2000). |
| [12] | Kim, S. H., and A. S. Cohen. "On the Behrens-Fisher Problem: A Review." Journal of Educational and Behavioral Statistics 23 (1998): 356-377. |
| [13] | Larsen, R. J., and M. L. Marx. An Introduction to Mathematical Statistics and Its Application. 5. Pearson Education, 2011. |
| [14] | Ozkip, E., B. Yazici, and A. Sezer. "A simulation Study on Tests for the Behrens- Fisher Problem." Turkiye Klinikleri J Biostat 6 (2014): 59- 66. |
| [15] | Paul, S. R., D. J. Best, and J. C. W. Rayner. "Comment on Best and Rayner (1987)." Technometrics 34 (1992): 249-250. |
| [16] | Paul, S. R., Y. G. Wang, and I. Ullah. "A Review of the Behrens-Fisher Problem and Some of Its Analogs: Does the Same Size Fit All?" Revstat Statistical Journa 4 (2019): 563-597. |
| [17] | Scariano, S. M., and B. S. "A Four Moment Solution to The Behrens- Fisher Problem." (Texas Tech. university) 1981. |
| [18] | Welch, B. L. "The Significance of the Difference between Two Means when the Population Variances are Unequal." Biometrika 29 (1938): 350-362. |

 Abstract
 Reference
 Full-Text PDF
 Full-text HTML