Amal F. Ghania, Nagwa M. Albehery
Department of Mathematics, Insurance and Applied Statistics, Helwan University, Cairo, Egypt
Correspondence to: Amal F. Ghania, Department of Mathematics, Insurance and Applied Statistics, Helwan University, Cairo, Egypt.
| Email: |  |
Copyright © 2023 The Author(s). Published by Scientific & Academic Publishing.
This work is licensed under the Creative Commons Attribution International License (CC BY).
http://creativecommons.org/licenses/by/4.0/

Abstract
Bioequivalence (BE) studies are becoming increasingly important due to the widespread production and use of generic drugs all around the world. These types of studies provide statistical evidence that two drugs or formulations, called the test drug and the reference drug, are therapeutically equivalent in terms of the rate and extent of absorption. Correctly identifying outliers in bioequivalence studies is very important because it may cause important differences in the results of the study. The existence of outliers may give the conclusion that formulations are not bioequivalent but in reality, they are bioequivalent. In the literature, several different methods have been proposed for detecting outliers in bioequivalent studies. In this paper, we compared four outlier detection tests: the estimated distance (ED) test, Hotelling T2 test, the mean shift test, and principal component analysis (PCA) test. This is the first time that the PCA test has been compared with the Hotelling T2 test and the mean shift test in the context of BE studies. The results of our simulation study showed that the ED test and PCA test outperformed the other two tests in detecting outliers.
Keywords:
Bioequivalence, Crossover design, Outliers, Likelihood distance, Estimated distance, Hotelling T2 test, Mean shift test, Principal Component
Cite this paper: Amal F. Ghania, Nagwa M. Albehery, Methods of Outlier Detection in Bioequivalence Process: A Comparative Study, American Journal of Mathematics and Statistics, Vol. 13 No. 2, 2023, pp. 69-75. doi: 10.5923/j.ajms.20231302.01.
1. Introduction
Bioequivalence (BE) studies are performed in the pharmaceutical industry to compare different forms of a drug or different drugs with the same active ingredient in terms of how quickly and completely the active ingredient is absorbed into the bloodstream. The most common pharmacokinetic parameters used to measure the rate and extent of absorption are the area under the blood or plasma concentration-time curve (AUC), the maximum blood or plasma concentration  , and the time to the maximum concentration
  . To conclude that two drugs are bioequivalent, the Food and Drug Administration (FDA) requires statistical evidence that the true ratio of their average pharmacokinetic responses (such as AUC) is between 80% and 125% with 90% confidence. However, a commonly encountered problem in BE studies is that the data set may contain some extreme or outlying values/subjects. These outliers can occur due to laboratory errors, unusual subjects, or simply human transcription errors. Outlier detection is an important step in BE studies, as the presence of outliers can significantly impact the results of the study. Since the 1970s, there has been a lot of research on outlier detection methods. However, most of this work has focused on outlier detection in linear regression models. For outlier detection in BE trials, Chow and Tse (1990a) [2] proposed two procedures: the likelihood distance and the estimated distance. Liu and Weng (1991) [9] also proposed a method called two-sample Hotelling
  for detection of multiple outliers in bioavailability/bioequivalence data. Wang and Chow (2003) [18] proposed a test procedure called a mean shift model. Enachescu and Enachescu (2009) [7] used principal components to introduce a test for outlier detection in BE studies with crossover design. In this paper, four methods will be applied for detecting outliers in bioequivalence studies and compared their ability to identify outliers. Specifically, the estimate distance test (ED), Hotelling's
  test, mean shift test and principal component analysis squared distance test (PCA) will be used.It is worth noting that this is the first time that principal component analysis squared distance test (PCA) has been compared to the mean shift test and Hotelling
  test. In section 2, we briefly explain each one of the above-mentioned methods. In section 3, the four discussed procedures will be performed on crossover BE data set and a simulation study will be conducted to evaluate the performance of these four procedures in terms of power and level of significance. A concise summary is provided in section 4.
2. Four Outliers Detection Tests in Bioequivalence Studies with Crossover Design
In this section, four outlier detection tests in bioequivalence studies with crossover design will be discussed. In subsection 2.1, likelihood distance and estimate distance will be explained. Hotelling  test will be demonstrated in subsection 2.2. In subsection 2.3, the mean shift test will be revealed. Principal component analysis squared distance test (PCA) will be clarified in subsection 2.4.
2.1. Likelihood Distance and Estimates Distance
These methods are based on the likelihood function of the data.The model for a  crossover design comparing
  formulations of a drug product under the assumption that there are no period effects, and no formulation effects can be expressed as:
  | (2.1) |
Where  is the response variable on the
  subject under the
  formulation,
 is the overall mean,
  is the random effect of the
  subject,
  is the error term.
  and
and  are assumed to be independently and normally distributed with means 0 and variances
  and
and  respectively. Chow and Tse (1990a) [2] introduced two test procedures, the likelihood distance (LD) and the estimates distance (ED) under the above model. Let
 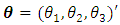 where:
 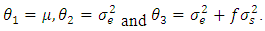 | (2.2) |
The log-likelihood function is given by: | (2.3) |
The maximum likelihood estimator (MLE)  is given by
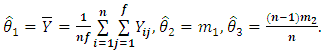 | (2.4) |
Where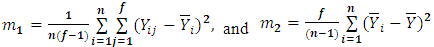 | (2.5) |
The LD test procedure can be expressed as 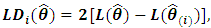 where
where  refers to the MLE of
  with deletion of the
  subject. Chow and Tse (1990 a) [2] demonstrated that as n tends to infinity,
  is asymptotically distributed as a chi-square variable with 3 degrees of freedom.Thus, the
  subject is considered as an outlying subject if
 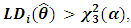 where
where  is the
  upper percentile point of a central chi-square distribution with 3 degrees of freedom.They also introduced the estimates distance test, which is defined as:
 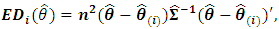 | (2.6) |
Where  is given by
 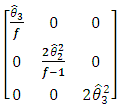 | (2.7) |
Chow and Tse (1990 a) [2] also showed that the ED test follows a chi-squared distribution with 3 degrees of freedom as the sample size (n) increases. Therefore, the  subject is considered as an outlying subject if
  .It is worthwhile to note that the sample size for a bioavailability study is sometimes too small to apply asymptotic distributions of LD and ED of Chow and Tse’s procedures, which is considered as a drawback of these procedures. Liu and Weng (1991) [9] applied the bootstrap technique to evaluate the sampling distribution of the LD and ED.
2.2. Hotelling T2
To detect possible outlying subjects, Liu and Weng (1991) [9] introduced a procedure based on the two-sample Hotelling  . The procedure works by first calculating the two-sample Hotelling
  statistics for each subject. The procedure identifies subjects that are likely to be outliers by looking at the order statistics of the
  statistics. Subjects that have
  statistics that are much larger or smaller than the majority of the
  statistics are likely to be outliers. They adapted the following model:
 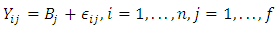 | (2.8) |
where  Let
Let  be
be  vector of the responses observed on subject
  to
to  formulations. Thus,
  are
are  -dimensional multivariate normal (MVN) random vectors with mean vector
  and covariance matrix
  , where
 and
and 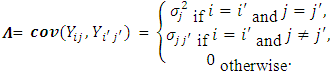 | (2.9) |
The formulation of the hypothesis for outlying subjects caused by a location shift can be written in the form of n sub-hypothesis as follows: 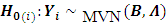
 Hotelling
  statistics can be expressed as
 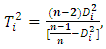 | (2.10) |
Where  | (2.11) |
And A is matrix of the sums of squares and cross products computed from  respectively.Hypothesis
  is rejected if
 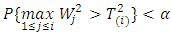 provided that
  are rejected at the
  level of significance, where
  , and
, and  be a vector of n Hotelling
  statistics computed from a sample of size n from an
  -dimensional multivariate normal with mean 0 and covariance matrix
  . The joint distribution of order statistics of
  is complicated. Instead, Liu and Weng (1991) [9] applied the Monte Carlo or bootstrap simulation to evaluate the sampling distribution of test statistics. They presented tables that give the 5% and 1% upper quantiles of the distribution of ordered
  statistics for
  = 2, 3 and varies sample sizes.
2.3. Mean-Shift Model
Wang and Chow (2003) [18] developed a method for identifying both outlying subjects and outlying observations in bioequivalence studies using the mean-shift model proposed by Srikantan (1961) [17],which is given as  | (2.12) |
Where  is the fixed formulation effect
  if
if  and 0 otherwise.
  and
and  are as defined before. Based on this model, the hypothesis of interest can be expressed as:
 Versus
  The score test for the above hypothesis is given as
 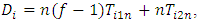 where
where 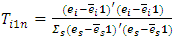 | (2.13) |
where 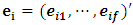 is the residual vector of subject i after fitting model (2.12) and 1 is an
  vector of 1s.
 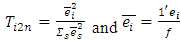 | (2.14) |
 can be used to detect an outlier observation in a certain formulation for a particular subject.
  can be used to detect whether the subject is an outlier.In addition,
  and
and  are independent beta random variables, i.e.,
  | (2.15) |
It follows that | (2.16) |
Based on statistic  subject
  is declared as an outlier at the
  significance level if
  is greater than the
  th upper percentile of the distribution of the maximum of
  Wang and Chow produced tables that provide the 10%, 5%, and 1% upper percentiles of the distribution of the maximum of
  A study by Ramsay and Elkum (2005) [14] compared the performance of Likelihood distance, estimates distance, Hotelling
  procedure, and the mean-shift model method. The study found that the estimate distance (ED) test was the most powerful method for detecting outliers. However, the study also found that the ED test was more likely to falsely identify subjects as outliers than the other methods.
2.4. Principal Component Analysis (PCA) Test
This method transforms the data into a new set of variables that are uncorrelated. In principal component analysis, we seek to maximize the variance of a linear combination of the variables. Enachescu and Enachescu (2009) [7] used principal components to introduce a test for outlier detection in bioequivalence studies with crossover design. They considered the weighted sum of square distance to zero of the projected data into principal factorial plane and mentioned that the observations with a square distance greater than threshold (m) may be considered as outliers where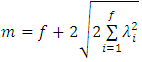 | (2.17) |
 is the Eigen value representing the variance of the i-th principal component, and
  is number of formulations. Rasheed A. et al (2013) [16] compared the outliers identification test based on principal components with likelihood distance test and estimates distance test. They also observed the performance of these tests through a simulation study.
3. Application
In this section, a numerical example will be presented in subsection 3.1 and a simulation study will be conducted in subsection 3.2.
3.1. Numerical Example
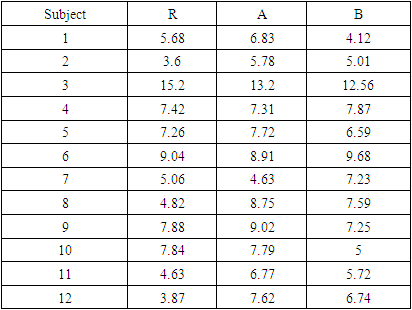
The above four mentioned tests will be applied to a modified data set of Areas Under the Curve: AUC as given in Table (1). Rasheed, Junaid and Ahmad (2011) [15] employed this modified data set to verify their proposed PCA test. The original data set was taken from a bioequivalence study reported by (Purich, 1980) [13]. In the paper, twelve healthy volunteers were employed to examine the bioequivalence of two test tablet formulations in comparison to a reference solution.Table 1. AUC data for each subject
 |
| |
|
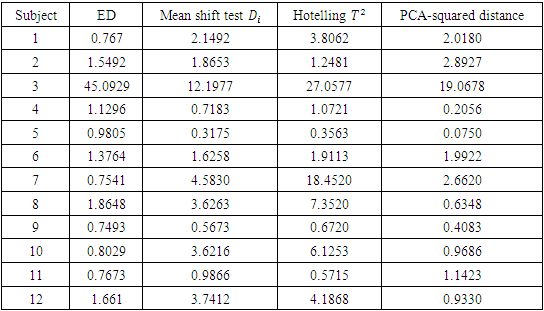
As shown in Table 2, the estimates distance test identified subject 3 as an outlier. The mean shift test was also able to identify subject 3 as an outlier. The PCA test identified subject 3 as an outlier as the value of the squared distance of subject 3 is 19.0678, which is greater than the threshold value m in equation (2.17) of 10.4302. Hotelling  was not able to identify subject 3 as an outlier as subject 3 has the highest Hotelling
  value of 27.0577, which is less than the 5th percentile (upper quantile) of
  of 30.63. This means that we cannot reject the null hypothesis
  at the 5% significance level, so we cannot conclude that subject 3 is an outlier, and the sequential testing procedure stops.
Table 2. Results of ED test, mean shift test, Hotelling T2 test and PCA-squared distance test
 |
| |
|
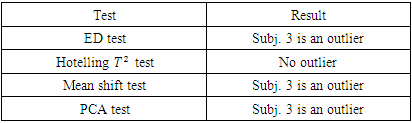
Table 3. Summary of the results of outlier detection from all four methods for AUC data set
 |
| |
|
3.2. Simulation Study
In this subsection, a simulation study will be conducted to compare the power and Level  of the four tests that we introduced in Section 2. We generate random samples under a 2 x 2 crossover design using the procedure described by Wang and Chow (2003) [18]. First, random samples
  have been generated from a bivariate standard normal distribution. Then, we obtain random samples
  and
and  as follows:
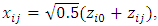
 Note that
  are used to capture the between-subject and within-subject variability, respectively. We set the mean of both the reference drug and the test drug to 100. The constant c is set to three different values,
  and
and  to ensure that the intra-subject coefficient of variation (CV%) is 10%, 20%, and 30%, respectively.The first observation is intentionally made to be an outlier by adding
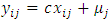
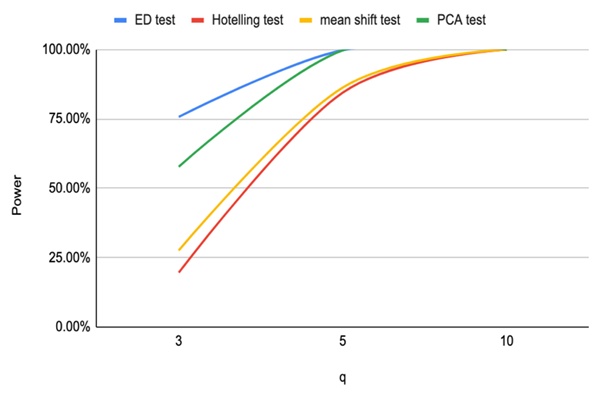
  to the response of test formulation, where s is the standard deviation of the test formulation of a given sample and q is a constant that can be chosen to represent a mild, moderate, or extreme outlier. All simulations were carried out with 3000 simulation samples. Table 4 shows the percentage of detecting designated outlying subjects of the four procedures for sample size 16 and 20.
Table 4. Power of ED test, mean shift test, Hotelling T2 test and PCA-squared distance test
 |
| |
|
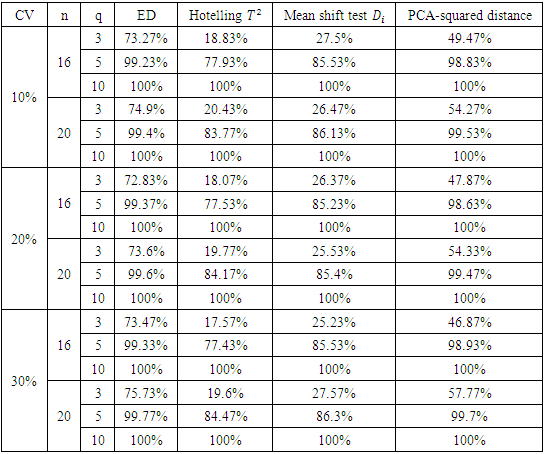
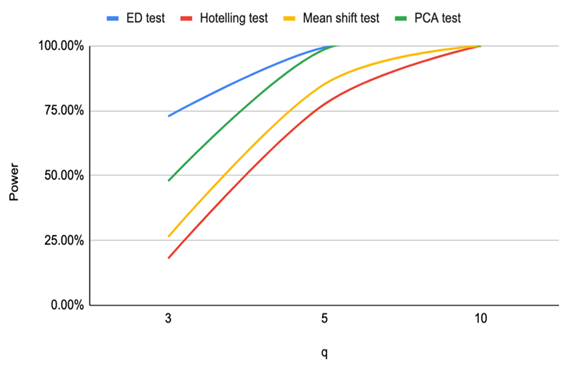
Based on the results of our simulation study as shown in Table 4, we conclude that the estimates distance (ED) test is the most powerful method for detecting outliers among the four methods. PCA-squared distance test is the second powerful method followed by the mean shift test and finally the Hotelling  test.Figure 1 through Figure 6 portrayed the power of the four tests for sample size n = 16, 20 with coefficient of variation 10%, 20%, and 30% and q=3,5,10.
 | Figure 1. Power of ED test, Hotelling test, mean shift test and PCA test for n=16, CV=10% |
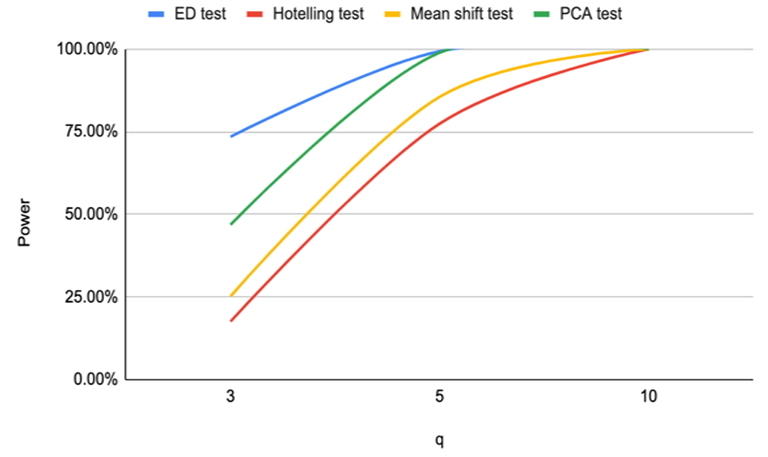
 | Figure 2. Power of ED test, Hotelling test, Mean shift test and PCA test for n=16 and CV=20% |
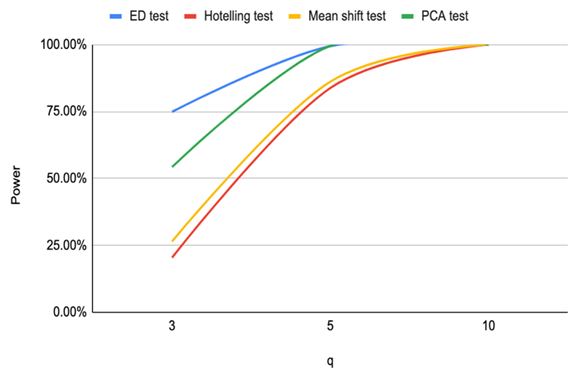
 | Figure 3. Power of ED test, Hotelling test, mean shift test and PCA test for n=16, CV=30% |
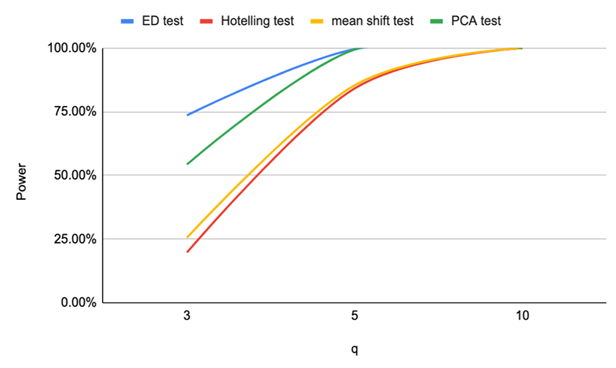
 | Figure 4. Power of ED test, Hotelling test, mean shift test and PCA test for n=20, CV=10% |
 | Figure 5. Power of ED test, Hotelling test, mean shift test and PCA test for n=20, CV=20% |
 | Figure 6. Power of ED test, Hotelling test, mean shift test and PCA test for n=20, CV=30% |
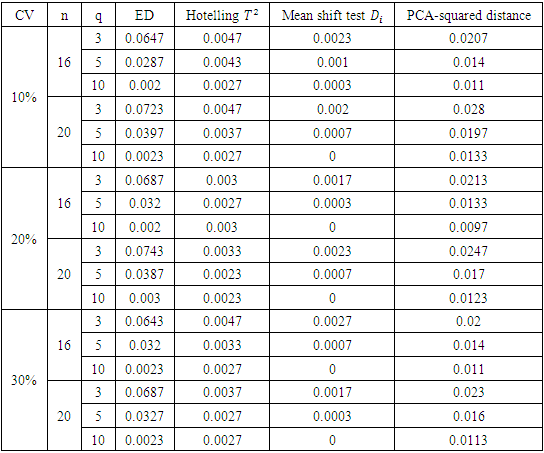
Level  of ED, mean shift test, Hotelling
  and PCA-squared distance test are presented in Table 5.
Table 5. Level of ED, mean shift test, Hotelling T2 and PCA-squared distance test
 |
| |
|
Based on Table 5, the ED test is the most likely to flag subjects wrongfully as outliers, followed by the PCA squared distance test. The Hotelling  test and the mean shift test are the least likely to flag subjects wrongfully as outliers. In fact, the mean shift test is much less likely to flag subjects incorrectly as outliers than the Hotelling
  test for all sample sizes and all levels of variability used in the simulation study.
4. Summary
There is no single best way to detect outliers in crossover design in bioequivalence studies. The best method to use will depend on the size of the study, the distribution of the data, and how sensitive you want the test to be. In general, it is best to use multiple outlier detection methods and consider the results of all methods before deciding whether to exclude a subject from the study.The ED test and the PCA-squared distance test are two generally recommended methods that are both powerful and conservative. This means that they are likely to detect real outliers, but they are also unlikely to flag good data points as outliers.
ACKNOWLEDGEMENTS
We would like to thank Dr. Ibrahim Hassan Ibrahim, professor of applied statistics at the department of mathematics, applied statistics and insurance, Faculty of Commerce and Business Administration, Helwan University, for referring us to the research topic and for his helpful comments on the initial draft of this research.
References
| [1] | Anderson, S., and Hauck, W.W., (1984), “A new statistical procedure for testing equivalence in two-group comparative bioavailability trials,” Journal of Pharmacokinetics Biopharmaceutics, 12, 83 – 91. |
| [2] | Chow, S.C. and Tse, S.K. (1990a). Outlier detection in bioavailability/bioequivalence studies. Statistics in Medicine, 9, 549–558. |
| [3] | Chow, S.C., and Liu, J. P., (1992), Design and Analysis of Bioavailability and Bioequivalence Studies, New York: Marcel Dekker, Inc. |
| [4] | Chow, S.C., Shao, J., and Wang, H., (2001a), “Statistical Tests for Population Bioequivalence,” Technical report, Dept. of Stat., University of Wisconsin, Madison. |
| [5] | Chow S-C and Liu J-P (2009). Design and analysis of bioavailability and bioequivalence studies (3rd ed.). New York: Dekker. |
| [6] | Davison, A., and Hinkley, D., (1997), Bootstrap Methods and their Applications, UK: Cambridge University Press. |
| [7] | Enachescu D, Enachescu C. (2009). A new approach for outlying records in bioequivalence trials. Paper presented at the The XIII International Conference "Applied Stochastic Models and Data Analysis". |
| [8] | FDA, (2001), “Guidance for industry on statistical approaches to establishing bioequivalence. Center for Drug Evaluation and Research, Food and Drug Administration, Rockville. Maryland 2001. |
| [9] | Liu, J. P. and Weng, C. S. (1991). Detection of outlying data in bioavailability/bioequivalence studies. Statistics in Medicine, 10, 1375-1389. |
| [10] | Liu, and Jen-Pei (1998), "Statistical Evaluation of Individual Bioequivalence," Communications in Statistics, Theory and Methods, V27, 6, PP 1433-1451. |
| [11] | Mogos, B (2013). Exploratory data analysis for outlier detection in bioequivalence studies. Biocybernetics and Biomedical Engineering, Volume 33, Issue 3, P. 164-170. |
| [12] | O’Brien (1984). Procedures for comparing samples with multiple endpoints. Biometrics 40, 1079-1087. |
| [13] | Purich E. (1980). Bioavailability/Bioequivalence Regulations: An FDA Perspective in Drug Absorption and Disposition: Statistical Consideration, K.S Albert, Edn. American Pharmaceutical Association, Academy of Pharmaceutical Sciences. Washington, DC, 15-137. |
| [14] | Ramsay T, Elkum N. (2005) A comparison of four different methods for outlier detection in bioequivalence studies. J. Biopharm Stat; 15(1): 43-52. |
| [15] | Rasheed, Junaid and Ahmad (2011). Detection of Outliers in Bioequivalence Studies Data Analysis with Williams Design. Proc. 8th International Conference on Recent Advances in Statistics. Lahore, Pakistan – February 8-9, 2011, 9-18. |
| [16] | Rasheed A. et al. (2013). Comparison of Outlier Detection Methods in Crossover Design Bioequivalence Studies, Journal of Pharmacy and Nutrition Sciences, 3, 163-170. |
| [17] | Srikantan, K.S. (1961). Testing a single outlier in a regression model. Sankhya. Ser. A vol. 23, No. 3: p251-260. |
| [18] | Wang, W. and Chow, S.C. (2003). Examining outlying subjects and outlying records in bioequivalence trials. Journal of Biopharmaceutical Statistics, 13, 43–56. |

 Abstract
 Reference
 Full-Text PDF
 Full-text HTML