Ibrahim H. Ibrahim, Ghada Taha, Mahmoud Sadek
Department of Mathematics, Insurance and Applied Statistic, Helwan University, Cairo, Egypt
Correspondence to: Ghada Taha, Department of Mathematics, Insurance and Applied Statistic, Helwan University, Cairo, Egypt.
| Email: |  |
Copyright © 2023 The Author(s). Published by Scientific & Academic Publishing.
This work is licensed under the Creative Commons Attribution International License (CC BY).
http://creativecommons.org/licenses/by/4.0/

Abstract
The Behrens-Fisher (B-F) problem arises from testing the equality between two population means from independent normal populations when variances are unknown, and the variances cannot assume to be equal. Many literatures have been introduced to solve this problem and several solutions have been proposed for it. In this article, two tests are proposed to deal with the B-F problem. These two proposed tests depended on the test statistic that was introduced by Behrens (1929) with some modifications that are based on the method that was provided by Chen et al. (2022) which depended on Fisher’s fiducial argument to estimate the variances of the sample means. Also, the formula for degree of freedom and constant were derived for each suggested solution. The comparison among the proposed tests and some existing tests such as Welch test and Fenstad test have been studied extensively by Monte Carlo simulation. The size and the power of these tests are evaluated by using several simulation scenarios to assess the suggested tests. The comparison study proved that the sample sizes and variances of populations should be taken into consideration to decide which tests should be used when dealing with this problem. This study shows that the power of proposed tests are better than or close to the power of Welch test especially, when the sample sizes are large regardless of this data is balanced or unbalanced.
Keywords:
Behrens-Fisher problem, Welch test, Fenstad test, Fisher’s fiducial argument, Power of the test, Size of the test, Balanced data, Unbalanced data
Cite this paper: Ibrahim H. Ibrahim, Ghada Taha, Mahmoud Sadek, Parametric Solutions to the Behrens-Fisher Problem, American Journal of Mathematics and Statistics, Vol. 13 No. 1, 2023, pp. 60-68. doi: 10.5923/j.ajms.20231301.03.
1. Introduction
The Behrens-Fisher (B-F) problem occurs when testing the equality between two population means from independent normal populations when variances are unknown, and the variances cannot assume to be equal [13] [9].Several solutions introduced and developed to solve this problem. Behrens (1929) proposed the earliest solution to this problem, Fisher (1939) endorsed this solution. Therefore, this problem is known Behrens-Fisher (B-F) Problem. But, this solution was not acceptable to many statisticians because the size or the estimated type Ι error of this test is often less than the nominal level [15] [8] [3] [1].Ever since, several solutions proposed for this problem and there was no exact solution to satisfy for all sample sizes [3] [11]. The popular approximation solution proposed by Welch (1938). Also, various approximation solutions were proposed such as: Cochran approximations' which depends on the Behrens- Fisher test statistic with different degrees of freedom [5]. On the other hand, another solution proposed by Fenstad (1983). However, Fenstad did not derive the formula of degrees of freedom for this test statistic that was an approximation to the t-distribution. Best and Rayner (1987) derived the degree of freedom formula for Fenstad test, and Paul (1992) showed that there exists an error in the degree of freedom formula. Best and Rayner (1987) proposed other solutions for this problem as the score test and Wald test. Modified Mover test is one of the latest solutions that proposed By Chen et al. (2022).Based on empirical properties of two proposed tests that deal with B-F problem, this paper aims to compare these two proposed tests with some existing tests such as Welch test and Fenstad test according to two comprehensive Monte Carlo simulation studies with different scenarios on the size and the power of the test. This simulation study was based on three factors (i) sample sizes (balanced or unbalanced), (ii) variances of populations, and (iii) the gap between population variances. This paper proceeds as follow. Section literature Survey for the Behrens- Fisher problem. Then, the proposed solutions were presented in section 3. Section 4 demonstrated the simulation study. Finally, the conclusion of the study is shown in section 5.
2. Literature Survey
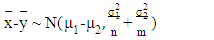
Several solutions were proposed for B-F problem. These solutions can be classified into exact and approximated solutions. In this paper, we focused on three approximation solutions (i) the Welch test, (ii) the Fenstad test, and (iii) the Wald test [11] [14].For testing the equality between two population means when variances are unknown or unequal based on two independent samples  and
and  from
from  and
and  respectively; where
  and
and  for k =1,2. The null and the alternative hypotheses are:
 vs
vs  First, we define some statistics as
 | (1) |
 | (2) |
Where  are the sample means and
  are the sample variances for the first and second sample respectively. So that:
 | (3) |
 | (4) |
Then | (5) |
Where,  is chi- square probability distribution with k degrees of freedom. Therefore,
 | (6) |
And thus,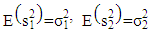 | (7) |
Therefore,  are unbiased estimators for
  respectively.Welch test (T1): This test was proposed by Welch (1938), this is well known as a standard solution to testing the equality between two means from normal population with unequal variances, [3] [4]. According to this test, the test statistic was approximated by t-distribution with degrees of freedom
  We can calculate the Welch statistic
  and
and  as the following [14] [3]:
 | (8) |
 | (9) |
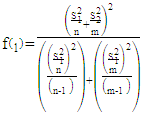
Fenstad test (T2): Fenstad (1983) suggested a test statistic to deal with B-F problem as the following [3] [13]: | (10) |
Where, T2 was approximated by t-distribution with degrees of freedom  and constant
  as the following:
 | (11) |
 | (12) |
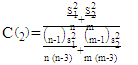 | (13) |
 Was proposed by Paul (1992) and
  was introduced by [3].Wald test (W): This test was proposed by Best and Rayner (1987). The Wald test statistic is:
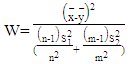 | (14) |
Best and Rayner only suggested the formula of the test statistic without proposing the approximated distribution for it.
3. Proposed Solutions to the B-F Problem
In this paper, we suggest new two solutions to the B-F problem to solve the B-F problem. These solutions depended on the test statistic that introduced by Behrens (1929), supported by Fisher (1939) and used by Welch (1938) [10]. Also, we use the method that was provided by Chen et al. (2022) that based on Fisher’s fiducial argument to estimate the variances of the sample means and substituting with them in the test statistic. Then, we derive the formula for degree of freedom and constant for each suggested solution. Let T be the test statistic: | (15) |
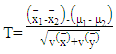 | (16) |
When  is true
  . The test statistic can be written as the following:
 | (17) |
Welch (1938) approximated this test statistic to the student t- distribution. It can be written as:  where f is the degrees of freedom, and c is a constant (c=1).To get the values of the test statistic, we need to get:
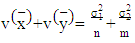 | (18) |
In the B-F problem,  is often unknown, we can replace it by using the variance estimate
  Therefore, we can rewritten equation (19) as:
 | (19) |
Then  can be estimated by using the following relationships [4]:
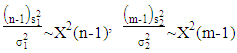 | (20) |
Let:  | (21) |
Where,  is a random variable that follows the chi-square
  distribution.Therefore:
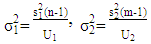 | (22) |
We can assume some values for  to get the corresponding values of
  Different values for
  will lead to different values of
  Chen et al. (2022) replaced
  with (n-3), which is the maximum value of probability density function when introduced the Modified Mover statistic. If we replaced
  with (n-1), get the variance estimate and substitute with it in equation (8), we will get to the Welch statistic. Where, (n-1) is the mean of
  distribution. Thus, in this paper we proposed two different cases, the values (n, m) will replace the variables
  respectively as will be shown in the Case-I. While, in the Case-II we consider (n-2, m-2) to replace the variables
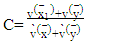
  respectively.For each suggested test statistic, we need to get the degrees of freedom (f) and the constant (C) to approximate the test statistic to t- distribution as we shown in Welch approximation. By investigating the previous solutions for the B-F problem which introduced in statistical literatures such as: Welch test and Fenstad test, we can derive the formulas for (f), (C) as:
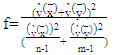 | (23) |
 | (24) |
 | (25) |
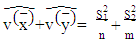
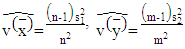
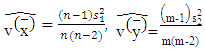
Where  are variances values of the sample mean for the first and second sample respectively.
 are variances value of the sample mean which was used by Behrens and Fisher before for the first and second sample respectively.
3.1. Case-I: (U1 = n, U2 = m)
In this case, we need to get the variance estimate by replacing the variables  with
with  respectively. Then equation (22) can rewritten as the following:
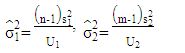 | (26) |
Therefore, the variance estimator is given as: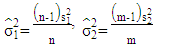 | (27) |
 | (28) |
We can substitute with  in equation (17) to get the new test statistic as follow:
 | (29) |
Where  is the square root of Wald statistic, thus
  By applying equations (23) and (24), respectively. We get
  as the following:
 | (30) |
Then, | (31) |
 | (32) |
3.2. Case-II: (U1 = n-2, U2 = m-2)
In this case, we need to get the variance estimate by replacing the variables  with
with  respectively. Then, we can reformulate equation (12) as the following:
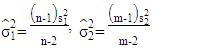 | (33) |
 | (34) |
Then, we can substitute with  in equation (17) to get the test statistic T4 as the following:
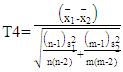 | (35) |
This test statistic is approximated by t-distribution with degrees of freedom  and constant value
  as:
as: | (36) |
By using the formulas in equation (23) & (24) we can get  as the following:
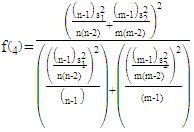 | (37) |
 | (38) |
4. Simulation Study
The Monte Carlo simulation study was conducted using R package as shown in the following steps:1- Generating data for samples from normal populations at different combinations of the four factors that we referred to them in the previous section. 2- Calculate the estimated sample means  for each case.3- Calculate the estimated variances
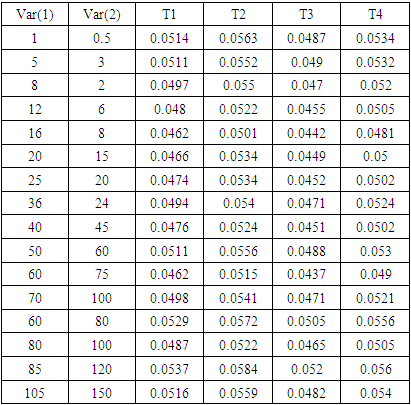
  for each case.4- Calculate the test statistics for the four tests. 5- Calculate the size of the four tests. 6- Calculate the power of the four tests.A comparative study was conducted to evaluate the performance of four tests: (1) Welch test (T1), (2) Fenstad test (T2), and the proposed tests:(3) The first proposed test (T3), and (4) The second proposed test (T4).These simulation studies are based on three factors: (i) sample sizes (balanced or unbalanced), (ii) values of the variances of the populations, and (iii) the gap between population variances. In several scenarios, the simulation studies were conducted to compare the size (The probability of type-I error) and the power of each test under different factors combinations. These simulation studies were applied with samples generated from normal populations with different means and different variances in two scenarios as the following:Case 1: Balanced data (the sample sizes are equal).Case 2: Unbalanced data (the sample sizes are different).In Tables (1, 2 and 3), the estimated type-I error probabilities for the four tests are shown when the sample sizes are (n, 𝑚 = 20, 50 and 100).
Table 1. The Probability of Type-I Error for The Four Tests Under Different Variances, μk = 2 and n = m = 20
 |
| |
|
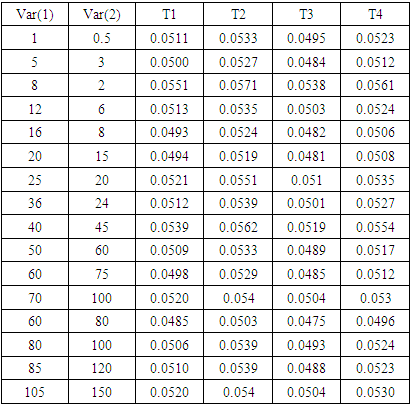
Table 2. The Probability of Type-I Error for The Four Tests Under Different Variances, μk = 2 and n =m = 50
 |
| |
|
Table 3. The Probability of Type-I Error for The Four Tests Under Different Variances, μk = 2 and n= m = 100
 |
| |
|
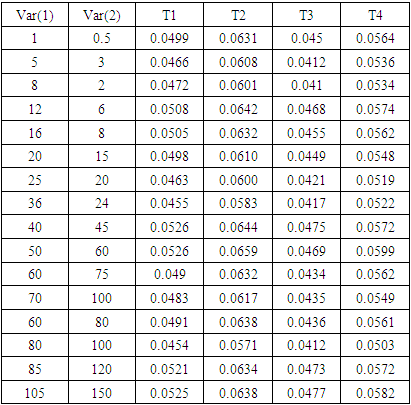
These simulation studies determined based on 10000 generated samples at a nominal level α = 0.05, the samples generated from normal distribution at μ = 2 under different variances. Var(1) and Var(2) are the variances of the first and the second population respectively. We used the R package for the computations in this paper.Figure. 1 represents the estimated type-I error probabilities (transformed by log10) for the four tests. This figure corresponding to values of Tables (1, 2 and 3). Two vertical lines in this figure represent the solid and broken lines equivalent to 0.05 and 0.06, respectively as shown in Figures. 1 and 3. Different symbols in these figures represent the different sample sizes (n, m= 20, 50 and 100) as shown in Figures. 1, 2, 3 and 4.Figure. 1 demonstrates that the estimated type-I error for test T1 (Welch test) is closer to a nominal probability at 0.05 in all combinations (acceptable size). But test T2 has overestimated probably of type-I error when sample sizes are small regardless of the values of population variances. Therefore, test T2 cannot be recommended for testing the differences between the two means in this case.The estimated type-I error for test T3 is so far from a nominal level at 0.05 when the sample sizes are small and variances are small. But it becomes closer to 0.05 when increasing sample size and the value of variances.type-I error for test T4 is between the two lines, that is mean that the size of this test is acceptable.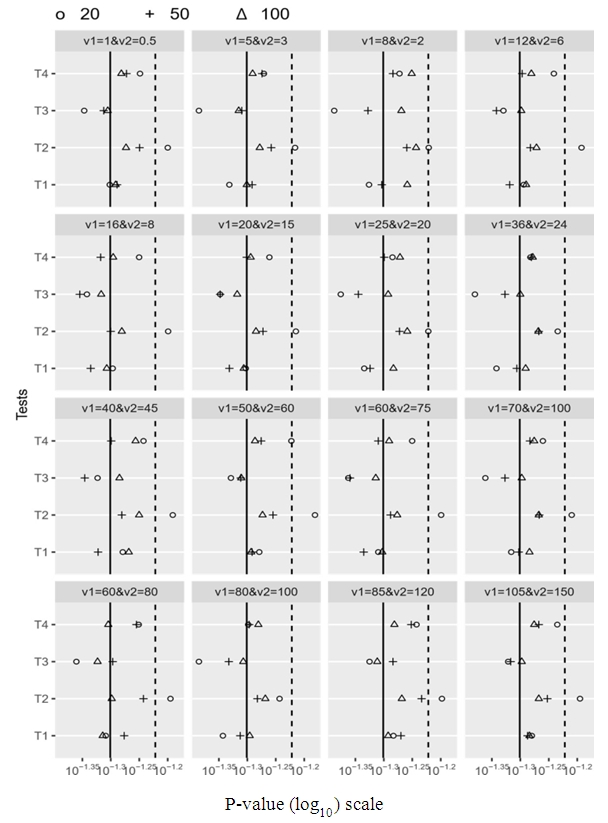 | Figure 1. The estimated probabilities of type-I error for the four tests |
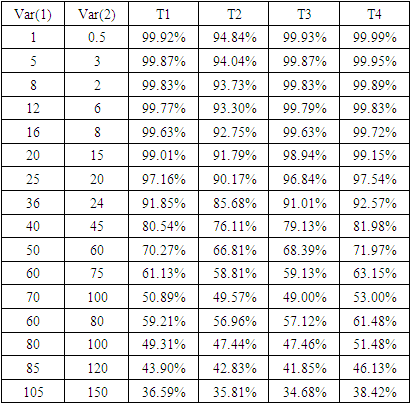
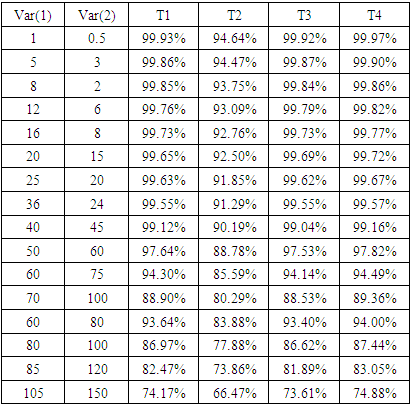
Tables (4, 5 and 6) represent the power of the four tests when the sample sizes are equal (balanced data) and (μ1 = 2, μ2 = 8) under different variances. Table 4. The Power of The Test for The Four Tests Under Different Variances, μ1 = 2, μ2 = 8 and n=m=20
 |
| |
|
Table 5. The Power of The Test for The Four Tests Under Different Variances, μ1 = 2, μ2 = 8 and n= m= 50
 |
| |
|
Table 6. The Power of The Test for The Four Tests Under Different Variances, μ1 = 2, μ2 = 8 and n=m= 100
 |
| |
|
Figure. 2 represents the estimated power of the test for the four tests. This figure corresponding to values of Tables (4, 5 and 6). | Figure 2. The estimated power of the four tests |
The power of the test for test T4 is better than the power for test T1 when the values of variances are small regardless of the sample sizes. Also, the power for the test T3 is high but lower than the power of T1 slightly. In general, the power for tests T1, T3 and T4 are decreasing with increasing the values of variances and gap of these variances.By Figures. 3, 4, and 5 we can get the simplified overview about the estimated power of the test for the four tests when the data is balanced. These figures corresponding to the values of Tables (4, 5 and 6) respectively.In Figure. 3, the power of the test for tests T1, T3, and T4 is very close in almost cases. While, the power of the test for T2 is the lowest generally. In Figure. 4, the power of the test for tests T2 is the lowest one in all cases. And the gap of the power between test T2 and other tests became clearer.Also, the same result that shows in Figure. 5. The power of the test for T2 is the lowest. But, the power of the test for T4 is the best power. Then, the power of the test for T1 in the second level. Also, the power of the test for T3 test is closer to the power for T1. 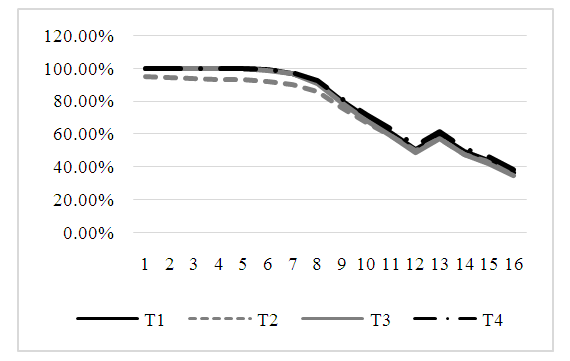 | Figure 3. The estimated power of the four tests |
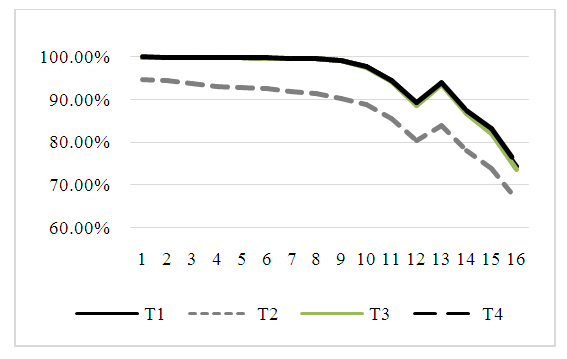 | Figure 4. The estimated power of the four tests |
 | Figure 5. The estimated power of the four tests |
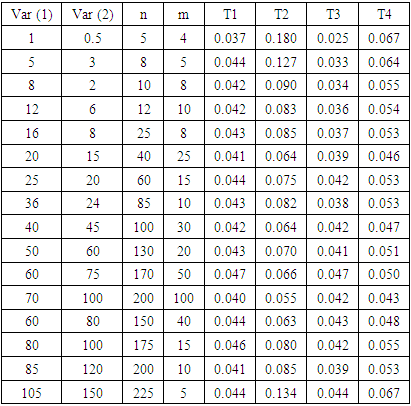
Table 7 shows the estimated type-I error probabilities for the four tests when the sample sizes are not equal (unbalanced data) at a nominal level α = 0.05, μk = 2 under different variances. Table 7. The Probability of Type-I Error for The Four Tests Under Different Variances, Different Sample Sizes (Unbalanced Data) and μk = 2
 |
| |
|
Figure. 6 represents the estimated type-I error probabilities (transformed by log10) for the four tests under different variances for unbalanced data (sample sizes are different) at μk = 2. This figure corresponds to values that are listed in Table 7.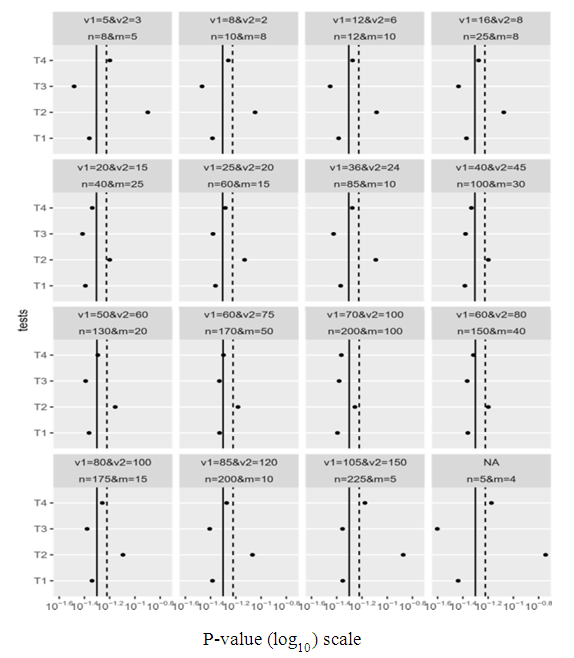 | Figure 6. The estimated probabilities of type-I error for the four tests |
Figure. 6 shows that the estimated type-I error probabilities for test T4 overestimate type-I error when the sample sizes and variances are small but it become closer to the nominal level when increasing sample sizes and variances. Also, type-I error probabilities for tests T1 and T3 are so far from a nominal level (0.05). However, they become closer to 0.05 when sample sizes and variances are increasing. Finally, the estimated type-I error probabilities for test T2 overestimate in most cases and so far from 0.05 in other cases. In both cases, it shows non-acceptable size so, the power of test T2 would not be reliable.Table 8 represents the power of the four tests when the sample sizes are not equal and (μ1 = 2, μ2 = 8) under different variances. Table 8. The Power of The Test for The Four Tests Under Different Variances, Different Sample Sizes and (μ1 = 2, μ2 = 8)
 |
| |
|
Figure. 7 represents the power of the test for three tests only. This figure corresponds to the numerical values founded in Table 8. In this figure, test T2 has been deleted from the power comparison, because the size of this test is not acceptable sizes.Figure. 7 shows that the power of T4 test is the best power among the three tests in this comparison. The power for T3 is better than T1. But, the power of all tests reached the lowest level when one sample size is small while, variances values and the gap between them are large. | Figure 7. The estimated power of the three tests |
In Figure. 8 we can show the overview about the power of the test for three tests only (T1, T3 and T4) when the data is unbalanced. This figure corresponds to the numerical values in Table 8. This figure shows that the power of T4 test is the best power among tests in this comparison. Also, the power for T3 is better than T1.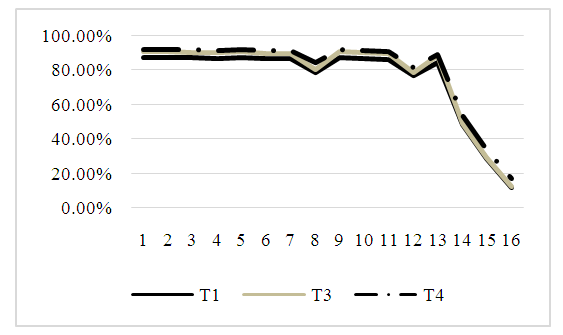 | Figure 8. The estimated power of the three tests |
5. Summary and Conclusions
In this paper, two tests (T3, and T4) were proposed to solve the B-F problem. These tests depended on the test statistic which was introduced by Behrens (1929) using the variance estimators. These estimators based on the method that was provided by Chen et al. (2022) that based on Fisher’s fiducial argument to estimate the variances of the sample means  respectively. For each suggested test statistic, we needed to get the degrees of freedom (f) and the constant (C) to approximate the test statistic to t- distribution as we shown in Welch approximation. Then, we derived the formula for degree of the freedom (f) and the constant (C) for each suggested solution to approximate their distributions to t-distribution as we shown in Welch approximation and Fenstad test.Monte Carlo simulation was used to evaluate the performance of the proposed tests (T3, and T4) and the other tests such as (Welch test, and Fenstad test) under several scenarios. The simulation study was conducted to compare the sizes (the estimated type-I error probabilities) and the powers of these tests. This simulation study was based on three factors (i) sample sizes (balanced or unbalanced), (ii) values of population variances, and (iii) the gap between population variances. The main findings of the simulation study can be summarized in the following:1) The estimated type-I error probabilities for tests T4, and T1 (Welch test) are closer to a nominal level 0.05 when the sample sizes are equal (balances data) especially when the sample sizes are large as shown in Figure. 1.2) In most cases, test T2 has overestimated probability of type-I error. Therefore, test T2 cannot be recommended for testing the differences between two population means generally.3) When sample sizes and variances are small, the estimated type-1 error for test T3 is so far from a nominal level. But it becomes closer to nominal level with increasing the sample sizes and variances. So, we can recommend test statistic T3 to deal with B-F problem when the sample sizes and variances are large.4) When the data is unbalanced, the type-I error probabilities for tests T3, and T1 are so far from the nominal level. However, they become closer to nominal level when sample sizes and variances are increasing. This result about test T1 agrees with Chen's mention in his study in 2022 (Welch test is applicable for large sample sizes only).5) The estimated type-I error probabilities for test T4 is overestimated when the sample sizes and variances are small but it becomes closer to the nominal level when increasing sample sizes and variances.6) When the data is balanced, the power for test T4 is better than the power for test T1 when the variances are small regardless of the sample sizes. But, the power for test T1 is better than the power of T3 slightly.7) In general, the power for tests T1, T3, and T4 are decreasing when the gap between variances gets larger and sample sizes are equal, but still T4 with the highest power.8) When sample sizes are unequal, the powers for T4 and T3 are better than the power of T1. Where the power for test T4 is the best power between all tests in this comparison. 9) Generally, when the sample sizes are unequal, one sample size is much smaller than the other, and the gap of the variances are large, the power of all tests reached to the lowest level. Finally, we conclude that the proposed tests (T3 and T4) can be recommended as alternative new solutions to the B-F problem especially, when sample sizes are large. That is because, the power of test T3 and test T4 are better than or close to the power of test T1 (Welch test).
References
| [1] | Aoki, S. "Effect Sizes of the Differences between Means without Assuming Variance Quality and between a Mean and a Constant." Heliyon 6 (2020). |
| [2] | Behrens, W V. "Ein Beitrag Zur Fehlerberechung beiwenigen Beobachtungen." Landwirtsch. (Jahrbucher) 68 (1929): 807-837. |
| [3] | Best, D. J., and J. C. Rayner. " Welch's Approximate Solution for the Behrens-grimes Problem." Technometrics 29 (1987): 205-2010. |
| [4] | Chen, CH., Yilin Li, K. Liang, and J. Du. "A Test for the Behrens-Fisher Problem Based on the Method of Variance Estimates Recovery." Communication in Statistic- Theory Methods 51 (2022). |
| [5] | Cochran, W. G. "Approximation Significance Levels of the Behrens-Fisher Test." Biometrics 20 (1964): 191-195. |
| [6] | Fenstad, G. U. "A Comparison between U and V Tests in the Behrens-Fisher Problem." Biometrika 70 (1983): 300-302. |
| [7] | Fisher, R. A. "The Comparison of Samples with Possibly Unequal Variances." Annals of Eugenics 9 (1939): 174-180. |
| [8] | Grimes, B. A., and W. T. Federer. "Comparison of Means from Populations with Unequal Variances." (Biometrics Unit Series, Cornell University, Ithaca, new york) 1982. |
| [9] | Ibrahim, I. H. "On The Behrens-Fisher Problem and The Bootstrabe Solution An Alternative Approch." Journal of the faculty of commerch for scientific research, faculty of commece, Alexandria university XXXVII (2000). |
| [10] | Kim, S. H., and A. S. Cohen. "On the Behrens-Fisher Problem: A Review." Journal of Educational and Behavioral Statistics 23 (1998): 356-377. |
| [11] | Ozkip, E., B. Yazici, and A. Sezer. "A simulation Study on Tests for the Behrens- Fisher Problem." Turkiye Klinikleri J Biostat 6 (2014): 59- 66. |
| [12] | Paul, S. R., D. J. Best, and J. C. W. Rayner. "Comment on Best and Rayner (1987)." Technometrics 34 (1992): 249-250. |
| [13] | Paul, S. R., Y. G. Wang, and I. Ullah. "A Review of the Behrens-Fisher Problem and Some of Its Analogs: Does the Same Size Fit All?" Revstat Statistical Journa 4 (2019): 563-597. |
| [14] | Scariano, S. M., and B. S. "A Four Moment Solution to The Behrens- Fisher Problem." (Texas Tech. university) 1981. |
| [15] | Welch, B. L. "The Significance of the Difference between Two Means when the Population Variances are Unequal." Biometrika 29 (1938): 350-362. |

 Abstract
 Reference
 Full-Text PDF
 Full-text HTML