-
Paper Information
- Paper Submission
-
Journal Information
- About This Journal
- Editorial Board
- Current Issue
- Archive
- Author Guidelines
- Contact Us
American Journal of Mathematics and Statistics
p-ISSN: 2162-948X e-ISSN: 2162-8475
2022; 12(2): 22-26
doi:10.5923/j.ajms.20221202.02
Received: Jul. 27, 2022; Accepted: Sep. 13, 2022; Published: Sep. 23, 2022

Determination of Nutritional Status of Children by Their Body Mass Index Using Percentile Tables
 Abstract
 Reference
 Full-Text PDF
 Full-text HTML
Adeyemo S. O., Ofomata A. I. O., Okereke I. C.
Maths and Statistics Department, Federal Polytechnic, Nekede, Owerri, Imo State, Nigeria
Correspondence to: Adeyemo S. O., Maths and Statistics Department, Federal Polytechnic, Nekede, Owerri, Imo State, Nigeria.
| Email: |  |
Copyright © 2022 The Author(s). Published by Scientific & Academic Publishing.
This work is licensed under the Creative Commons Attribution International License (CC BY).
http://creativecommons.org/licenses/by/4.0/

This is a descriptive study carried out to determine the nutritional status of children within the ages of four(4) to ten (10) years using their body mass index(BMI). Body Mass Index (BMI) is a statistical parameter used to determine the nutritional status/body weight efficiency of individuals, and it has been used in many countries for assessment of underweight, healthy weight, overweight and obesity in children and adults. The prevalence of obesity in children is increasing and is recognized as a risk indicator of cardiovascular disease in adulthood. The weights and heights of 600 (300 males and 300 females) sampled children were measured and their BMI was calculated as weight(kg)/height2 (m2). under weight, healthy weight, over weight and obese children were identified using charts from pooled internationally accepted data age and sex specific cut -off points for BMI. The BMI ranges from 09.25kg / m2. To 28.20Kg/m2 with a mean BMI of 15.02 kg/m2. The mean BMI for males was 15.33kg/m2 and that for females 14.71kg/m2. The prevalence of Underweight, Healthy weight, overweight and obesity were 16.33, 64.34%, 12% and 7.33% respectively. More males were significantly malnourished than females. Most children had BMI within the normal range. The prevalence of malnourishment among children though predominantly low should be taken seriously, especially as it appears to be associated with improving socioeconomic status. School health education (physical activity and nutritional education) is recommended as preventive measures.
Keywords: Nutritional status, Body Mass Index, Weight, Height, Obesity
Cite this paper: Adeyemo S. O., Ofomata A. I. O., Okereke I. C., Determination of Nutritional Status of Children by Their Body Mass Index Using Percentile Tables, American Journal of Mathematics and Statistics, Vol. 12 No. 2, 2022, pp. 22-26. doi: 10.5923/j.ajms.20221202.02.
Article Outline
1. Introduction
- Body Mass Index (BMI) is a measure of the ratio of one’s body mass to the square of his /her height. And it has been in use in many countries for assessment of overweight, obesity, together with nutritional status determination. The increasing prevalence of overweight and obesity in both children and adults is associated with many diet-related chronic diseases including diabetes mellitus, cardiovascular disease, stroke, hypertension and certain cancers. In order to maintain a regular and constant body weight standard, the knowledge of body mass index was introduced by the world health organization to enable the entire public have an insight into proper diet regulation. WHO, 2004. But for the purpose of this study, emphasis will be laid only on the body mass index of children within the age of four to ten years old. Body Mass Index (BMI) is a number calculated from one's weight and height, it is a reliable indicator of body fatness for most children and teens. It does not measure body fat directly, but research has shown that BMI correlates to direct measures of body fat, such as energy x-ray absorptiometry (DXA). BMI can be considered an alternative for direct measures of body fat and nutritional status determination. For adults it is usually age independent and may not absolutely depend on sex of the individual, but for children and teens, BMI is age- and sex-specific and is often referred to as BMI-for-age. After BMI is calculated for children and teens, the BMI number is plotted on the CDC BMI-for-age growth charts (for either girls or boys) to obtain a percentile ranking. Percentiles are the most commonly used indicator to assess the size and growth patterns of individual children in m6st countries of the world. The percentile indicates the relative position of the child's BMI number among children of the same sex and age. The growth charts show the weight status categories used with children and teens (underweight, healthy weight, overweight, and obese. CDC, 2005. This research work was carried in other to ascertain the degree of precision in using the analysis of body mass index in determining the nutritional status of children within the age of four to ten years. Secondly, to assemble information of sufficient quality and quantity which will help in the provision of basis for making accurate analysis and sound decision on the health of children within the age of four years to ten years old using their body mass index. This research comprises of the principles which accomplishes the processes of determining the nutritional status of children within the ages of four to ten years using their body mass index, it also covers the exploitations of some statistical models which helps in the proper estimations of child’s nutritional condition, using a world known standard for health status determination.
2. Review of Relevant Literature
- After several years of experience with body mass index (BMI)-for-age reference standards in the US, the UK, and elsewhere, reflection on 'how things are going' seems timely. In this issue, a summary of the evidence base for the diagnostic accuracy of BMI in children and the perspective on what is achieved by a definition of overweight and obesity based on high BMI was obtained. In other to complement this analysis, research was being carried out by many health scholars to determine the usefulness of BMI.Mei, (2002) showed that the BMI was indeed an appropriate predictor for overweight and obesity. However, the study did not solve the problem of defining obesity within the scope of BMI. Further research still needed to be done in regards to the understanding how and when to use the BMI and how to differentiate between using the BMI and BMI percentiles for children and adults. (Krebs 2007) found that there was an absence of established criteria when it came to cutoff points for children based on distributing anthropometric measurements. In this review of research studies, Krebs outlined the differences between childhood obesity and adult obesity in regards to BMI. Children were measured by BMI percentiles, whereas adults were measured by the BMI alone (Krebs, 2007). This has been upheld by the Centers for Disease Control and Prevention. Adult overweight is defined as a BMI between 25 and 29.9 and adult obesity is defined as having a BMI greater than 30.Childhood overweight is defined as a BMI at or above the 85th percentile and lower than the 95th percentile. Childhood obesity is defined as having a BMI of greater than or equal to the 95th percentile for children of the same age and sex. Rather than using a specific BMI to determine obesity among children, their weight status is based on age and sex specific scales. This is because a child’s body composition fluctuates with age and sex more than an adult’s body (Centers for Disease Control and Prevention, 2009).According to Dr. Peter Nieman, (2004) a practicing pediatrician in the US, has identified three main causes of childhood obesity: genetics, overeating and lack of exercise. He emphasizes that it is important to understand that the causes of obesity are often a combination of these three factors. Obesity is just not the result of a single factor.Genetics can contribute to obesity, but very rarely. Only one percent of obesity is due a hormonal cause (Nieman,et’ al 2004), that is, mutations that lead to altered secretion of hormones or hormonal action. Usually with the right support and guidance, children can work hard to keep their weight within a healthy range. Overeating is another factor that causes over weight and obesity. Over the past fifteen years the super-sized portions are increasing, along with super-sized kids with super-sized problems (Kempster, 2004). Many areas of a child's life are influenced by this increase in overeating. For example, there have been dramatic changes at school that have helped kids make more unhealthy food choices. Cafeterias now serve food with larger fat content and low nutrition. Soda and candy machines have also been conveniently placed in many schools (Kempster, 2004). A recent study in the Journal of Pediatrics showed that fast-paced consumption results in a greater intake of fats and calories and decreased intake of foods and vegetables. A study done by King et al. (1999) showed that the percent fruit and raw vegetables grade six children consumed steadily declined from 1990 to 1998. For any given meal, at least 30% of kids are eating fast food and are eating approximately 200 more calories more, which adds up to 6 pounds of fat per year. Many researchers have argued that children should be protected from these damaging forces. However, they are exposed to these fast food choices every day, making it difficult to support healthy eating (Kuntzman, 2004). In a recent press release, Burger King's CEO, Brad Blum told the public how Burger King would help reduce childhood obesity, "we hope to reinforce the importance of physical fitness as part of everyday life, help kids fuel the fire within and understand the concept of energy in and energy out" (Kuntzman, 2004). However, no campaign to date has been launched with this goal in mind. The third factor that causes childhood obesity is not getting enough exercise. This lack of activity is a result of the lack of emphasis on physical education in schools and at home. More specifically, there has been a decline in the development of grass root sports and a general decrease in the amount of time during and after school that is devoted to physical activity (Anrig, 2003). It has been shown by Tremblay et al. (2003) that organized and unorganized physical activity is negatively associated with obesity. Physical activity decreases the risk of a child becoming obese by at least 23% to 43%. In contrast, watching television and playing video games increases the risk of becoming overweight by 17% to 44% and becoming obese by 10% to 61%. In the 21st century, physical activities such as jumping rope, riding bikes, and skating have been replaced with television, video games and computer games (Anrig, 2003; Kempster, 2004).A study done by Willmset al (2003) showed that parents' weight also plays an important factor in the causes of obesity. A 1998 study in the New England Medical Journal showed that if parents' weights are normal or slightly overweight when the child is between the ages of one and three, there is no increased risk of obesity later in life. However, children between the ages of one and three whose parents, brothers or sisters that are also overweight have a higher risk of becoming overweight themselves (Nieman, 2004).According to Dr. Peter Nieman, (2004). he stated that individual health factor is a product of nutritional proficiency, he identified the major classes of individual nutritional state; malnourished and well-nourished state. he emphasized that it is important to make a generalized conclusion of nutritional status into this two categories.
3. Materials and Methods
3.1. Method
- In this research work primary data method was adopted, the data was obtained from direct measurement of the height and weight of children within the ages of four to ten years from selected primary schools. This study was conducted in Owerri, the capital city of Imo state of Nigeria. The study was a prospective cross-sectional observational study in which a two stage systematic sampling method was used. In the first stage, the schools were selected while the students were selected in the second stage. Twenty (20) schools were selected from the sampling frame using a sampling interval of 10. Every third child received a questionnaire, letter of introduction and consent form. The parents filled the questionnaires, answering questions concerning the child’s age and medical history, occupation and educational status of the parents. Eight hundred questionnaires were distributed among the students using a sample interval of three (the 20 schools had a population of 6250 students). Six hundred questionnaires were returned with full parental consent. Each school was visited between 10 am and 1.30 pm each day. The head teacher in each school and the investigator explained the study to the student before physical examination and anthropometry were done. Apparently healthy school children (male and female) aged 4-10 years (both years inclusive) who obtained the consent of their parents were included in the study and children with chronic diseases were excluded by medical history (parental questioning) and by physical examination.The data collected were analyzed using- BMI formula/calculator- Percentile chart
3.1.1. BMI Formular/Calculator Method
- BMI FormulaHow To Calculate Body Mass Index Or BMIBMI is weight (in kilograms) over height squared (in meters). However, using pounds and inches.For instance, the BMI of a person who is 5’3" and weighs 125 lbs. is calculated as follows:The BMI calculator is an estimator which is design with the aim of determining the body mass index of individuals, the Body Mass Index (BMI), or Quetelet index is a measure of relative weight based on an individual's mass and height. And in other to achieve this standard, a BMI calculator was design which gives an approximate value with that gotten from the formular method.Devised between 1830 and 1850 by the Belgian polymath Adolph Quetelet during the course of developing "social physics", it is defined as the individual's body mass divided by the square of their height – with the value universally being given in units of kg/m2.
3.1.2. Percentile Chart
- BMI can also be determined using a table or from a chart which displays BMI as a function of mass and height using contour lines, or colors for different BMI categories, and may use two different units of measurement.The BMI is used in a wide variety of contexts as a simple method to assess how much an individual's body weight departs from what is normal or desirable for a person of his or her age. There is, however, often vigorous debate, particularly regarding at which value of the BMI scale the threshold for overweight and obese should be set, but also about a range of perceived limitations and problems with the BMI.
3.2. Test for Normality
- Test for normality of any statistical data is a test which shows that the data being evaluated is gotten from a normally distributed population. And it is also used to know the variability of data from normality.
3.3. Data Analysis Using Formular/Calculator
 | (1) |
3.4. Percentile Chart
- In other to obtain accurate statistics on the degree of health standard/Nutritional status in children, a percentile chart which serves as a standard for measurement is used for body weight/nutritional status determination.
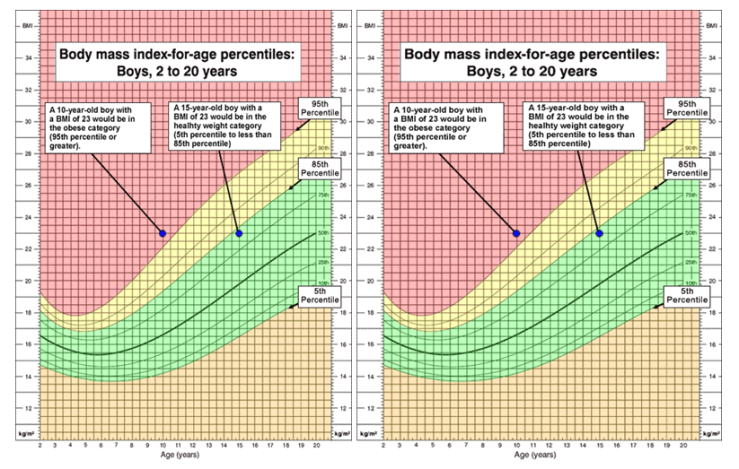 | Figure 1. (Body Mass Index for age percentile: 2 to 20years) |
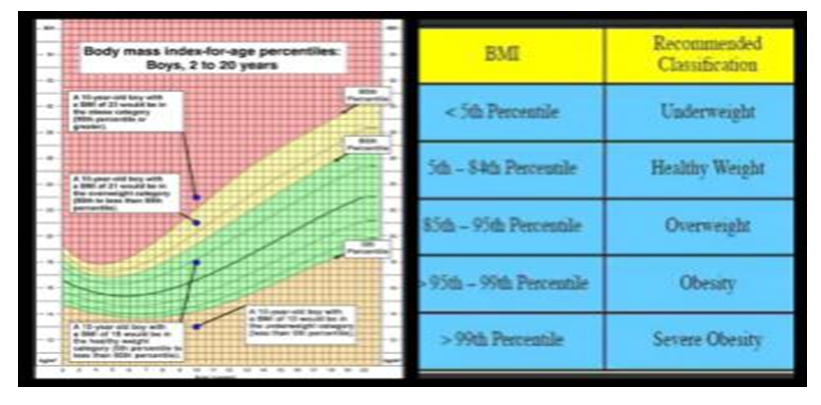 | Figure 2. BMI percentile charts |
 | (2) |
4. Results and Discussion
- Considering the importance of health check status together with measures needed to properly check the nutritional proficiency of diets being consumed by most children within the ages of four to ten year, using the BMI analysis the following was obtained;Body mass index analysis as a means of nutritional status determination for children between the ages of four to ten years might not be the most reliable means of nutritional status determination, but has a high degree of precision in analysis of health status determination.Among other means of nutritional status determination in children, the BMI analysis was discovered as being the most economical and fastest means of health status determination.Health/Nutritional status specification for children is usually determined using the percentile chart, with specifications that children who’s BMI value is below the 5th percentile are underweight/malnourished, those in between the 5th to 85 percentile have a normal weight/nutritionally stable, and those in between 85th to 95th percentile are overweight, while those above 95th percentile are obsessed. While for adults a specific standard is being used as yard stick for health status classification and the procedure for determining one’s health status from calculated BMI value is independent on age and sex.
5. Conclusions and Recommendations
- Height and weight are simple measures and have historically formed the basis of growth monitoring. Body mass index, which shows reasonably good correlations with more direct measures of adiposity and consistent linkages with adult overweight- and obesity-related co-morbidities, will likely continue to be the main measure of weight status in children. It is doubtful that we will gain much by further refinement of algebraic manipulations of height and weight. A more direct measure that reflects adiposity would be preferable, but the current alternatives are poorly suited to clinical or population research applications. Bioelectric impedance, arguably the most appealing proxy measure of adiposity for field use, is sensitive to hydration status, may vary by ethnicity, and requires instrument- and population-specific equations.Addition of an anthropometric indicator of central adiposity has been suggested. Several reference standards for waist circumference and waist–hip ratio have been developed and evidence is accumulating to suggest that these measures in combination with BMI may have utility for identification of those children whose high BMI has greatest health impact. The waist height ratio also shows some promise as useful measure of size-adjusted central adiposity.The addition of circumferential measures may help to address the major weakness of BMI: its inability to distinguish between elevated adiposity and elevated lean mass. From a public health perspective, the observation that from 1987 to 1997 waist circumferences of British children increased more than BMI suggests that surveillance by BMI alone may obscure important changes in body composition at the population level. Prospective studies that demonstrate that the addition of an indirect measure of central adiposity is more tightly linked to obesity-related health consequences than use of BMI-for-age alone would provide some of the justification needed to add further complexity to research applications and to weight-screening recommendations. As the evidence accrues, BMI-for-age continues to offer a valid and readily available measure for use in clinical and population-based applications. Widespread adoption of BMI-for-age in all three sectors will depend upon continued efforts to train individuals in the appropriate use of national and international growth references.Since the body mass index operation those not require any medical professional techniques, I recommend that parents and guardians should always adopt this means in continually examining the status of their kids, and this will help them in rationalizing their children daily diet.
ACKNOWLEDGEMENTS
- The team of researchers wishes to acknowledge TETFUND, Nigeria for sponsoring and facilitating this research. Also Federal Polytechnic Nekede, the host institution.