Rasaki Olawale Olanrewaju 1, Nafiu Lukman Abiodun 2, Abdisalam Hassan Muse 1, Thierno Souleymane Barry 1
1Pan African University, Institute for Basic Sciences, Technology and Innovation (PAUSTI), Kenya
2Department of Mathematics and Statistics, Kabale University, Kabale, Uganda
Correspondence to: Rasaki Olawale Olanrewaju , Pan African University, Institute for Basic Sciences, Technology and Innovation (PAUSTI), Kenya.
| Email: |  |
Copyright © 2021 The Author(s). Published by Scientific & Academic Publishing.
This work is licensed under the Creative Commons Attribution International License (CC BY).
http://creativecommons.org/licenses/by/4.0/

Abstract
Africa being one of the seven (7) continents is not exempted in the epidemic catastrophe of the respiratory virus called SARS-CoV-2 battling the world. Africa in its totality has been enforcing containment measures to prevent, curb, reduce and contain the widespread of the virus via social-distancing, curfews, economic lockdown in phases. In this paper, we modelled the course of action of the SARS-CoV-2 virus in Africa and its five regions at approximately a year (as at 23/02/2021) of the pandemic via a five transitional compartments SIERD (Susceptible → Exposed→ Infected →Recovery → Dead) model. The datasets for the number of confirmed cases of the virus as well as the number of recoveries and deaths due to the virus as at 23/02/2021 were extracted from Africa Centre for Disease Control (Africa CDC). It was carved-out from the SIERD model, that the rate of contracting the virus in Africa during each individual contact is 36.61%, while the rate in the Central, Eastern, Northern, Southern and Western parts were estimated to be 21.73%, 62.43%, 72.45% and 16.43 respectively. However, the recovery rate from the SARS-CoV-2 infection was 66.35% with Central, Western and Eastern regions dominating with 99.12%, 99.26% and 84.32% rates respectively. Lastly, the overall Infection Fatality rate in Africa was estimated to be 26.16%, while it carted across the Central, Eastern, Northern, Southern and Western regions with 15.3%, 20.4%, 31.6%, 39.4%, and 24.1% respectively.
Keywords:
Africa, Confirmed Cases, Infection Fatality Rate, SARS-CoV-2, SIERD model, Recovery Rate
Cite this paper: Rasaki Olawale Olanrewaju , Nafiu Lukman Abiodun , Abdisalam Hassan Muse , Thierno Souleymane Barry , Stochastic Modelling of the Dynamics of the SARS-CoV-2 Epidemic: An Africa Perspective, American Journal of Mathematics and Statistics, Vol. 11 No. 2, 2021, pp. 41-48. doi: 10.5923/j.ajms.20211102.03.
1. Introduction
Approximately a year and a month (January 7, 2020) after China Government pronounced the outbreak of the seventh new deadly human virus called SARS-CoV-2, otherwise known as Coronavirus (fondly called COVID-19), in Wuhan, central province of China. Four month later, precisely March 11, 2020, World Health Organization (WHO) declared a global pandemic, that was threaten to human life as a result of the continuous spread of the deadly virus Baud et al [2] and Zhou et al [16]. However, according to WHO (2020b) [14] as at February 26, 2021, there were over 113 million confirmed cases of the virus worldwide, 89 million people were reported to have recovered, while 2.5 million deaths were recorded. Out of the 2.5 million deaths that were recorded. Out of the 2.5 million deaths that were recorded. Africa as a continent has recorded more than 100,000 reported deaths due to the deadly virus as at aforementioned date WHO [13]. Though, China was badly hit at the start of the pandemic, but situation has now been alleviated towards tale end of 2020 while Europe and America keep recording increment in the number of confirmed cases of the affected by the respiratory virus Maradze et al [11]. The global pandemic of the SARS-CoV-2 virus would not be properly accounted for if Africa as a continent is left-out. Egypt was the first country in Africa to recorded a confirmed case of the virus on February 14, 2020, followed by Nigeria on February 27, 2020 when an Italian national flew to the country upon contaminated. The number of confirmed cases started increasing on Africa soil, with nearly all Africans who returned from China or European countries reported as a carrier of the virus. It was due to the increment that make WHO warned that, potentially 190 000 deaths could occur in Africa at the tail end of 2020 if measures to control the pandemic via international exposure is not taken WHO (2020c) [15].As at February 23, 2021, the number of confirmed cases of SARS-CoV-2 in Africa (record comprises of the registered 55 African Union (AU) Member States) amounted to 3,872,085, which represented 3.5% of the number of confirmed cases of the virus worldwide. The percentage of confirmed cases represented by each of the five Africa regions are: Central (5%), Western (19%), Northern (22%), Southern region (38%) and (16%). The active cases of the SARS-CoV-2 virus in Africa as the same date was collated to be 348,251, while 102,286 deaths were on record due to the virus and recoveries estimated to be 3,421, 548. South Africa happens to be the most hit Africa country with more than 1.5 million reported confirmed cases, followed by Morocco with 481,709. South Africa and Algeria are the country’s leading in the pool of active cases of the virus with 36,714 and 31,930 cases respectively Galal [6].
2. SARS-CoV-2 Epidemiology in Africa
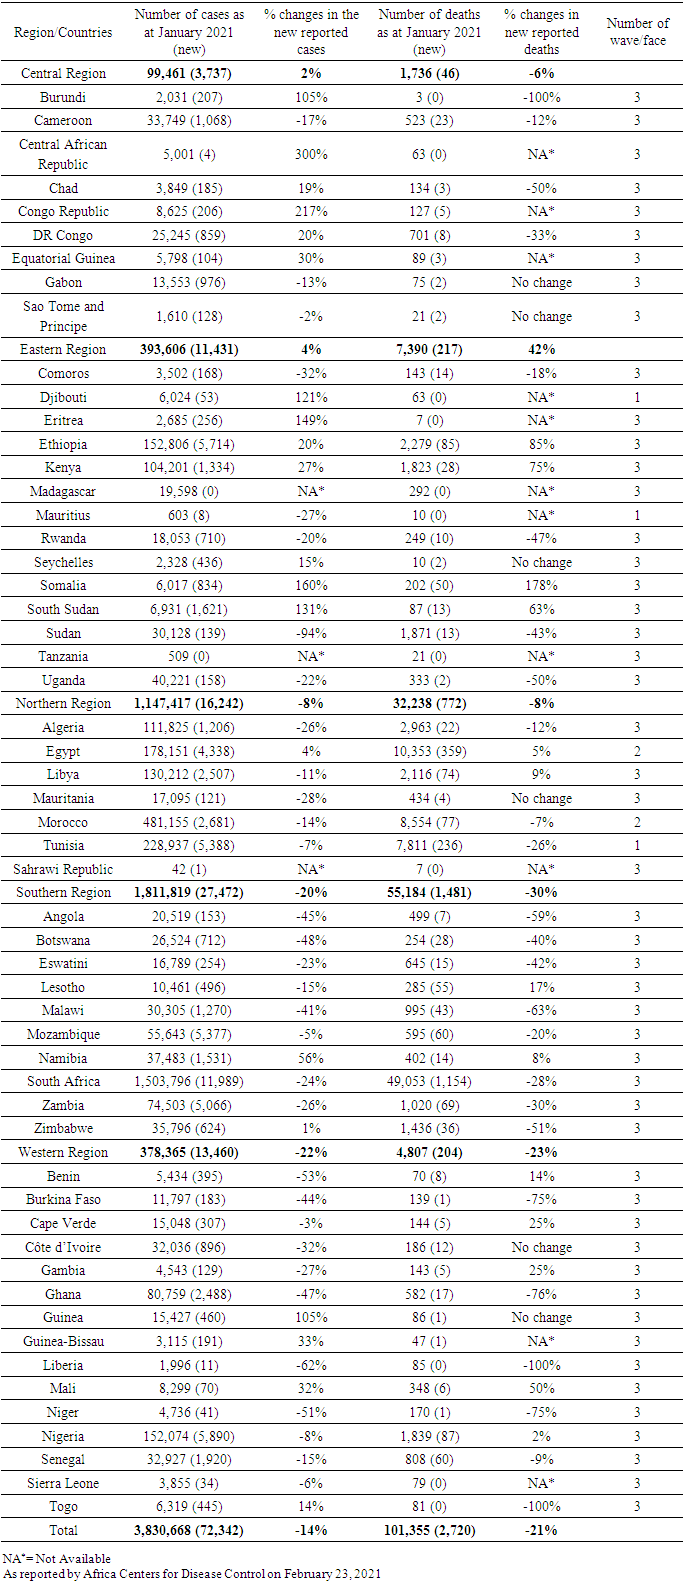
Having known that most African countries are developing countries, this article would be focusing on the epidemiological analysis, explanatory data analysis and statistical modelling of the SARS-CoV-2 virus on the continent of Africa as at February 23, 2021 (Approximately a year when WHO declared a global pandemic). Similarly, to the outbreak of Ebola virus in 2014 from Liberia that speedily spread across the nook and cranny of Africa countries, it took less than a month to confirmed infectious persons in Nigeria and Egypt. According to Karim et al. [8], the SARS-CoV-2 could be considered as one of the intense human pandemic ever faced in history of humankind. They affirmed that within three months of constant spreading of the virus, the illness had spread across the world. As the plague is still ongoing, the number of affected countries, confirmed cases, confirmed deaths and mortality rates increasingly changes day-by-day across the globe. Though, different countries with different phases of curbing the pandemic, with this complexity, the accurate epidemiology can only be possible at end of the pandemic, but that does not mean the demographical and epidemiological statistics cannot be estimated as at a particular period (especially at approximately a year). According to WHO [13], over 100,00 deaths due to the pandemic were recorded as at February 20, 2021. There was an upsurge of 40% deaths in Africa due to 22,300 deaths reported within the last 28 days compare to 16, 000 deaths recorded in the last but one month. Thirty-two (32) countries (countries like Algeria, Egypt, Morocco, Kenya, Nigeria etc.) reported a rise in number of deaths within last month (January, 2021), while twenty-one (21) countries (countries like Benin, Gabon, Tanzania, etc.) reported a falling rates. The rate of fatality due to the epidemic in Africa rose from 2.4% to 3.7% from December 2020, to February, 2021. It was noted that Africa mortality spike in the second wave that began around October, 2020, which attained it peak between 6th and 7th January 2021. Top on the list is South Africa that accounted for 48.3% casualties, followed by Egypt with 10.2% and Morocco 8.4% casualties of death in the continent. Unlike Tanzania and Zambia that jettisoned the report of their countries fatalities, twenty-three (23) other Africa countries’ epidemiology data on fatality rates were reported by Africa CDC [1] to be: Angola (2.5%), The Gambia (3.3%), Malawi (3.5%), Algeria (2.9%), Tunisia (3.6%), Sahrawi Republic (16.8%), Eswatini (4.0%), Lesotho (2.9%), Niger (3.9%), Sudan (6.4%), Zimbabwe (4.2%), Sudan (6.4%), Liberia (4.5%), Senegal (2.7%), Chad (3.8%), DR Congo (2.8%), Comoros (4.1%), Somalia (3.3%), Nigeria (6.7%), which in all contributed to 2.2% to world’s fatality rate.Table 1. Confirmed COVID-19 cases and deaths reported in Africa as at 23 February 2021
 |
| |
|
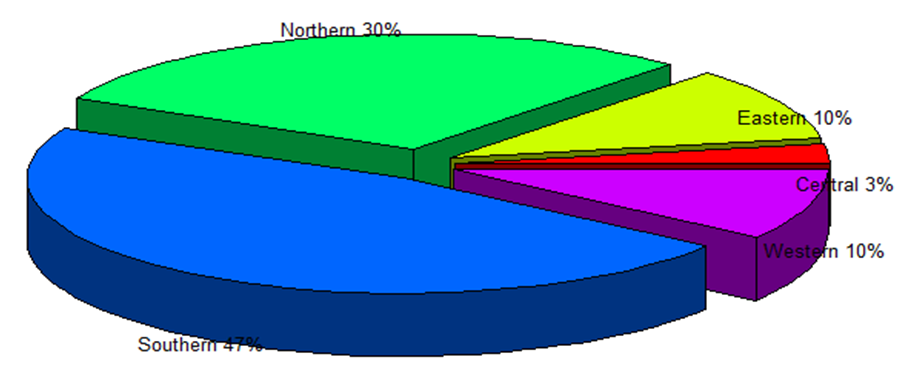 | Figure 1. Number of Confirmed Cases of COVID-19 per the Five Region in Africa as at 23/02/2021 (Source: Authors’ Computation (2021)) |
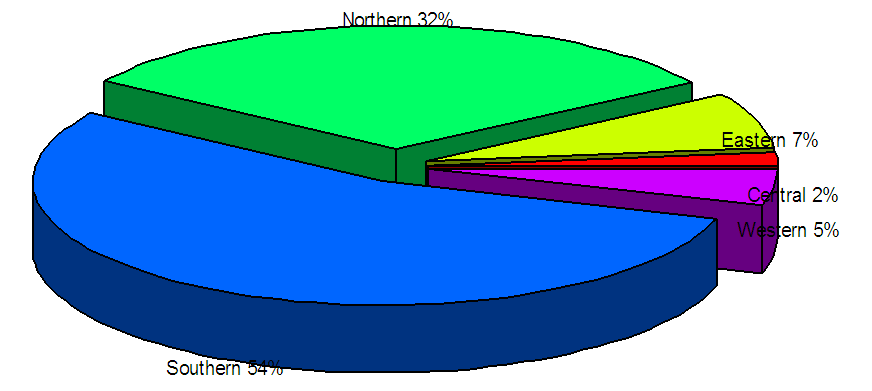 | Figure 2. Accounted Number of Deaths due to COVID-19 in African Five Regions as at 23/02/2021 (Source: Authors’ Computation (2021)) |
From figure 1 above, Southern region of the continent recorded the highest number of confirmed cases of SARS-CoV-2 with 47% of the overall pool of 3,872,085 in Africa as at 23/03/2021. Second in the continent that has recorded significant number of SARS-CoV-2 confirmed cases is the Northern part with 30%, while Eastern, Central and Western regions recorded a miniature of cases with 10%, 3% and 10% respectively. In a similar vein, from figure 2 above, Southern region of the continent dominated the number of casualties due to SARS-CoV-2 with 54% of the reported more than 100,000 deaths in Africa as at 23/03/2021. Second in the continent that has recorded significant fatalities due to the SARS-CoV-2 is Northern part with 32%, while Eastern, Central and Western regions recorded a miniature reported deaths with 7%, 2% and 5% respectively.
3. Estimation of the COVID-19 Transmission Rates
The effect of the exponential growth rate “r” of the confirmed cases of the SARS-CoV-2 virus in Africa from the first outbreak in Egypt till 23/02/2021 would be used to measure relative stages (three stages) of the outbreak. From figure 3 below, the accounted and confirmed cases of Africans within the continent that contracted the respiratory virus as at 23/02/2021 increased exponentially in the three wave faced that occurred in some African countries. The average (which is the second wave) wave will be used in estimating the growth rate. The growth rate was estimated implicitly with the onset growth rate r0 and it was estimated to be 0.912. The SARS-CoV-2 epidemic doubling time in Africa is to be estimated via  , which is equal to
  . The reading value of “r” from the graph is 1.65, that is, r = 1.65 per day (10), corresponding to a doubling time of 8 days approximately. The period of manifestation of the symptoms after contraction, that is, the period of incubation by contracted Africans is at least calculated to be 10 days. The mean of the incubation period was calculated to 13.5 days, with standard deviation of 0.02 and median days of 9 via log-normal distribution. It is to be noted that the incubation period is the source-recipient transmission pairs as the time between the infection of the source and the infection of the recipient which the same as the incubation period of 10 days approximately.
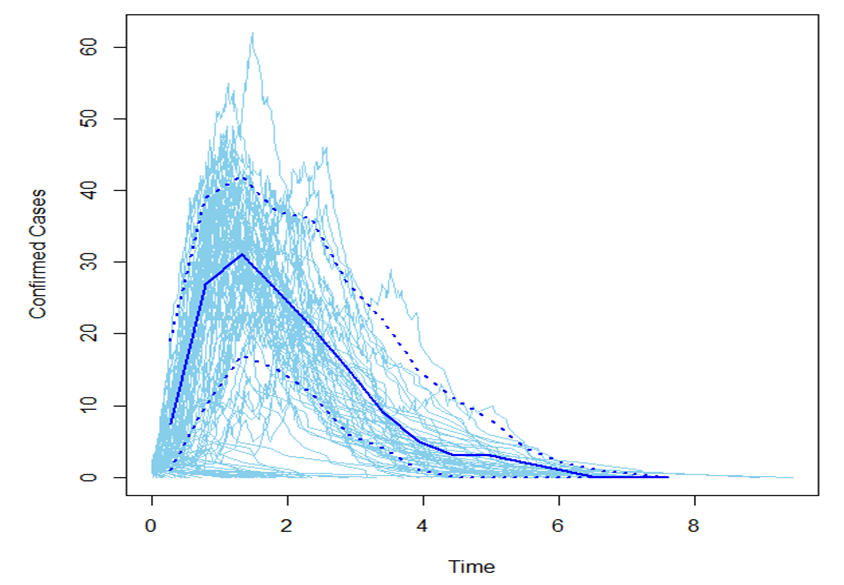 | Figure 3. Growth Rate of COVID – 19 Cases in three wave in Africa as at 23/02/2021 (Source: Authors’ Computation (2021)) |
4. An SEIRD Mathematical Model of SARS-CoV-2 Infectiousness in Africa as at 23/02/2021
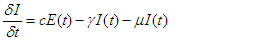
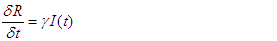
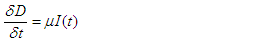
Representing and developing mathematical models for infectious diseases allow to extrapolate the transition of infectious diseases from onset of contracting the diseases to the current situation of either recovery or death Cherniha and Davydovych [4] and Kucharski et al. [10]. It also provides the useful insight into the dynamics progress of outbreak, progress, trend, predicting future rate of escalation and quantifying the predictions of the trend of diseases Bohner et al. [3] and Liu et al. [9]. Available data and minimum number of assumptions about the data do pose the dynamics structural and complexity of the model to be developed. The problem of parsimonious must be adequately put into consideration as well as the cognate and useful parameters to the model Tiwari et al. [12]. In this regard, we shall design a five (5) group model called SEIRD model to fit the SARS-CoV-2 epidemic of Africa so far. Though, SEIRD model is a modified and improve version of SIQR and SIR models. According to Cintra and Fontinele [5], the SEIRD model considered five (5) compartments: Susceptible, S(t); Exposed E(t); Infected l(t); Recovery R(t) and Dead D(t). However, represents the number of individuals not yet infected with the disease at time “t”.
 represents the number of individuals carrying the virus during its incubation period at time “t”.
 represents the number of individuals who have been infected by the SARS-CoV-2 virus and possibly capable of infecting those in the susceptible class.
  is the compartment used for those individuals who have been infected by the virus and have been removed from the category of infected either via immunization recovery.
 represents individuals that dead as a result of the SARS-CoV-2 virus. Graphically,
 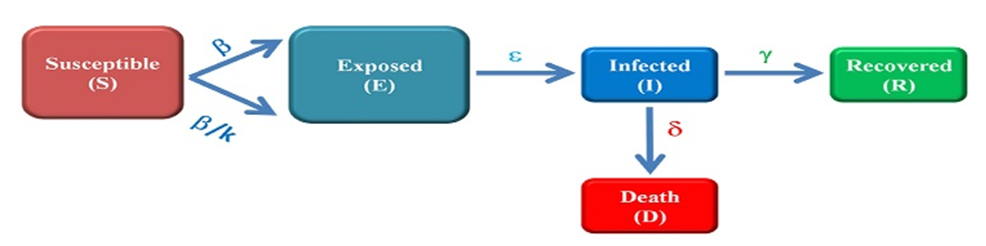 | Figure 4. Schematic Presentation of the SIERD Model |
The transition of the model could be represented as: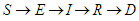 Using a fixed population at time “t”,
  | (1) |
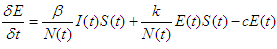
The model can be represented by the of differential equations: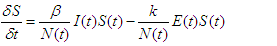 | (2) |
 | (3) |
 | (4) |
 | (5) |
 | (6) |
Where,  is the mean number of contacts amongst individuals multiplied by the probability of contracting the virus during each contact;
  is the incubation period
  is the rate of recovery which is proportional to the percentage of people who recover divided by the average time taken from the onset of symptoms to recovery;
  is death rate;
  is the infection rate which a small fraction of
  , that is,
  such that,
  determines the fraction of infections caused by exposed individuals.Alternatively, the death rate and recovery rate can be estimated via the Infection Fatality Rate (IFR),
  , that is,
 | (7) |
 | (8) |
where  and
and  are the mean time from onset of symptoms to death and recovery respectively.The dataset used was extracted from (Africa CDC)’s website and cleaned using EXCEL package. After the data cleaning process, the data analysis was done using R.
5. Results and Discussion
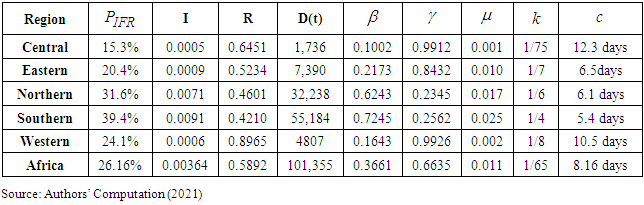
Table 2. Coefficients of the SEIRD Model
 |
| |
|
From table 2 above, which represents the estimated parameters of the SEIRD model, we fitted and analytically analyzed the SEIRD model for each of the five region in Africa with the datasets obtained from (Africa CDC) as at 23/02/2021. The piecewise βs (mean number of contacts amongst individuals multiplied by the probability of contracting the virus during each contact) in each region was estimated to be 21.73%, 62.43%, 72.45% and 16.43% for Central, Eastern, Northern, Southern and Western respectively. The rate of contracting the virus during each individual contact was high with 0.7245 in the Southern, while it was of 0.3661 in the whole continent as approximately a year. However, the rate of recovery  from the SARS-CoV-2 infection was dominantly encouraging from Central, Western and Eastern Africans with 99.12%, 99.26% and 84.32% rates respectively. Though, the rate of recovery has been superbly high compared to other continents as claimed by Lone and Ahmad [7], this was supported by the 66.35% rate of recovery in the continent. Moreover, the rate of death
  in the continent has been peculiarly of the bareness minimum with 0.011 (1.1%), in other words, Africa as a continent contributed to the world’s death due to the SARS-CoV-2 infection with just 1.1%, while the Northern part of the region dominated in the causalities with 2.5% and Central region contributed to the pool with just 0.1%. Additionally, the incubation period
  before the virus manifest after contracting was estimated to high in the Central region with 12.3 days, followed by Western region with 10.5 days and averagely of approximately of 9 days in the continent.
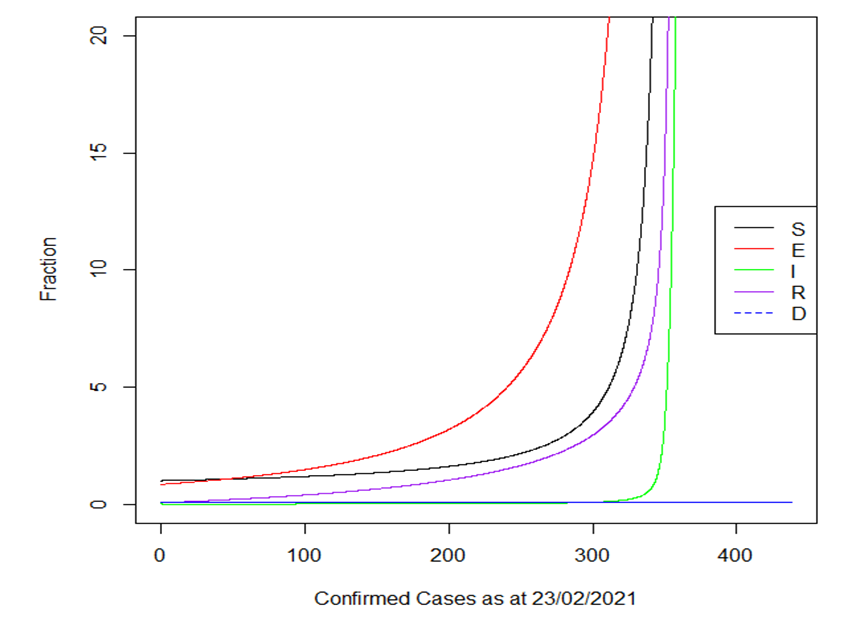 | Figure 5. Graphical Representation of the SIERD Model Rate of COVID-19 in Africa (Source: Authors’ Computation (2021)) |
The infection carte across the whole continent, but the infection rate  was approximated to be 1 of every 4 and 1 of every 6 persons in the Southern and Northern part respectively, while it was 1 of 8, 1 of 8, and 1 of 7 individual Africans across the Western, Central and Eastern part of the continent respectively at approximately after the pronouncement of the pandemic and epidemic. The infection rate in the whole was estimated to be 1 of 7 individual Africans as at approximately a year which was in collaboration of figure 5 above. The overall Infection Fatality rate
  in Africa was estimated to be 26.16%, which fairly connote one-fourth of the rate worldwide as at approximately a year, while it carted across the Central, Eastern, Northern, Southern and Western regions with 15.3%, 20.4%, 31.6%, 39.4%, and 24.1% respectively. Lastly, the recovery rate per Central region to Western region were 0.6451, 0.5234, 0.4601, 0.4210, and 0.8965 respectively, with an overall in the Black race with 0.5892.
6. Conclusions
In conclusion, the rate of contracting the virus during each contact at approximately a year of the epidemic is 36.61%. The rate of recovery from the SARS-CoV-2 infection was dominantly encouraging in Africa with 66.35%. So far, Africa as a continent has contributed to the world pool of deaths due to the SARS-CoV-2 infection with just 1.1%. The average incubation period for the SARS-CoV-2 infection to manifest after contracting the virus is around 9 days. Lastly, The overall Infection Fatality rate in Africa around 26.16% there about.
ACKNOWLEDGEMENTS
We wish to thank the reviewers.
References
| [1] | Africa CDC. COVID-19 dashboard. [cited 2021 Feb. 23]. Available from: https://africacdc.org/covid-19/ Center for Global Development. The economic impact of COVID19 in Africa: Around-up of the week, 2020. |
| [2] | D. Baud, X. Qi, K. Nielsen-Saines, D. Musso, L. Pomar, and G. Favre, “Real estimates of mortality following COVID-19 infection” The Lancet Infectious Diseases, Vol. 3(4), pp.1-14, 2020. https://doi.org/10.1016/S1473-3099(20)30195-X. |
| [3] | M. Bohner, S. Streipert, D.F.M. Torres, “Exact Solution to a Dynamic SIR Model. Nonlinear Anal. Hybrid” Systems, Vol. 32, pp. 228–238, 2018. |
| [4] | R. Cherniha, and V. A. Davydovych, “Mathematical Model for the COVID-19 Outbreak and Its Applications” Symmetry, Vol. 12, pp. 990, 2020. |
| [5] | H.P.C. Cintra and F.N. Fontinele, “Estimative of real number of infections by COVID-19 in Brazil and possible scenarios”. Infectious Disease Modelling, Vol. 5, pp. 720-736, 2020. https://doi.org/10.1016/j.idm.2020.09.004. |
| [6] | S. Galal, “Coronavirus active cases in Africa as of February 23, 2021, by country” Statista, 2021. www.statista.com. |
| [7] | S.A. Lone, and A. Ahmad, A. “COVID-19 pandemic – An African perspective” Emerging Microbes & Infections, Vol. 20, pp.1-28, 2020. https://doi.org/10.1080/22221751.2020.1775132. |
| [8] | W. Karim, A. Haque, Z. Anis, M.A. Ulfy, “The Movement Control Order (MCO) for COVID-19 Crisis and its Impact on Tourism and Hospitality Sector in Malaysia” Int. Tour. Hospitality J. Vol. 3, pp. 1– 07, 2020. |
| [9] | Y. Liu A.A. Gayle, A. Wilder-Smith, J. Rocklöv, “The reproductive number. of COVID-19 is higher compared to SARS coronavirus” Journal of Travel Medicine, Vol. 27 (2), 2020. https://doi.org/10.1093/jtm/taaa021. |
| [10] | A.J. Kucharski, T.W. Russell, C. Diamond, Y. Liu, J. Edmunds, S. Funk, R.M. Eggo, “Early dynamics of transmission and control of COVID-19: a mathematical modelling study” The LANCET Infectious diseases, Vol. 1(2), pp. 23-34, 2020. |
| [11] | T. Maradze, T. Nyoni, and S.P. Nyoni, “Covid-19 And Tourism Sector Dynamics in Africa: Challenges and Possible Solutions” IJARIIE, Vol. 6(6), pp. 1156-1176, 2020. ISSN(O)- 2395-4396. |
| [12] | V. Tiwari, N. Deyal, N.S. Bisht, “Mathematical Modeling Based Study and Prediction of COVID-19 Epidemic Dissemination Under the Impact of Lockdown in India” Front. Phys., Vol. 8, pp. 586-899, 2020. |
| [13] | World Health Organization. “Coronavirus disease (COVID-19) pandemic, WHO” 2021. Accessed from https://www.who.int/emergencies/diseases/novelcoronavirus-2019.on.february.2020. |
| [14] | World Health Organization, “Coronavirus Disease 2019 (COVID-19): Situation Report” WHO (2020b), (25 February 2020); www.who.int/docs/defaultsource/coronaviruse/situation-reports/20200225-sitrep-36-covid-19.pdf. |
| [15] | World Health Organization, “Non-pharmaceutical public health measures for mitigating the risk and impact of epidemic and pandemic influenza” WHO (2020c), 2019 [cited 2020 1 March]. Available from: https://apps.who.int/iris/bitstream/handle/10665/329438/9789241516839-eng.pdf?ua=1. |
| [16] | P. Zhou, X. L. Yang, X. G. Wang, B. Hu, L. Zhang, W. Zhang, “A pneumonia outbreak associated with a new coronavirus of probable bat origin” Nature, Vol. 2(2), pp. 12-24, 2020. https://doi.org/10.1038/s41586-020-2012-7. |

 Abstract
 Reference
 Full-Text PDF
 Full-text HTML