Nuri H. Salem Badi, Mohamed M. Shakandli
Faculty of Science, Statistical Department, University of Benghazi, Benghazi, Libya
Correspondence to: Nuri H. Salem Badi, Faculty of Science, Statistical Department, University of Benghazi, Benghazi, Libya.
| Email: |  |
Copyright © 2021 The Author(s). Published by Scientific & Academic Publishing.
This work is licensed under the Creative Commons Attribution International License (CC BY).
http://creativecommons.org/licenses/by/4.0/

Abstract
The general method of estimation the logistic regression parameter is maximum likelihood (ML). In a very general sense the ML method yields values for the unknown parameters that maximize the probability of the observed set of data. Much work discusses the behaviour of the distribution of Maximum likelihood estimates (MLE) for the logistic regression model under the correct model. However, many issues still need more examination as the relationship between the links of the logistic function and the skew-normal distribution which consider in this work. In this paper, our work considers this behaviour and investigates the MLE method under the logistic regression model when the wrong model has been fitted and the assumption on covariates are violated. We will consider this behaivuor and the covariates drawing from a non-normal distribution and evaluate it by simulation.
Keywords:
Logistic regression model, Maximum likelihood method, Skew-normal distribution, Probit function and expit function
Cite this paper: Nuri H. Salem Badi, Mohamed M. Shakandli, The Maximum Likelihood Estimates with Wrong Logistic Regression Model and Covariate Assumptions are Violated, American Journal of Mathematics and Statistics, Vol. 11 No. 1, 2021, pp. 18-25. doi: 10.5923/j.ajms.20211101.03.
1. Introduction
The subject of the behaviour of maximum likelihood estimation (MLE) method in logistic regression model has attracted the attention of many scientists and researchers. [6] developed the analysis of the binary data and application of the maximum likelihood: see also [7]. [11] introduced the generalized linear model and used special techniques to obtain the maximum likelihood estimates of the parameters, with observations distributed according to some exponential family. [10] discussed the generalized linear model and behaviour of the maximum liklihood (ML) method for binary outcome. [5] discused method used a modified score function to reduce the bias of the maximum likelihood estimates. The ML method under the wrong logistic model has been discussed extensively by [9, p.23]. The idea is to try to find in terms of the true parameters of the model the least false values which are obtained by maximising the incorrect likelihood function. We will use the relationship between  function and probit function
  , and use the properties of the multivariate skew-Normal distribution to compute a good approximation to the least false values under wrong logistic model. The behaviour of MLE for binary outcome has been discussed more extensively by [10]. The logistic model when
  with
with  can be fitted using the method of maximum likelihood to estimate the parameters. The first step is to construct the likelihood function which is a function of the unknown parameters and data, then choose those values of the parameters that maximize this function. The log-likelihood function is:
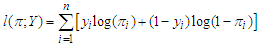 Where, in this case we have
 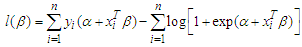 where
where  is a
is a  -dimensional vector,
  are a vector of covariates for
  individual and
  . To estimate the parameters
  and
and  we differentiate the log-likelihood function with respect to
  and
and  . If the fitted model is the true model then, the asymptotic distribution of
  is
is 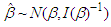 where
where  is the
  Fisher's information matrix, its
  element is defined as
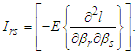 If is evaluated at MLE
  .
.
2. MLE Under the Wrong Model
[9] discussed how the maximum likelihood method used to estimate the parameters of a given regression model is affected when the assumed model is incorrect. If the data are independent and identically distributed, the log likelihood function in case of the density  for an individual observation, we can write as:
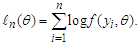 The important question here is, if we fit a model for
  as
as  when true model is
  , what value do we estimate for
  ? We have for each value of
  , by the weak large numbers, in probability, as
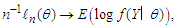 The Kullback-Leibler
  divergence is
 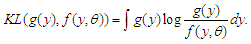 | (1) |
For model  , we need to solve likelihood function and find the least false parameter
  which minimises
  , then
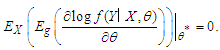 | (2) |
Application to Logistic RegressionNow, we will apply the MLE method under wrong model on logistic regression model. The idea is to use this method to obtain equations which determine the least false value  for a logistic regression. To explain the behaviour of the MLE in this case we will partition of the vector covariates
  , as previous
  . The fitted model is
 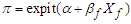 However, this model is wrong because the true model is.
 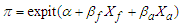 So, expectation of the ML equations are zero when
  . From the above equations where
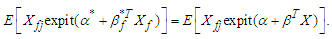
  is binary, the expectation in this case becomes
  and
and The
The  is
is  and this is given by the true model
 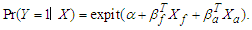 But we fit the model without
  . The least false values,
  and
and  , can be found in terms of
  and
and  and the parameters of the distribution of the covariates as from
 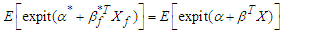 | (3) |
 | (4) |
where,  is the
  element of
 . These equations can be solved approximately if
  follows a multivariate normal distribution, by approximating
  and using the skew-normal distribution. In fact, the previous work considers by [14], discussed the inconsistent treatment estimates from mis-specified logistic regression analyses of randomized trials. In this paper, we are interested in more investigate the behaviour of MLE under the wrong mode when covariate assumptions are violatedl and assessment by simoulation.Skew-Normal DistributionThe skew-Normal distribution has been discussed by [3] and [4]. More discussion and numerical evidence of the presence of skewness in real data by [17] and [2]. Other discussion for quadratic forms and flexible class of skew-symmetric distribution discussed by [12] and [8] also, by [16]. A random variable
  is called skew normal with parameter
  , so
, so  , if its density function is :
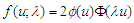 | (5) |
where  ,
,  and
and  are the density and distribution function of standard normal distribution respectively, that defined by [3]. In general case, [1], discussed extends the skew normal distribution and properties of this family. We can defined the extend multivariate skew-normal distribution as; a
  -dimensional random variable
  has extended skew-normal distribution,
  , if it has density:
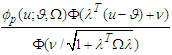 where
where  is a scalar,
  is dispersion matrix has
  dimensional and parameters
  and
and  are
are  -dimensional. The
  is the density of a
  -dimensional normal variable with mean
  and dispersion matrix
  where
where  is the cumulative distribution function of a univariate standarad normal variable.Probit Function and expit FunctionWe are consider the approximation of
  by
by  , the distribution function of a standard normal variable. [15] reported that, the logistic distribution closely resembles the normal distribution which discussed the shape of distribution both are symmetrical and noted some properties. [13, p.5], point out the comparison of logistic and normal cumulative distribution function. The approximation form defined as:
  , where
  .
.
3. Least False Values Under Wrong Logistic Model
The main point is, suppose that we model a binary outcome,  , using a logistic regression, i.e.
 but that the true model includes more covariates, i.e.
 Now, to find the least false values in terms of parameters of the true logistic model, use the approximation form
  , properties of the skew-normal distribution and we use the two equations which determine the MLEs, as we have discussed in section 2 about MLE under the wrong model to find the least false values. Let us assume that X has
  -dimensional multivariate Normal distribution, where
  and
and  denote the dimensions of
  and
and  respectively. The presence of an intercept in the above models means that we may assume, wlog, that
  . If
. If  , then also suppose that the partition of this matrix corresponding to
  and
and  is:
is: then we can apply the approximation to (3) and (4) using
  , which this leads to
  | (6) |
Now we use the properties of skew-normal distribution, in this case the density function of skew-normal distribution where  is
is 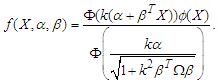 Then we can write the (6) as
 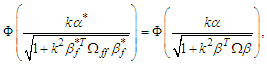 which is
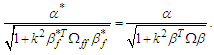 | (7) |
Turning our attention to (4) and using the results for the expectation of a SN distribution, we obtain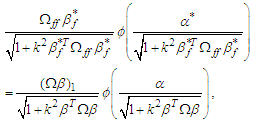 | (8) |
where  is the standard Normal density, and
  denotes the first
  elements of
  , which is
  . Using the result in (7), we can simplify (8) and finally, we can follows that
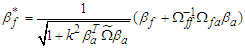 | (9) |
and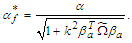 | (10) |
where 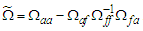 . From this we get Note that (9) includes a denominator, such that
  even when
  , although, of course,
 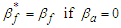 .
.
4. Simulation Study when the Covariates Follow Normal Distribution
The goal of this simulation, is to assess the approximation computed for the least false values for logistic regression model. We are interested to application on case of the covariates generated by multivariate Normal distribution. Applied on different cases with different variance and different correlation to check on the behaviour of the formulae of the least false values under wrong model. We looking in this simulation for check the approximation of the last false values for a true logistic regression model has five covariates  is
is where,
  and in the fitted model there are two covariates. We designed the simulation as follows:• We choose
  as a draw from the multivariate normal distribution
  .• We consider the
  covariance matrix
  is
is where,
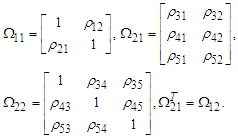 • Use two different variance
  • We consider 3 different cases of correlation which is each case of
  has same
  designed as: (0.2,0.2,0.4), (0.8,0.7,0.9), (0.2,-0.2,-0.2). Values are chosen to assume
  is positive definite.• We choose the parameters
  and
and  to give us two cases
  and
and  . As calculate the unconditional
  by properties skew-normal distribution we get,
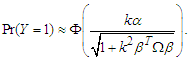 Choose
  and adjust
  , so that over the covariates
 and
and 
 .• The sample size has been used
  ,
,  and
and  number of simulation.
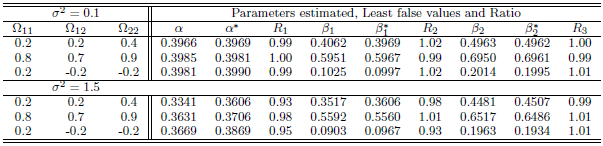
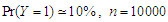
4.1. Results and Discussion
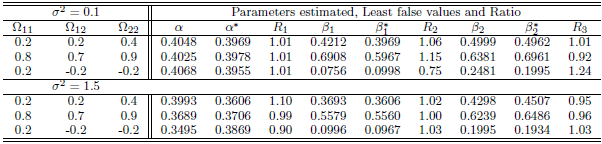
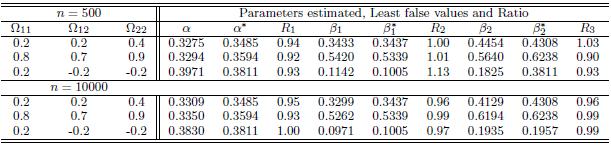
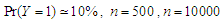
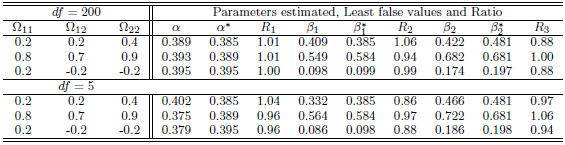
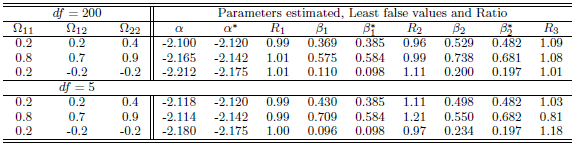
We report the accuracy of the estimation parameters of the wrong logistic regression model has two covariates when the true model has five covariates. Tables shows comparison between the least false values which is computed by approximation of  and skew-Normal distribution properties and values of estimated parameters by fitted logistic regression model.
  denote the ratios of the mean of the simulated fits to the comuted last false value. Table 1 and Table 2, shows the results of simulation of data generated by multivariate Normal distribution in cases of
  and
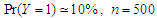
and  respectively with sample size
  . Table 3 and Table 4, shows the results of simulation with sample size
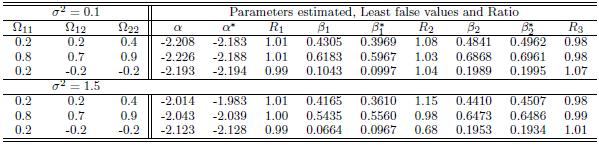
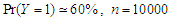
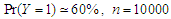
  . We can see clearly the results show ratios close to one. The same behaviour results found in both cases of
  and
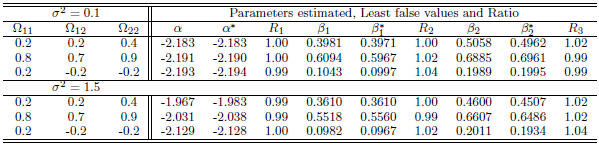
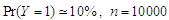
and  , where is the ratio found close to one. That is meaning the approximation form of the least false values works well, although the probability of outcome
  is very low about 10%, but a good results and reasonable behaviour have been found. Some issues of low ratio a raised in case of sample size
  , that there are some estimated values were very small close to zero which affect on ratio. Moreover, the parameter selection and correlation selection may be having slightly affected in a few cases.
Table 1. Simulation results of last false values by multivariate Normal distribution in case
 and and
 denote to the Ratio denote to the Ratio
 |
| |
|
Table 2. Simulation results of last false values by multivariate Normal distribution in case
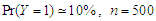 and and
 denote to the Ratio denote to the Ratio
 |
| |
|
Table 3. Simulation results of last false values by multivariate Normal distribution in case
 and and
 denote to the Ratio denote to the Ratio
 |
| |
|
Table 4. Simulation results of last false values by multivariate Normal distribution in case
 and and
 denote to the Ratio denote to the Ratio
 |
| |
|
5. Covariate Assumptions are Violated
The previous analysis discussed the least false values with multivariate covariates, the simulation providing us reasonable results. That was applied to covariates draw from multivariate normal distribution. In this part we are interested to consider the model with symmetric distribution different from multivariate normal distribution. As we know, the behaviour of the MLE maybe affected by the assumption of normality on the covariates. So we will consider two of symmetric multivariate distribution, say,  -distribution and multivariate uniform distribution.
5.1. Simulation of Multivariate t and Multivariate Uniform Distribution
The goal of this simulation is to use the same computed formulae of the last false value which used in the previous analysis, to assess the approximation computed for the least false values for logistic regression model and with multivariate  and uniform distribution. We use the same assumption which used in previous simulation, let consider we have a true logistic regression model which has five covariates
  is
is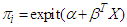 • We choose
  as a draw from one of two multivariate distribution; either- Multivariate Uniform distribution, or Multivariate
  -distribution.• We are generating multivariate Uniform covariates by related with standard Normal distribution as:-
  where
where  is the correlation matrix.-

 , (element wise) and
 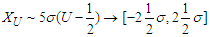 .• We consider the
  covariance matrix
  is
is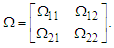 As we know, the mean of the uniform distribution is
  and the variance is
  . So, in this case we have
  and
and 
 , where the covariance is
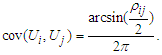 Then, the components of covariance matrix
  are
are 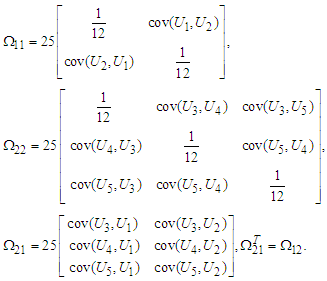 • We generating multivariate t-distribution with various value of degrees of freedom
  , which changes the shape of the distribution, we choose two cases
  and use two different variance
  in each case.• Use the same assumption on which used in the priviouse simulation: correlation and variance, also use
  and
and  with sample size
  and
and  number of simulation.
5.2. Results and Discussion
The results concerning two simulation data generated by multivariate Uniform distribution and multivariate  -distribution. The results of this simulation with Uniform distribution, showed in Table 5 and Table 6, in cases of
  and
and  respectively with two sample size
  ,
,  . The same results appeared, the ratio found nearly close to one in almost cases. A few cases appeared low ratio in case of sample size
  , which there are some estimated value were very small (i.e, when
  the parameter estimated was
  and the ratio was
  ). In general we found the least false values in this case have the same behaviour of the multivariate normal covariates. The results of the second part of this simulation, concerning for results of data generated by multivariate
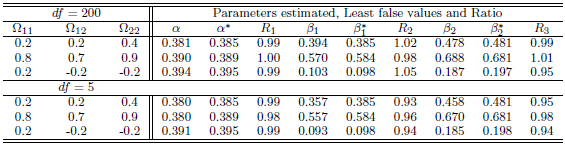
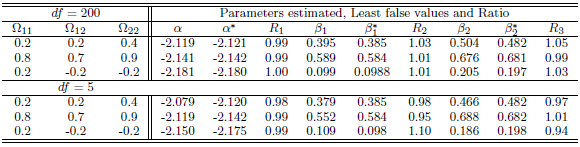
  -distribution which showed in Table 7 and Table 8 in cases of
  and
and  respectively with sample size
  . Table 9 and Table 10 shows the results in case of sample size
  . The results of four cases with different degree of freedom
  and one case of variance has been used
  . Comparing these results with case of Normal distribution, more clearly when the degree of freedom larger enough we can reported that the results have the same behaviour. Moreover, we can say that the ratio appeared nearly close to one in all cases of correlation and degree of freedom, some slightly differences with low ratio appeared in few cases when degree of freedom is
  and
and  , which have the same behaviour found in case of the normal multivariate covariates when the estimated value was very small.
 Table 5. Simulation results of last false values using different values of
 by generated variables from multivariate Uniform distribution in case by generated variables from multivariate Uniform distribution in case
 and and
 denote to the Ratio denote to the Ratio
 |
| |
|
Table 6. Simulation results of last false values using different values of
 by generated variables from multivariate Uniform distribution in case by generated variables from multivariate Uniform distribution in case
 and and
 denote to the Ratio denote to the Ratio
 |
| |
|
Table 7. Simulation results of last false values by multivariate t-distribution in case
 and and
 denote to the Ratio denote to the Ratio
 |
| |
|
Table 8. Simulation results of last false values by multivariate t-distribution in case
 and and
 denote to the Ratio denote to the Ratio
 |
| |
|
Table 9. Simulation results of last false values by multivariate t-distribution in case
 and and
 denote to the Ratio denote to the Ratio
 |
| |
|
Table 10. Simulation results of last false values by multivariate t-distribution in case
 and and
 denote to the Ratio denote to the Ratio
 |
| |
|
Overall, if we assume normality on covariates, but the covariates are drawn from a multivariate  -distribution with variety of degree of freedom and multivariate Uniform distribution, which use large sample size
  . We found that, for different combination of correlations and variances, are appeared the results from (9) and (10) still appear to hold.
6. Conclusions
The goal of this paper considers to investigate the behaviour of the MLE and find a formula to compute the least false values when the wrong logistic model has been fitted. Moreover, we examined the behaviour of the model when the assumption on covariates are violated. Corresponding to the simulation analysis, we found a good results in all cases when the covariates are drawn from the multivariate normal. The results appeared the MLE has reasonable behaviour with the least false values in case of wrong model, which computed in terms of the true parameters. On the other hands, we have applied the results defined in (9) and (10), which assumed covariates were multivariate normal, when the covariates do not follow this distribution. Again the results derived in (9) and (10) gave accurate answers. We consider five dimensional multivariate uniform and t-variables when only two covariates were fitted. In fact, we can see clearly that, both the low probability of outcome Y and the sample size have affected on the estimated value of parameters. In the case of the large sample size, the standard error will be close to zero and the ratio close to one. In contrast, the standard error will be increases and the ratio will be appear faraway from one in some cases of small sample size. The results showed that for these symmetric non-normal variables, the violation of the assumption of normality made little difference. Some discrepant were noticed when the value of coefficients were very small close to zero.
References
| [1] | Arnold, B.C. and Beaver, R.J. (2000). Hidden Trunction Models. The Indian Journal of Statistics, 62, 23-35. |
| [2] | Azzalini, A. (2005). The Skew-normal Distribution and Related Multivariate Families. Journal of Statistics, 32, 159-188. |
| [3] | Azzalini, A. (1985). A Class of Distribution Which Includes the Normal Ones. Scan- dinavian Journal of Statistics, 12, 171-178. |
| [4] | Azzalini, A. (1986). Further Results on A Class of Distribution Which includes the Normal Ones. Statistica, 46, 199-208. |
| [5] | Badi, N.H.S. (2017). Properties of the Maximum Likelihood Estimates and Bias Reduction for Logistic Regression Model. Open Access Library Journal, 4, e3625. |
| [6] | Cox, D. R. (1970). Analysis of Binary data. Chapman and Hall, London. |
| [7] | Cox, D. R. and Snell, E. J. (1989). Analysis of Binary data. Chapman and Hall, New York. |
| [8] | Chiogna, M. (2004). Ma, Y. and Genton, M. G. Scandinavian Journal of Statistics, 31, 459-468. |
| [9] | Claeskens, G. and Hjort, N. L. (2008). Model Selection and Model Averaging. Cambridge University Press. |
| [10] | McCullagh, P. and Nelder, J. A. (1989). Generalized Linear Models. Chapman and Hall, London, 2nd. |
| [11] | Nelder, J. A. and Wedderburn, R. W. M. (1972). Generalized Linear Models. Journal of the Royal Statistical Society, series A, 135, 379-384. |
| [12] | Loperfido, N. (2001). Quadratic Forms of Skew-normal Random Vectors. Statistics and Probability Letters, 54, 381-387. |
| [13] | Johnson, N. L. and Kotz, S. (1970). Continuous Univariate Distributions. Wiley- Interscience Publication, U.S.A. |
| [14] | Matthews, J. N. S. and Badi, N. H. (2015). Inconsistent treatment estimates from mis-specified logistic regression analyses of randomized trials. Statistics in Medicine, 34, 2681-2694. |
| [15] | Gumbel, E. J. (1961). Bivariate logistic distributions. Journal of the American Statistical Association, 56, 335-349. |
| [16] | Hill, Henze, N. (1986). A Probabilistic Representation of the Skew-normal Distribution. Scandinavian Journal of Statistics, 13, 271-275. |
| [17] | Hill, M. A. and Dixon, W. J. (1982). Robustness in Real Life. Biometrics, 38, 377-396. |

 Abstract
 Reference
 Full-Text PDF
 Full-text HTML