-
Paper Information
- Paper Submission
-
Journal Information
- About This Journal
- Editorial Board
- Current Issue
- Archive
- Author Guidelines
- Contact Us
American Journal of Mathematics and Statistics
p-ISSN: 2162-948X e-ISSN: 2162-8475
2020; 10(4): 102-108
doi:10.5923/j.ajms.20201004.02
Received: Nov. 13, 2020; Accepted: Nov. 30, 2020; Published: Dec. 5, 2020

Factors Affecting Americans Engagement in Physical Activities — An Application of Logistic Regression Model to ATUS Survey Data
 Abstract
 Reference
 Full-Text PDF
 Full-text HTML
Khairul Islam
Department of Mathematics and Statistics, Eastern Michigan University, Ypsilanti, MI, USA
Correspondence to: Khairul Islam, Department of Mathematics and Statistics, Eastern Michigan University, Ypsilanti, MI, USA.
| Email: |  |
Copyright © 2020 The Author(s). Published by Scientific & Academic Publishing.
This work is licensed under the Creative Commons Attribution International License (CC BY).
http://creativecommons.org/licenses/by/4.0/

Engagement in physical activity (PA) contributes to improved health outcomes and benefits. The American Time Use Survey (ATUS) is an indispensable data resource for Americans engagement in PA due to engagement in sports and exercise activity. This paper investigates factors of Americans engagement in PA and measures the effect of these factors by implementing Chi-square test and logistic regression analysis with appropriate survey weight. The study reveals that only 18.8% Americans 15 years and older are engaged in PA. Bivariate analysis suggests that socio-demographic factors such as gender, age, family income, education, ethnicity, marital status, geographical region and living quarters are significant factors (chi-squared p-value<0.05) of Americans engagement in PA. Adjusted and unadjusted logistic regression analyses reveal that gender, income, education, ethnicity and geographical region are significant (chi-squared and F-tests p-value<0.05) factors of engagement in PA. Adjusted (multiple logistic regression) analysis reveals the significance and risk of non-engagement in PA for various factor levels compared to a reference level adjusted for other factors via 95% confidence interval (CI) for related odds ratios (OR) estimates. In adjusted analysis, the OR estimates suggest that females are significantly 1.19 times more likely to be non-engaged in PA compared to males (95% CI: 1.02-1.39) since the CI estimate does not include 1. Using the reference income of $75,000+, Americans with income <$25,000 and $25,000-$49,999 are significantly about 1.4 times (95% CI: 1.09-1.83) and 1.5 times (95% CI: 1.18-1.83) more likely to be non-engaged in PA. Using Master+ (Master’s degree and above) as a reference category, Americans with education <HS are significantly 1.86 times (95% CI: 1.48-2.33) and those having some college or associate degrees are 1.66 times (95% CI: 1.34-2.05) more likely to be non-engaged in PA.
Keywords: American Time Use Survey, Physical activity, Chi-squared test, Logistic regression model, Risk analysis
Cite this paper: Khairul Islam, Factors Affecting Americans Engagement in Physical Activities — An Application of Logistic Regression Model to ATUS Survey Data, American Journal of Mathematics and Statistics, Vol. 10 No. 4, 2020, pp. 102-108. doi: 10.5923/j.ajms.20201004.02.
Article Outline
1. Introduction
- As per the Physical Activity Guidelines for Americans [1], regular physical activity (PA) is one of the most important actions people can do to improve their health. It improves physical function among individuals of all ages, enabling them to conduct their daily lives with energy and without undue fatigue. In addition to improving physical function, it may improve cognitive function among youth and adults which includes memory, attention, executive function (the ability to plan and organize; monitor, inhibit, or facilitate behaviors; initiate tasks; and control emotions), and academic performance among youth [1]. Physical activity results in many health benefits such as lowering risk and severity of chronic diseases (including heart disease, diabetes, and some cancers), lowering mortality rates, and improving mental health and physical well-being [2]. Yet many Americans do not comply with the guideline recommendations [1-2]. In this study, we investigate what socio-demographic factors affect Americans engagement in physical activity due to engagement in sports and exercise activities using the American Time Use Survey (ATUS) 2019 data. ATUS collects activity information for each reported activity in a 24-hour day in 17 broad categories along with their coding information [3-6]. These categories are (1) Personal care, (2) Household activities; (3) Caring for and helping household members; (4) Caring for and helping non-household members; (5) Work and work related activities; (6) Education; (7) Consumer purchases; (8) Professional and personal care services; (9) Household services; (10) Government services and civil obligations; (11) Eating and drinking; (12) Socializing, relaxing, and leisure; (13) Sports, exercise, and recreation; (14) Religious and spiritual activities; (15) Volunteer activities; (16) Telephone calls; and 17) Traveling. The ATUS is a significant data source of physical activity information of Americans 15 years and older due to various socio-demographic factors of the participants. The physical activity refers to any bodily movement produced by the contraction of skeletal muscle that increases energy expenditure above a basal level ([1], [7]). It includes any subset of physical activity that enhances health. Physical activity time includes active (not spectator) sports, exercise, and recreational activities [2]. In this study, physical activity will be measured from the participation of respondents in active sports, exercise and recreational activities, by excluding any utilitarian physical activity such as physical effort for work or household tasks. We extract physical activity information of Americans 15 years and older and the distribution of such activity due to socio-demographic factors, and investigate how age, gender, ethnicity, income and other socio-demographic factors affect engagement in sports and exercise activity. As analytical tools, we incorporate chi-squared tests for independence between response and socio-demographic factors. In order to assess the risk and significance of non-engagement in physical activity for various factor levels compared to a reference level, we employ simple and multiple factor logistic regression analysis in the presence of survey weights.
2. Methods and Models
- The utilization of the ATUS data requires merging multiple data sets, recoding data values and the weighted data analyses techniques to accommodate appropriate survey weight. In this section, we introduce the data description together with data merging, recoding of various socio-demographic factors and statistical models that are being utilized in this paper.
2.1. Data Description
- We utilize ATUS 2019 data for analysing significance of socio-demographic factors of Americans 15 years and above affecting Americans engagement in physical activity due to engagement in sports and exercise activity. For the purpose of the desired analysis, we merge three ATUS 2019 datasets—activity file, activity summary file and ATUS-CPS file by using the common identification characteristic called TUCASEID. The response and various socio-demographic factors in this study are generated from the merged data file as follows:Response: We create a binary response variable called the physical activity (PA) engagement due to engagement in sports and exercise activities. The response PA takes a value of 0 for non-engagement and 1 for engagement in any sports and exercise activity evaluated by using the six-digit activity code (TRCODE, from the activity data file). The TRCODE with values between 130100 and 130136 defines the physical activity engagement status of 1 due to engagement in sports and exercise activity, and the engagement status 0 is defined otherwise. The details about the ATUS assigned 6-digit activity code are available in the ATUS Activity Lexicons Coding Manuals [8]. Socio-demographic factors: In order to investigate the effect of various socio-demographic factors, we extract potential factors from the ATUS data files. The activity summary data file has been used to recreate gender and age group variables. The sex is created using the TESEX variable with values 1=male and 2=female. The variable age (age group) is created by recoding the values of the variable TEAGE with values 15-29, 30-44, 45-69 and 70+ as distinct groups.Most of the factors in the study are derived from the ATUS-CPS data file. The education (educational status) is created by recoding the values of the variable PEEDUCA with values < HS, Some col./ass. (Some college or Associate’s degree), Bachelor (Bachelor’s degree) and Master+ (Master or Higher) as distinct groups. The factor income (family income) is created by recoding the values of HEFAMINC with values <25,000, 25,000-49,999, 50,000-74,999, 75,000+ for four groups. The factor ethnicity is defined from PTDTRACE with values 1=White only, 2=Black only, 3=Hispanic only and 4=Others. The region (geographical region) is derived from GEREG with recoded values 1=Northeast, 2=Midwest, 3=South, 4=West. The variable LFP (Labor Force Participation) is created using PRCIVLF with values Yes=In civilian labor force, No=Not in civilian labor force. The variable marital (marital status) is derived from PEMARITL with values 1=Married, 2=Widowed, 3=Divorced/Separated and 4=Never married. The nativity is derived from PRCITSHP with values 1=Native, 2=Naturalized citizen (Nat-citizen) and 3=Not a citizen (non-citizen). The variable quarters (living quarters) is taking values 1=Owned, 2=Rented (Rented for cash) and 3=Occupied (Occupied without cash). The categorization of factors utilized in the study is consistent with those used by the U.S. Bureau of Labor Statistics [9].Survey weight: The ATUS uses weights to compensate for the important aspects of the sampling and data collection process due to stratification, non-uniformity of sample across the days of week or demographic groups, so as to represent each group correctly [5]. The ATUS weight variable TUFINLWGT appears in the activity summary data file has been utilized in all analyses in this study.
2.2. Association of Factors
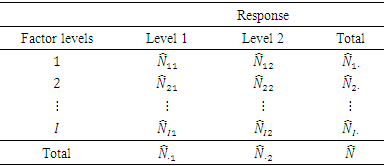
- Initially, we test the null hypothesis of independence or no association between the engagement in physical activity (due to engagement in sports and exercise activities) and various socio-demographic factors. For the test of no association, we analyse two-way cross-classified table with
 levels or categories (rows) of an underlying socio-demographic factor and 2 levels or categories (column) of the response PA, with level 1 referring to PA=0 (non-engaged in PA) and 2 referring to PA=1 (engaged in PA). The null and alternative hypotheses involved for the association test are of the form:
  There is no association between physical activity engagement status and a given socio-demographic factor
 There is an association between physical activity engagement status and a given socio-demographic factorWe test the hypothesis of no association or independence between physical activity and each socio-demographic factor via chi-squared tests [10]. Due to the survey weight associated with the ATUS data, we performed weighted chi-squared test for the independence of two-way table generated by the cross-classification of an underlying factor due to the dichotomous response. The form of cross-classified table of
  cells in this study is as presented in Table 1. In Table 1,
  is the estimate of total weights of all subjects falling in
  cell, with subject j receiving the survey weight
  available due to the survey weight variable TUFINLWGT.
|
 is given by
 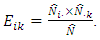 Then, given a sample of n subjects, the test of no association or independence between a response and a given socio-demographic factor is given by
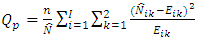 | (1) |
 follows a Chi-squared distribution with degrees of freedom
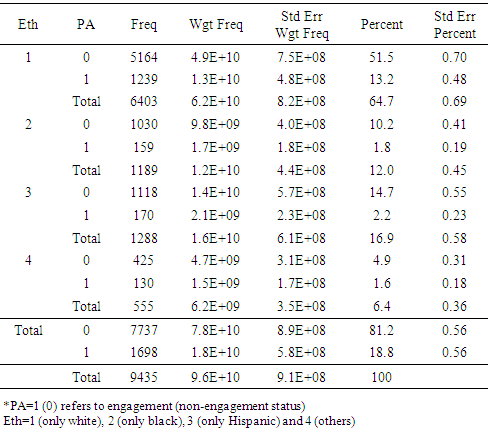
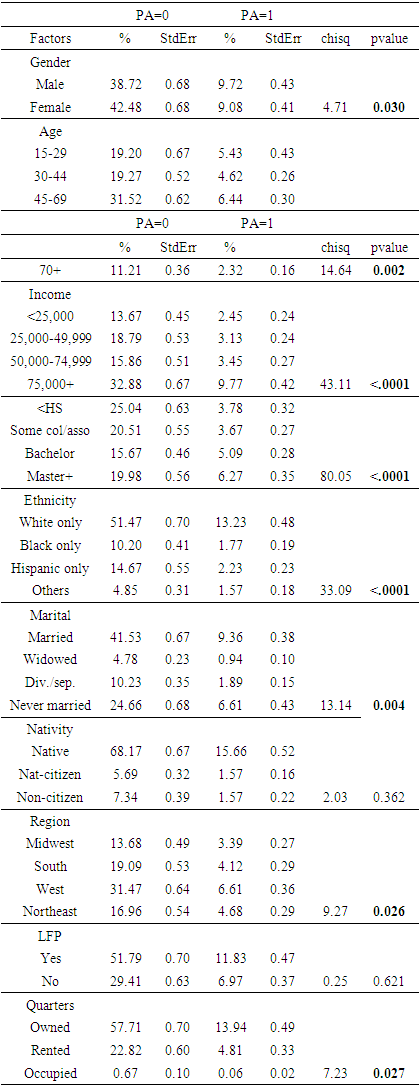
 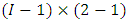 . We carry out this test of no association by implementing the SAS Proc Surveyfreq procedure [11]. The basic syntax of Proc Surveyfreq procedure is as follows:Proc Surveyfreq Data=DatasetName;Weight Weight Variable;Tables factor*response/chisq;Run;The Proc Surveyfreq is a required statement that invokes the procedure and identifies the data set to be analyzed. The Tables statement specifies frequency or crosstabulation tables and requests tests. The WEIGHT statement names the sampling weight variable. The Run statement completes the execution of the procedure. Other statements and options that are irrelevant for this study have been suppressed and can be found in [11]. The set of Proc SurveyFreq commands such as above generates analysis results as in Table 2 for factor Eth (ethnicity) and response PA (physical activity). Note that the Table 2 reports unweighted and weighted frequency, along with percent, standard error and results of chi-squared test for a cross-classified table. This test provides a chi-squared value of 33.09 with df=3 and p-value<0.0001, which provides the evidence of significant relationship between physical activity and ethnicity. Given the test is significant, we evaluate the risk of Americans non-engagement in sports and exercise activity due to various socio-demographic factors by logistic regression models.
|
2.3. Models of Assessment of Risks
- Given the binary response, with values 0 for non-engagement in physical activity and 1 for engagement in activity, we analyze the risk of non-engagement due to various levels of the socio-demographic factors. Let
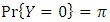 be the probability of non-engagement in the sports and exercise activity. The risk of non-engagement in PA is measured by the odds of non-engagement of an individual to sports and exercise activity due to various socio-demographic factors
  , which includes age group, gender, ethnicity, family income, level of education, labor force participation status, marital status, nativity, geographical region, etc. Since all the socio-demographic factors involved in this study are polytomous, one factor level will be considered as a base-level category, which enables us to evaluate risk of any given factor label as compared to the base-level category. For the analysis of risk, we employ simple and multiple logistic regression models [12-13]. Simple model provides significance of the factor without adjustment for other factors, while multiple regression model provides the significance of an underlying factor adjusted for the other factors in the model. An
  single factor logistic regression model is specified by
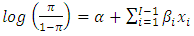 | (2) |
 is the intercept and
  is the effect of
  level of a given socio-demographic factor such as age group, ethnicity, family income, etc. It is to be noted that we arbitrarily choose one factor label as a reference group so as to make the interpretation easy and relevant to our interest and study. A
  multiple logistic regression model with factor
  having
  labels is specified by
 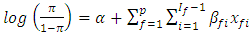 | (3) |
 is the intercept and
  is the effect of
  level of the factor
  . The parameters of the model are estimated by incorporating survey weight
  assigned to subject
  by implementing SAS Proc Surveylogistic method [14]. The basic coding syntax of Proc Surveylogistic is of the form:Proc Surveylogistic Data= DatasetName;Class predictor_1 predictor_2 … predictor_p;Model response=predictor_1 predector_2… predictor_p;Weight Weight Variable;run;The Proc Surveylogistic statement invokes the Surveylogistic procedure and identifies the data set to be analysed. The Proc Surveylogistic and Model statements are required. The Model statement specifies response and predictors, each separated by space(s). The response and predictors are separated by an equal sign as specified in the code. The Class statement identifies predictors which are categorical or factor. Each statement in SAS ends with a semicolon (;). Other statements and options irrelevant to this study are suppressed and can be found in [14].
 3. Results and Discussions
- The ATUS 2019 had 9,435 respondents with only 18.8% engaged in PA due engagement in sports and exercise activity and 82.2% with no PA engagement. In Table 3, we present the results of bivariate analysis of Americans engagement in sports and exercise activity due to different socio-demographic factors.
|
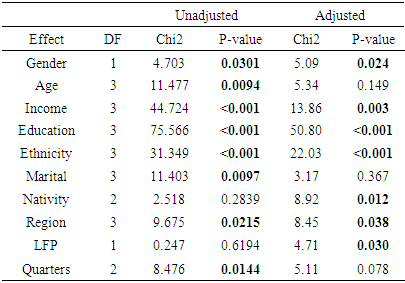 | Table 4.1. Chi2 tests of significance of effects with LoR model |
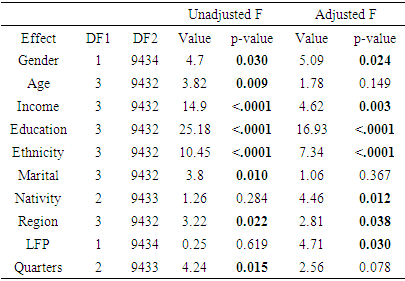 | Table 4.2. F tests of significance of effects with LoR model |
|
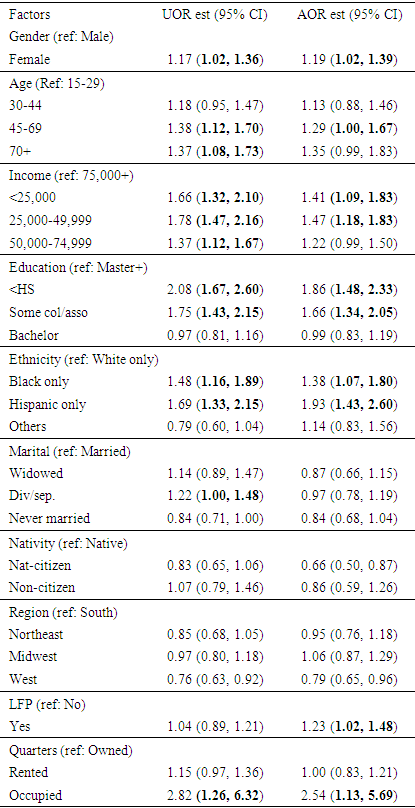
4. Concluding Remarks
- Physical activity is significantly associated with improved health outcomes of individuals of all ages. It contributes in living a life with energy and without undue fatigue, along with improving cognitive function among youth and adults, with and without any chronic health conditions. Many studies reveal significant benefits of engagement in physical activity, for example [1,3,4,7,9]. Yet, Americans do not comply with the guideline recommendations of engagement in physical activity [1-2]. In this study, we undertake an investigation of what socio-demographic factors affect Americans engagement in physical activity due to the participation in sports and activity excluding any utilitarian physical activity such as physical effort for work or household tasks. The ATUS survey data provides a great opportunity of engaging in such investigation. We extract information of Americans engagement in sports and exercise activities along with their socio-demographic factors such as age, gender, ethnicity, income, labor force participation, education, etc. to explicitly study the relationship between physical activity engagement and these factors. Initially, this study considers bi-variate analysis to determine independence or no association between physical activity due to engagement in sports and exercise and various socio-demographic factors. Most of the factors investigated in this study via bivariate analysis appear to affect Americans engagement in sports and exercise. For example, socio-demographic factors such as gender, age group, family income, ethnicity, marital status, geographical region and living quarters are all significantly affecting PA due to engagement in sports and exercise. The bivariate analysis suggest that the labor force status and nativity do not affect PA significantly. Overall, the results of Tables 2 provide the significance of relationship between physical activity and socio-demographic factors of Americans 15 years and older who participated in the survey. In addition to knowing the significance of relationship between physical activity and socio-demographic factors, we also investigate the level-specific impact of a factor compared to any reference category by employing logistic regression analysis. Logistic regression is of great use in real-life for assessing category specific impact by studying the OR estimates. The confidence interval estimates of OR enables us to evaluate if any level-specific effect is more or less likely than a reference category. In this study, we employ logistic regression with single factor and multiple factors by incorporating survey weights. A single factor model provides unadjusted OR estimates, while the multiple factor model provides adjusted OR estimates, they both convey significant thoughts with study outcomes to researchers and policymakers. In reality, for examples, if multiple factors are unavailable, simple model is of great use. On the other hand, in the availability of multiple factors, it is of great importance to compare the impact of any factor level adjusted for other factors in the model. In this study, it appears that both unadjusted and adjusted analyses agree on the statistical significance of socio-demographic factors gender, family income, level of education, ethnicity and geographical region in the engagement status of Americans in the physical activity. Results of Table 5 provide quantification of Americans risk of non-engagement to PA. The 95% confidence interval estimates of OR reported in Table 5 provide level-specific evidence of factors affecting Americans engagement in sports and exercise activities since the corresponding confidence interval estimates of OR does not include 1.This study is significant for many reasons, for examples, it contributes in the understanding of a complex survey data which would lead to applied and databased research. ATUS is a significant data source for pedagogical reasons because it could be explored and utilized in academy to provide students with real-life exposure to big data, complex analysis techniques and applications in the phase of reality. It provides a proper understanding of ATUS participants which characterizes Americans 15 years and older in engagement of physical activity due to their participations in sports and exercise.