Robert Kay Ankomah 1, Emmanuel Kojo Amoah 2, Elvis Agyei Obeng 3
1Kumasi High School, Department of Mathematics, Kumasi, Ghana
2Faculty of Science Education, Department of Mathematics Education, University of Education, Winneba, Ghana
3CSIR-Crops Research Institute, Kumasi, Ghana
Correspondence to: Robert Kay Ankomah , Kumasi High School, Department of Mathematics, Kumasi, Ghana.
| Email: |  |
Copyright © 2020 The Author(s). Published by Scientific & Academic Publishing.
This work is licensed under the Creative Commons Attribution International License (CC BY).
http://creativecommons.org/licenses/by/4.0/

Abstract
Formative outcomes and terminal scores of association football serves as the basis for most placed bets in Ghana. These formative outcomes and terminal scores are largely dependent on the quality of teams’ performance as against that of the opponent(s). The paper proposes a predictive model that assesses the quality of teams’ performance via teams’ scoring intensity by encapsulating Foul for teams (FoulF), Fouls against the team (FoulA), Red cards against the team (Red CA), Corners profile for the team (CornP), Yellow cards against the team (YelCA) and Shots on targets (ShotT) of home and away teams, and further used these scores’ intensities between any two teams to calculate the probabilities of win, draw or lose between teams using bivariate Poisson distribution. The paper concludes that, the higher the scoring potency of teams, the higher their probability of winning and vice-versa. The paper also avers that, on average there appears not to be any “wild” difference in playing at home or away contrary to conclusions drawn by previous researchers in playing at home without skills dominance of the home team. Both home and away scores are influenced by corner profiles and shots on targets of teams.
Keywords:
Poisson Regression, Bivariate Poisson, Scores Modeling, English Premier League (EPL), Home advantage, Probability matrix
Cite this paper: Robert Kay Ankomah , Emmanuel Kojo Amoah , Elvis Agyei Obeng , Predictive Modeling of Association Football Scores Using Bivariate Poisson, American Journal of Mathematics and Statistics, Vol. 10 No. 3, 2020, pp. 63-69. doi: 10.5923/j.ajms.20201003.01.
1. Introduction
Formative outcomes and terminal scores of association football serves as the basis for most placed bets in Ghana; and this trend prevails in most countries across continents. This is evidenced in the case of Ghana by patrons who flock at the precincts of most betting outlets on weekdays and weekends for offline predictions of pre and in-play games in the major football leagues across the globe with special love for English Premier League (EPL), Italian Serie A, French Ligue 1, Spanish La Liga and European Champions League (ECL). Online platform avenues also exist for bettors who are unable to make it to betting houses of Betway, Safaribet, Soccerbet, 1xbet, Supabet, Mybet, Sporty bet; bet Pawa among others to stake predictions for favorite teams i.e. for both pre-game and in-play events. Ghana’s betting industry is regulated by the Gaming Commission of Ghana (GCG) (www.gamingcommissiongh.com), and dominated by above mentioned betting houses cognizance of the accrued economic benefits to the wealth of the country in the area of taxes to government and associated employment opportunities, albeit existence of shock of patrons losing sufficient revenue to go broke. According to Gainsbury [1], sports’ betting has evolved as the single prominent type of games whose betting popularity has doubled over the last decade. Despite its evolution over the period, it is that game whose outcome is influenced by varied variables (quantitative and qualitative) and thus very difficult to determine accurate predictive outcomes making the bettor susceptible to the risk of losing sufficient incomes to the point of being ruin as indicated by Ankomah et al [2]. This is because, the qualitative variables are uneasy to formalize for proper predictions model to be set up, and, for those that are quantitative the extent of scores’ influence is difficult to ascertain (measure) vis-à-vis the random outcome of teams’ performance over time. Also, a bettor’s pick for a particular team’s win, draw or lose for an event is chiefly dependent on the team’s strengths and weaknesses relative to history of performance, new manager and expected tactics, transfer or purchase of key player, away or home influence, weather, referees indecision or errors among others. Clearly, whiles some of these factors are endogenous to the event on the field of play, others exogenously influence the outcome of the game overtly and covertly. These complexities faced by bettors as a result of the inherent huge risk and uncertainties in predicting teams’ prospects have led to statistical models from simple to elaborate by researchers with the view to finding one that can accurately predict match outcome probabilities for the reliance of bettors for profitable placed bets, and according to Dixon and Coles [3] to “outperform the predictions of bookmakers which remotely goes to determine the odds on display”.In this respect, Dixon and Coles [3] derived a method for estimating the probabilities of football results through simple bivariate Poisson model for the number of goals scored in a match by each opposing teams. The duo’s model further suggested a bet to be placed when the ratio of the model’s probabilities to that of bookmaker’s probabilities exceeded a specified level. Also, Rue and Salvensen [4] incorporated a psychological factor together with separate attack and defense strength into a modified independent Poisson model to reflect overall differences between opposing teams.On the assumption that, teams’ defense and attack strengths change randomly over time than being static, Crowder et al [5] estimated teams’ attack and defense capabilities through approximate computation (via matrices analysis) which results were favorable to the work of [3] . On refining the independent Poisson model of [3], Knorr-Held [6] respectively represented  and
and  as the attack rates of teams
  and
and  at time
  , with
  and
and  as the respective defense rates of teams
  and
and  at time
  with an incorporated home advantage factor
  to model goals scored by teams. In essence, the works of [3] and [5] urge gamblers to consider among others the strength of not just one team but opposing teams to place bet for optimality of funds.In contrast to [5] for teams’ to consider the strengths and weakness of opposing teams to model goal predictions, [6] modeled one-sided team’s strength by the use of team’s win, lose or draw results over time. The attack and defense strengths and weaknesses of both teams unlike other works were inseparable. This study however would combine both the attacks and defense strategies in predicting match outcome probabilities.The impact of some variables (exogenous as they may be) on match outcomes has also received attention. For example, together with characteristics of teams’ strength vis-à-vis home advantage, offensive and defensive strengths and their interactions that considers not only goals but also possessions of the ball, Hirotsu and Wright [7] derived a model to assess the rates of goals scored and conceded as being affected by these characteristics. Seminal works of Moroney [8] and Maher [9] together with that of Ridder et al [10], Koning [11], Glickman and Stern [12], McSharry [13] modeled scores through dissimilar approaches with the object to finding a model that accurately predicts the scores of teams but have not come without inaccuracies. Inherent variability of the models by these researchers has led one to another and continues to excite more works to find out the determiners of match outcomes in order to make accurate prediction of match results. This paper proposes a predictive model in line with [3] using key variables of scores determinants and, to further assess the significance of the herein variables. In addition, the study would estimate the probabilities of win, lose, or draw between teams via scoring intensities.
2. Methodology
2.1. Data Description
English Premier League (EPL) is the most bet-on league in Ghana for reason of its thrilling experiences and competitive nature because of the possibility of less endowed team triumphing over “big teams” compared to other nations’ leagues. Data for the 2013/2014 season of the EPL is collected for the purposes of setting up a predictive model for the entire 380 home and away games’ scores between teams. The variables in the dataset were fouls against a team, shots on targets, corner profile of teams, yellow cards and red cards. The data source in respect of the entire season (home and away) scores and additional ones herein used were obtained from www.footstats.co.uk/index.cfm?false=game. The R statistical package was employed to generate the relevant results for analysis and discussions.
2.2. Poisson Regression
Scores of association football are better modeled using Poisson regression because of its time-bound, random and discrete nature. Also, scores between teams are independent relative to the distinct inherent strengths and weaknesses each team possesses. Further, scores are rare events which can be considered as count data and thus evidently accounted for by Poisson regression according to Karlis and Ntzourfras [14]. On the basis of established assumption that goal scored follows a Poisson distribution (a discrete probability distribution which expresses the probability of a given number of events occurring in a fixed interval of time with known constant rate), the probability of an away and a home goal in a game  is respectively given by
 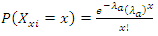 | (1) |
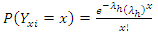 | (2) |
for  , provided
 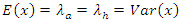 (equidispersion)Where
 is the number of goals scored by a home team or an away team
 and
and  are intensities of away and home goals scored per matchThe Probability of a win, draw or lose between two teams
  (away team) and
  (home team) for game
  with respective expected average score of
  and
and  is the product of the respective Poisson distribution described as bivariate Poisson distribution;
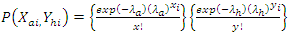 | (3) |
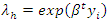
The expected or mean number of away and home goals per time period is further modeled by expressing  and
and  as log functions
 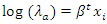 | (4) |
 | (5) |
Where  is a vector of explanatory variables
 is the unknown regression parameter
  assume their respective meaningsFrom equations (4) and (5), it follows that
 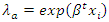 | (6) |
 | (7) |
Indicating that a unit rise in  and
and  increases
  and
and  by a multiplicative factor of
  .Applying the log-likelihood function to the equations (4) and (5), we have
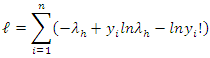 | (8) |
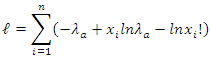 | (9) |
From (8) and (9), it is pretty easy to follow that equation (9) is restated as 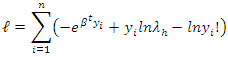 | (10) |
Similarly, from (7) and (9), it follows that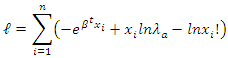 | (11) |
Maximum likelihood as an estimation procedure is adopted to estimate variable parameters by minimizing (differentiating) the log-likelihood function with respect (w.r.t) to  and
and  equating to 0 for FOC (first order condition)
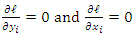 | (12) |
The resulting equations are not easily estimated directly as there appears not to be a close form of it, and therefore the Newton Raphson iteration procedure of parameter estimation is adopted to arriving at the parameters.
2.3. Theoretical Framework of Model Specifications
For the game of football, teams have respective inherent qualities relative to various departments the game offers. This difference in team’s qualities accounts for why when a good team plays a weaker team, there is a higher probability of the good team’s win. This however, does not undermine the crucial role of chance and skills though Reep and Benjamin [15] who argue that “skill rather than chance dominates the game” and a good team obviously has the former. This paper adopts [3] approach to formulate a Poisson regression model that incorporate key variables, and, further sought to ascertain how significant those variables were in predicting the probability of a match outcome. Scores are influenced by model variables (vector of explanatory variables) because of ease of possible formalization of those. These variables affect the average expected home and away score per match and expressed as linear function. Thus the mean expected home score  and away score
  is a linear combination of Home advantage factor (HomE), Foul for teams (FoulF), Fouls against the team (FoulA), Red cards against the team (Red CA), Corners profile for the team (CornP), Yellow cards against the team (YelCA) and Shots on targets (ShotT). Expressing these factors as a dependent variables of the independent variables
  and
and  we have the equations;
  | (13) |
 | (14) |
For the away team however, the euphoria of home fans which analysts says contributes to the half of a game’s win is missing and the expected score goal will thus be limited | (15) |
 | (16) |
The extent to which some betting houses in Ghana like 1xbet.com for the least offer bets on number of fouls committed, number of yellow and red cards, number of corners and shots on target of teams in a 90 minutes span justifies the importance of the above variables to be incorporated into a model that aims at calculating the intensities of scores for teams.
2.4. Home Advantage Factor
The influence of home advantage factor in a game of football is very much documented as [3] and [9] together with Pollard [16], Clarke and Norman [17] and Courneya and Carron [18] for the least make references to. For example, [18] indicates that “Home advantage is the term used to describe the consistent finding that home teams in sports competitions win over 50% of the games played under a balanced home and away schedule”. It is easily determined by the ratio (division) of the number of point amassed at home to the total earned points of the season. That is, a home advantage factor must work magic for the home team beyond individual strength of the involved teams, in which case it must reflect in the mindset of fouls earned or committed, more shots on targets, cards against opposing teams both yellow and red as well as number of corners earned in a match. Clearly, these variables must reflect and make a case for home teams cognizance of the euphoria created in favor of the home team by “fans/crowd support”. [16] however pinpoints four factors of crowd effects, travel effects, familiarity and referee bias as the cause of home advantage for teams but further indicated the difficulty of measuring these as having direct impact on home team’s win.
2.5. Model Inference
The model of equations (13) and (15) relate to expected goals for teams of both home and away team’s vis-à-vis the intensities of scores which are linear combination of its factors. The resulting values of these models (equations) help to directly estimate the probabilities of (3). Cognizance of the number of teams in the English premier league (the league whose data is being used), model estimates for each team will be provided (i.e. the scoring rates of teams).
3. Results, Analysis and Discussions
3.1. Model Assumption
As  and
and  vary from one match to another. Albeit, the validity of the assumption can on the average be assessed through the home and away scores of teams.
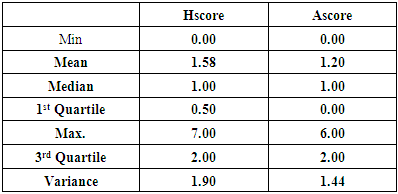
 Table 1. Summary Statistics
 |
| |
|
From table 1, the mean home score is 1.58 with a variance of 1.9. This means the expected home score is almost equal to its variance as there appears not to be a strong variability between the mean and variance of home scores. The away score summary statistic also shows that, the mean is 1.20 and a variance of 1.44. These values are not quite vast as they’re nearly equal. In fact, these give a sense of the probability distribution the goals scored by both home and away teams follow. Also, the maximum home goal score for the entire season is 7 with an average goal of 1.58 goals in a match, as against 6 goal score for any away team in the season with an average of 1.20 goals per match. This indicates that, teams on average score more home goals than away goals, and may serve as a guide to bettors in placing over/under in both formative and terminal outcomes of games. However, cognizance of the effect of home advantage as indicated by [17], one would expect teams to have more than 2 points (because home fans are set of extra 11 players) on average of home score than away score but from above the scenario is a paltry 0.38 difference (1.58 - 1.20 = 0.38). This result raises issue with home advantage effect as against the skills teams need to secure a home win. This is in consonance with Hill [19] controversial observation that “it is either all skill or all chance” and concluded that skill rather than chance which include ‘fan shout’ impact the game.
3.2. Model Results
The home and away scoring intensities of teams described respectively as  and
and  are presented by tables 2 and 3.
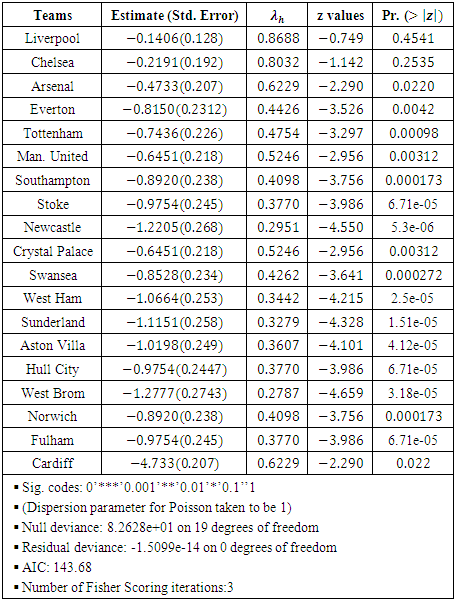
Table 2. Home Estimates of Teams’ Scoring Rates

 |
| |
|
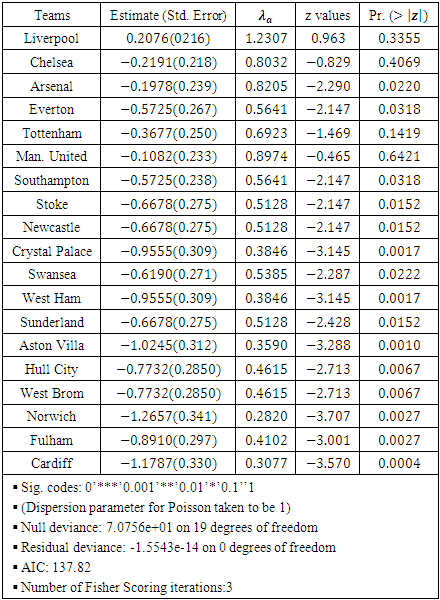
In examining tables 2 and 3, the non-uniformity in teams’ estimates suggests that performances are genuinely dynamic, and this is seen in the estimates displayed in tables 2 and 3. Manchester city home and away strength parameters are set to zero as the base parameters. This is necessary to avoid over-parameterization. Table 3. Away Estimates of Teams’ Scoring Rates

 |
| |
|
The columns  and
and  are the home and away scoring intensities of teams. These rates of scores can be used to estimate the probabilities of either a win, draw or lose via bivariate Poisson distribution. For example, the home scoring rate of Liverpool is 0.86888 and away scoring rate of Arsenal is 0.8205; therefore using the bivariate Poisson distribution of equation (3), the probability of a match outcome of 2:1 in favour of Liverpool is
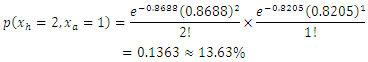 Similarly, for a Chelsea home scoring rate of
  and Man United away scoring rate of
  then the bivariate Poisson distribution probability of (1,0) win in favour of Chelsea is
 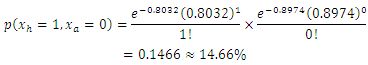 It is easy to follow that, the outcome probability of any two teams playing in game
  at time
  for any pre-determined scores can be easily determined.A probability matrix-like of teams’ scores can thus be constructed to calculate the probability of home or away win, lose or draw. For example, Chelsea home scores rate of
  and Manchester United away scoring intensity of
  using the bivariate Poisson of equation (3), the probability matrix is displayed in table 4.
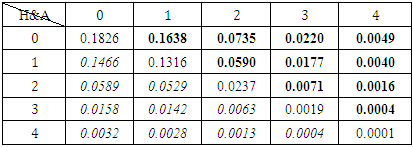
Table 4. Bivariate Poisson Estimates of Home and Away Teams
 |
| |
|
From table 4, the vertical row gives the home scores of Chelsea and the horizontal rows give the away scores of Manchester United. The marginal probabilities of the home and away team scores are displayed in table 4. The joint probability can thus be easily determined by adding corresponding cells probabilities. For example, to calculate the joint probability of a home win, we add cells which have higher home scores than the away team scores. By adding the marginal probabilities of the scores of (1,0), (2,0), (2,1), (3,0), (3,1), (3,2), (4,0), (4,1), (4,2), (4,3) which are italicized in table 4, we have0.1466 + 0.0589 + 0.0529 + 0.0158 + 0.0142 + 0.0063 + 0.0032 + 0.0028 + 0.0013 + 0.0004 = 0.3024 ≈ 30.25% as the probability of a home win vis-à-vis the scoring intensity of the home team as against the scoring intensity of the away team. Similarly, adding the marginal probabilities of the cells in bold we have (0,1), (0,2), (0,3), (0,4), (1,2), (1,3), (1,4), (2,3), (2,4), (3,4) and the joint probability of an away team’s win is 0.1638 + 0.0735 + 0.0220 + 0.0049 + 0.0590 + 0.0177 + 0.0040 + 0.0071 + 0.0016 + 0.0004 = 0.354 ≈ 35.40% as the probability of an away team win cognizance of the scoring intensity. The resultant joint probabilities of home and away outcomes are indication that, there appears not to be “wild” difference between playing at home and playing away matches between the leading EPL clubs of Chelsea and Manchester United, however, the higher the intensity of score, the higher the probability of win. To wit, the probability of Man United winning away as against Chelsea’s win at home is because of the scoring intensities of  and
and  in favour of Man United.This finding reinforces analyst assertion that, form doesn’t matter when Chelsea plays Manchester United within the league season, as any of the teams is capable of a win either playing home or away regardless of recent form. This is contrary to [3] and [16] conclusions that teams’ performance at home is higher not necessarily by virtue of teams’ skills but for the mere fact that playing at home has an advantage effect. Also, the probability of a draw outcome is calculated from table 3.4 by adding the marginal probabilities of (0, 0), (1, 1), (2, 2), (3, 3) and (4, 4) which gives 0.1826 + 0.1316 + 0.0237 + 0.0019 + 0.0001 = 0.3399 ≈ 33.99%. This result indicates that Chelsea and Manchester United have higher probability of an equal game outcome (draw).
3.3. Parameter Estimates
The estimates of the scoring intensities of  and
and  of the model are resulting values of parameters of the model (14) and (16).The following tables give the estimates of model parameters.
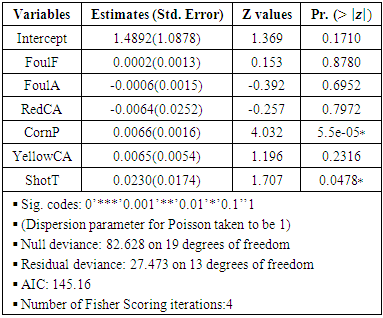
Table 5. Model Parameters as Determining Home Scores
 |
| |
|
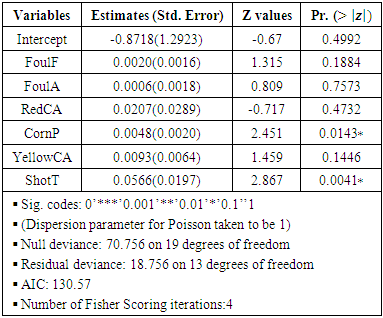
Table 6. Model Parameters as Determining Away Scores
 |
| |
|
Table 5 and 6 respectively display the parameters as found in models (14) and (15) at 5% level of significance. The results in tables 5 and 6 indicate that, corner profile of teams’ influence both home and away scores for teams. These are easily inferred from the tables (5) and (6) above. These finding is evident in recent games as more teams have in most cases rise from deficits to win crucial matches through corners. This explains why teams at the very least prefer throws to conceding corners because of the probable effects of earned corners to influence scores of teams. Reminiscent of this finding is Chelsea exit from Uefa Champion League (UCL) 2014 which saw 10 men PSG (Paris Saint Germain) team come twice from behind through corners to edge out Chelsea. Similarly, at  home and away shot on targets (ShotT) is significant and thus influence score. Teams’ profile is boosted for each match vis-à-vis the number of shots they are able to earn in a particular match. Number of a team’s shot on targets indicates a team advantage over the opponent and the likelihood of those shots to register a goal.
3.4. Home Advantage
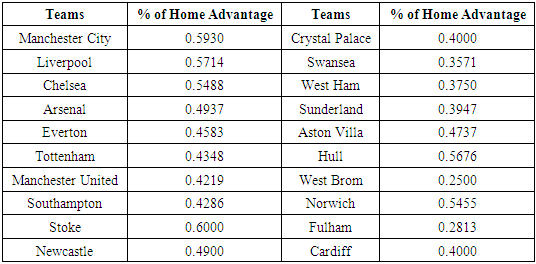
Previous researchers like [17] and [18] have made a case for home advantage factor as influencing scores for teams. We present the home advantage percentage for teams and analyses the impact on teams’ overall performance.Table 7. Estimates of Teams’ Home Advantage (According to seasons’ league table)
 |
| |
|
From the table 7, Stoke and Manchester City had 60% and 59.3% respective earned points at home and placed them 9th and 1st respectively on the season league table. This means, Manchester City had less away earned points yet emerged league leaders. Contrary to City, Stoke has more home earned points than City but because of poor away performance ended 9th on the league table. Similarly to Stokes’ story, Norwich and Hull city had 54.55% and 56.76% respective home earned points but Norwich ended being relegated while Hull placed 17th on the league table for reason of poor and abysmal away performance. This observation is thus inconsistent with previous researchers’ drawn conclusions about home advantage’s influence on scores and team’s final positions including that of [16]. At least home advantage get teams to win a game, but doesn’t guarantee overall season positions on league tables if away performance dips. This means critical attention ought to be paid to away performance of teams relative to overall season position on league table to stay competitive for another league season. Emerging researchers have tended to downplay the effect of home advantage citing changes in Bosman ruling of 1995 [16]. From table 7, teams that had 50% consistent home wins under balanced home and away schedule of plays are only 6 (Manchester City, Liverpool, Chelsea, Norwich, Hull and Stoke) as against 14 other teams who had less than 50%. By [18] definition of home advantage, more teams had less home advantage effect bringing into question the much talked about “home effect”, at least minimal in the EPL.
4. Conclusions
• Scoring potency of teams largely determine win, lose or draw between teams. A higher scoring potency indicates higher probability of win and vice-versa. Bettors are guided to consider teams with higher scoring intensity when placing bets. Also, wagers must consider a double chance (win or draw) bet for leading teams of the EPL like when Chelsea plays Man United.• Corner profiles of teams was found to influence scores as teams have come from goal(s) deficits through corners to earn respected scores or in some cases emerge victors. Teams shot on target were also found to influence scores. • Contrary to long held conception that, teams’ that play at home perform better, the paper concludes that, this assertion cannot be absolute as more teams in the 2013/2014 of the EPL got more points playing away than home. Teams are therefore urged to concentrate on building players’ skills as against over reliance on home advantage.
References
| [1] | Gainsbury, S. (2012). Internet gambling: Current research findings and implications. New York: Springer. |
| [2] | Ankomah, R.K, Oduro, R. and Amoah, E.K (2020), Gambler’s risk of ruin and optimal bets, Communications in Mathematical Finance, vol. 9, no. 1, 13-27. |
| [3] | Dixon, M.J & Coles, S.G (1997). Modeling association football scores inefficiencies in the football betting market. Applied Statistics, Vol. 46: 265-280. |
| [4] | Rue, H. and Salvensen, O. (2000). Prediction and retrospective analysis of soccer matches in a league. Journal of the Royal Statistical Society, Vol. 49, No.3: 399-418. |
| [5] | Crowder, M., Dixon, M., Ledford, A., & Robinson M (2002). Dynamic modeling and prediction of English football league matches for betting, journal of the Royal and Statistical Society, series D, Vol. 51, No. 2: 157-168. |
| [6] | Knorr-Held, L. (2000). Dynamic rating of sports teams, Journal of Statisticians, Vol. 49: 261-276. |
| [7] | Hirotsu, N & Wright, M (2003). An evaluation of characteristics of teams in association football using markov process model. Journal of the Royal Statistical Society, Vol. 52, No: 4, 591-602. |
| [8] | Moroney, M.J. (1956). Facts from Figures, Penguin 3rd edition. |
| [9] | Maher, M. (1982). Modelling association football scores. Journal of Royal Statistical Society Neerland, 36: 109-118. |
| [10] | Ridder, G., Cramer, J.S., and Hopstaken, P. (1994). Prediction and home advantage for Australia rules football. Journal of Applied Statistics, 19: 251-261. |
| [11] | Koning, R. (2000). Balance in competition in dutch Soccer, Journal of Statistician, Vol. 49: 261-276. |
| [12] | Glickman, M.E. & Stern, H.S (1998). A state-space model for national football league scores, Journal of the American Statistical Association, Vol. 93, No. 441: 25-35. |
| [13] | McSharry, P.E. (2007). Altitude and athletic performance: Statistical analysis using football results. British Medical Journal, Vol. 335, No. 7633: 1278-1281. |
| [14] | Karlis, D and Ntzourfras, L. (2003). Analysis of sports data by using bivariate Poisson models. Journal of the royal statistical society. Series D, Vol. 52, No. 3: 381-393. |
| [15] | Reep, C., and Benjamin, B., (1968), skills and chance in association football. Journal of Royal Statistical society A, vol. 131: 581-585. |
| [16] | Pollard, R., (2008). Home advantage in football: A current review of an unsolved puzzle, the open sports science journal, 1: 12-14. |
| [17] | Clarke S.R, Norman J.M (1995) Home ground advantage of individual clubs in English soccer. Statistician 44: 509-21. |
| [18] | Courneya, K.S & Carron, A.V (1992). The home advantage in sports competitions: A literature review. Journal of Sports and Exercise Psychology, 14, 13-27. |
| [19] | Hill, I. D. (1974) Association football and statistical inference, journal of applied statistics, 23: 203-208. www.footstats.co.uk/index.cfm?false=game. www.gamingcommissiongh.com. |

 Abstract
 Reference
 Full-Text PDF
 Full-text HTML