-
Paper Information
- Next Paper
- Paper Submission
-
Journal Information
- About This Journal
- Editorial Board
- Current Issue
- Archive
- Author Guidelines
- Contact Us
American Journal of Mathematics and Statistics
p-ISSN: 2162-948X e-ISSN: 2162-8475
2020; 10(2): 38-43
doi:10.5923/j.ajms.20201002.02

Comparative Study of Dynamics of Women of Child-bearing Age in Nigeria
 Abstract
 Reference
 Full-Text PDF
 Full-text HTML
Chibuikem C. Nwagwu, Uchenna P. Ogoke
Department of Mathematics and Statistics, University of Port Harcourt, Rivers State, Nigeria
Correspondence to: Chibuikem C. Nwagwu, Department of Mathematics and Statistics, University of Port Harcourt, Rivers State, Nigeria.
| Email: |  |
Copyright © 2020 The Author(s). Published by Scientific & Academic Publishing.
This work is licensed under the Creative Commons Attribution International License (CC BY).
http://creativecommons.org/licenses/by/4.0/

The aim of this research work is to observe the changes in the population structure and distribution of Nigeria within one score years and a decade (1991 – 2020) by identifying the proportion of the Nigerian population that is women within the child-bearing age (15 – 49 years). The work uses three different population growth models – Exponential Growth Model, Hyperbolic Growth Model and a revised Exponential Growth Model – on the population data. The work compares the population distribution from 1991 to 2020 graphically for all the three growth models to see the one that best fits the data which was used to predict the population for the year 2020. Having obtained the proportion for each state, we built maps for 1991 and 2020 using ArcGIS software. The results show which states had highest number of women in child-bearing age in the different years as well as the states with the least number of women in child-bearing age. From the map, we noticed that states like Lagos, Kano and Rivers remained in the Red zone (higher population of women of child-bearing age) while the likes of FCT, Nassarawa and Yobe did not move out of the Blue zone (lower population). With the results of this research, an idea of how Nigeria’s population will be in the coming years especially in terms of the prospect of population growth, fertility, etc. can be known and planned for. Background: The varying stance of researchers on the best model to use for population projections is one of the motivations for engaging on this project. More so, we tried to access specific data on the population of women in the child-bearing age in the country but this appears not to be available. Such a critical statistical information ought to be readily available hence, we took the leap to make this valuable contribution to the body of knowledge because information on the number of women in child-bearing age is information on the possible future population. This can also be used to study other concepts like child-woman ratio and mean age of mothers. This project goes further to x-ray the cohort on a state-by-state basis using spatial representation on a map. It groups states into three zones to depict the number of cohort in the states so as to show which states fall into the different zones. Another aspect of this work is the comparative study of the number of cohort in the 1991 population against that in the 2020 projected population. Projection here is based on the best model established early in this work.
Keywords: Population Growth, Spatial distribution, Growth Model, ArcGIS
Cite this paper: Chibuikem C. Nwagwu, Uchenna P. Ogoke, Comparative Study of Dynamics of Women of Child-bearing Age in Nigeria, American Journal of Mathematics and Statistics, Vol. 10 No. 2, 2020, pp. 38-43. doi: 10.5923/j.ajms.20201002.02.
Article Outline
1. Introduction
- The role of demography cannot be overemphasized especially as it relates to policy formation and national planning. Demographic indices like age-sex ratio, dependency ratio, child-woman ratio, among others have in the past been helpful in describing and characterizing different populations based on structure. They have also been useful in making assertions regarding fertility by assessing the rate of growth as well as number of new live births against deaths within the period under review. While most researchers use the conventional method of determining population growth (using birth rate, death rate and net migration), this research tries to take into account the possibility of either of the stated rates to be unavailable or unreliable. Thus, we use (in their stead) a constant growth rate which is estimated using the available census data. Among statistical data recorded by government agencies, census data are considered as particularly reliable and accurate. There are two main reasons for this:• Censuses were among the first operations that were carried out, statistical agencies were able to develop adequate procedures and improve them in the course of time.• In contrast to macroeconomic data (e.g. statistics of birth rate, death rate, migration, etc.) which require heterogeneous variables to be aggregated (a process often referred to as the problem of “adding apple to oranges”) population statistics only involve the addition of data of a single kind. In spite of this, population data (as indeed any data based on observation) should be considered carefully and viewed with a critical eye.A lot of research has gone into studying the Nigerian population especially with respect to examining its composition, structure and in particular making projections from existing data. For some reasons, the country conducted her last census in 2006. Although the government of the day appears not to understand the inherent problems caused by this procrastination, researchers do. Statisticians being curious and duty-bound to provide useful population figures have resorted to testing different population growth models like the Exponential, Hyperbolic, Logistic, Arithmetic, Linear and Geometric models on the available data from as far back as 2006. This has led to varying opinions on the issue of the most appropriate model for the Nigerian population given its peculiarity. The population projection conducted among countries globally shows that if the current rate of population growth in Nigeria persists, the country’s human population will double itself in the next 23years [1]. Fertility is one of the important demographic determinants of accelerated population growth because its control is often hampered by socio-cultural practices [2]. Being able to estimate and make projections on the population of women of childbearing age will assist the government to assess fertility rate and work towards reducing mortality rate through improved education and health infrastructure. The need to carry out this study by segmenting the data according to state is because it makes it easy to detect the fertility differentials which persists by ethnicity, religion and sex preference after controlling for other important variables [2].
2. Materials and Methods
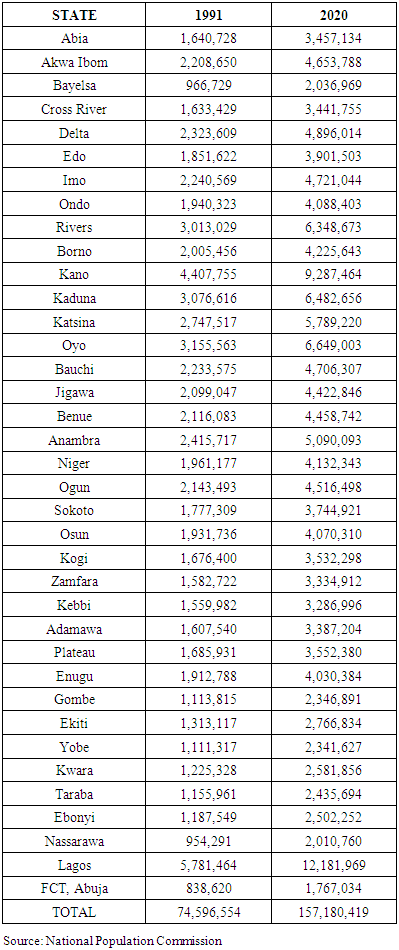
- This comparative study is limited to the population of women of child-bearing age in Nigeria using the 1991 population census data to project the population of the same cohort in 2020. The census data are obtained from National Population Commission and the projected populations are obtained using only the best population estimation model based on the 1991 population.
3. Review of Literature
- Nwogu and Iwueze (2009) in their work [3] defined demographic data as the observed or measured characteristics of a population, while the characteristics are the properties which can be observed or measured. The sources of demographic data, their advantages and limitations were extensively covered in the work. According to them, “if the objective is simply to describe any observed data, then the descriptive statistical methods are used. Descriptive methods include tabular and diagrammatic representation of data and some other methods, which are purely exploratory and give clues to the direction of further investigation”. Some of the other descriptive methods studied in the work are: diagrammatic presentations like use of curves, population pyramid, histogram, pie chart, bar chart and analytic tools like population density, sex ratio (age-specific sex ratio, sex ratio at birth, sex ratio at death), child-woman ratio, dependency ratio, age ratio. Others include: crude birth rate, crude death rate, crude rate of divorce as well as other event-specific rates.According to the USAID Health Policy Initiative [4], we can think of a population with a large population momentum like a train. A large train takes longer to stop than a car or even a bus. Similarly, a population heavily concentrated in younger ages will take longer to reach zero population growth. Even if each couple has only two surviving children (replacement level fertility rates), there will be many births. Even if Country A’s fertility rate were reduced to replacement level today, the population would continue to rise for the next 25 years due to the large number of girls who will enter the reproductive ages over the next several years. This information is important for those policymakers who expect to see an immediate impact from family planning programs.There are two main methods of estimating future population size: the components of growth method and the cohort component method. Using the components of growth method, we can estimate the size of the population at some point in the future. We take the population size at the beginning of the time period (Pop1) and add the projected number of births, subtract the projected number of deaths, and add the projected net migration [that is number of migrants in – (minus) number of migrants out]. The method is simple. However, the limitation of this method is that it does not account for the age/sex structure of a population—a very important factor affecting population growth. The cohort component method is more accurate for making projections and is the method used in the work. This method begins with an age/sex population distribution for a base year and uses base-year, age-specific rates (fertility, mortality, net-migration), which are usually arranged in 5-year age groups. These rates are then changed in future years according to the assumptions chosen. The assumptions are made about the future course of each of the three components of population growth. For example, age- and sex-specific probabilities of mortality and migration are applied to the members of each age group to calculate how many will exist in each future time period.Oramah considered the Effects of Population Growth in Nigeria [5]. Thus, his research is aiming to point out the eminent and unavoidable results of continuous increase in human population in Nigeria. Some of these results are; depletion of resources, human congestion, weather modification, high unemployment rate, environmental degradation and a lot more. It is believed in science that matter occupies space and space is limited, as a result, this phenomenon in turn will show that the fixed factor like space (environment) will be affected when a continuous factor like population growth is put on it. Some experts however believe that Nigeria is or has already exceeded the carrying capacity. What then are the implications of exceeding the carrying capacity in an ecosystem like Nigeria? The implications can be drawn from the analogies to the population growth of other life forms in more limited ecological niches. One of the following two things can happen in the very near future if the carrying capacity is exceeded; if the carrying capacity is not exceeded by a great deal, then the population will simply decrease back to the carrying capacity. Such a decrease takes place over a relative short period of time, resulting in what is known as a population crash or dieback. If on the other hand the carrying capacity is too far exceeded, the population will crash to zero, resulting in extinction or the environment will be highly depleted, at least in that particular environment which eminent in Nigeria if the population growth is not checked. The overall effects of this growth on the living standards, resources use and the environment will continue to change the Nigerian landscape for a very long period of time if nothing is done to checkmate the rapid population growth. These effects are presently felt most especially in; energy consumption, carbon emissions, air pollution and human congestion.Being able to estimate the population of women of childbearing age can help the government make plans that will ensure constant or increased fertility rates as well as control population increase. Adebowale and Palamuleni [6] linked preganancy related problems to mortality and morbidity in children and women of childbearing age. Going further he explained that education may affect the actual number of women within that age who eventual have their first births early in marriage. In another study, Doctor H.V et al [7] believes that an improvement of the health system will accelerate reduction in maternal mortality rate and with concerted efforts, we may achieve the Sustainable Development Goal 3 which is to reduce the global maternal mortality ratio to less than 70 per 100,000 live births. Estimates of maternal mortality against population of women of childbearing age are indispensable for planning and monitoring the outcomes or impact of interventions.The results of these projections are also valuable in providing family planning services to women of childbearing age. This is important as the underutilization of these services has led to increased teenage pregnancy and maternal deaths in Africa. These services also maximize the chances of healthy pregnancy and infant as well as discourage unsafe abortion practices [8].Procedure Methodologya. Exponential Growth Model: We assume that the rate of population growth is proportional to the current population. Mathematically:
 where: k is the growth rate (in yr-1) and is a constantP is the current population and C =P0 is the initial population.The differential equation above produces a model of the form:
 Hence, using data from 1960 and 2009 where the population was 45.14million and 154.4million respectively, we set 1960 as the t = 0. So we have:
 Since population in 1960 = 45.14million, C = P0 = 45.14
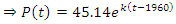 To solve for k, we use the data from 2009 as follows:
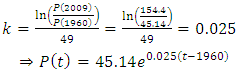 Using this model, we can predict the population in 2050 by plugging t = 2050.
 The model can also be used to estimate growth rate as follows:
 i.e As at 2009, Growth rate = 0,025 x 154.4 = 3.86this implies that the population grew by 3.86 million every year. This leads to a predicted population of 158.5million in 2010 which is actually quite close to the actual figure of 159.5million.N.B: Growth rate (k) is constant in this model even with large populationb. Hyperbolic Growth Model: Like the exponential, we begin with the differential,
  but now, we assume that k is a function of P.
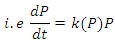 This model is valid because a growth in population may suggest that there are favourable socioeconomic conditions which encourage people to bear more children and so the rate of population increase actually grows with the population.In order to maintain the dimensions in the equation, we say:
 where: k on the right-hand side is now a constant multiplied by P which varies with timeP0 is a constantSolving the following differential equation gives the model
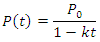 Using data from 1960 and 2009 to get our constant k, set 1960 as t = 0 so P0 = P(1960) = 45.14.
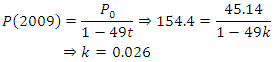 Therefore, our model is:
 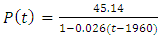 One flaw of this model is that it goes to infinity at 0.026 (t – 1960) = 1, or t = 1998. Hence, we can conclude that the hyperbolic model is more accurate for the past while the exponential is slightly more accurate for modern era. Also, the exponential model is appropriate for populations with overlapping generations because it deals with population growth as a continuous process.c. Revised Exponential Growth Model: This is an exponential growth model in which the growth rate, k is substituted with the difference between the birth rate and death rate for the reference/initial year.Mathematically:
 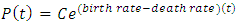 d. Geometrical Interval Classification: This is a type of classification scheme for classifying a range of values based on a geometric progression. This classification method is valuable for visualizing data which do not follow a normal distribution or whose distribution is largely skewed.It works best when the data are spread over a large area and is not well distributed. For instance, in population data it is possible to show a better display and distribution of the data in a more natural way. Here, it is possible to see the difference between the more populated areas to medium and low areas.N.B: This method is actually intended for the process of data visualization.
 4. Result
- Data Analysis: Data were compiled and entered into Microsoft Excel spreadsheet package and some basic computations were carried out using pre-assigned formulas. The spatial analysis and distribution was done using ArcMap in ArcGIS.
|
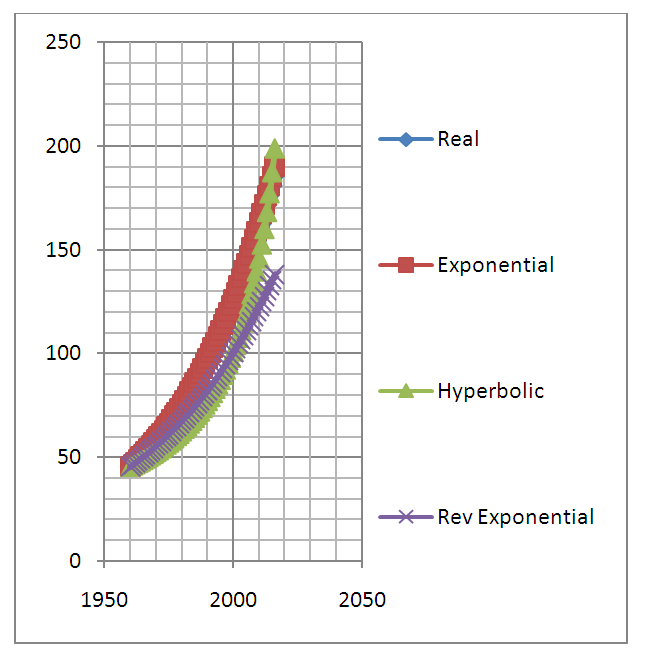 | Figure 1. Graphical Representation of Different Growth Models against the Actual Data from 1960 to 2016 |
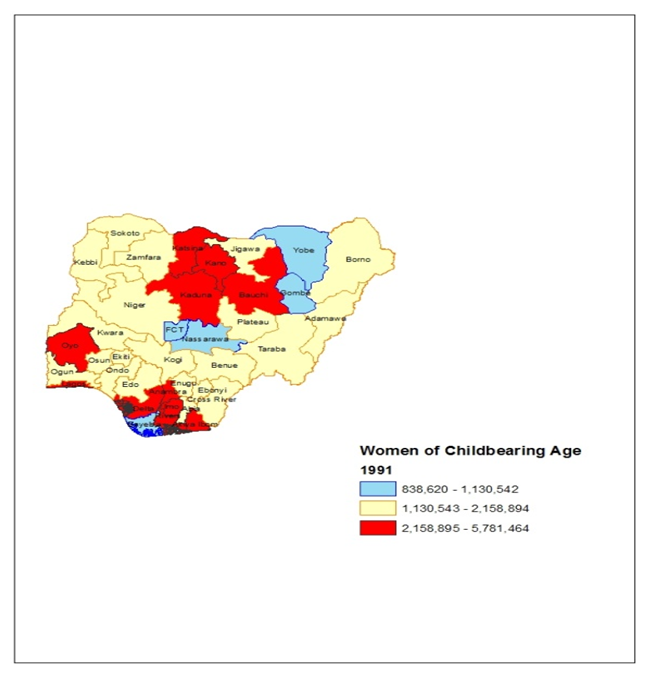 | Figure 2. Spatial Representation of Population of Women of Child-bearing Age in Nigeria 1991 by state |
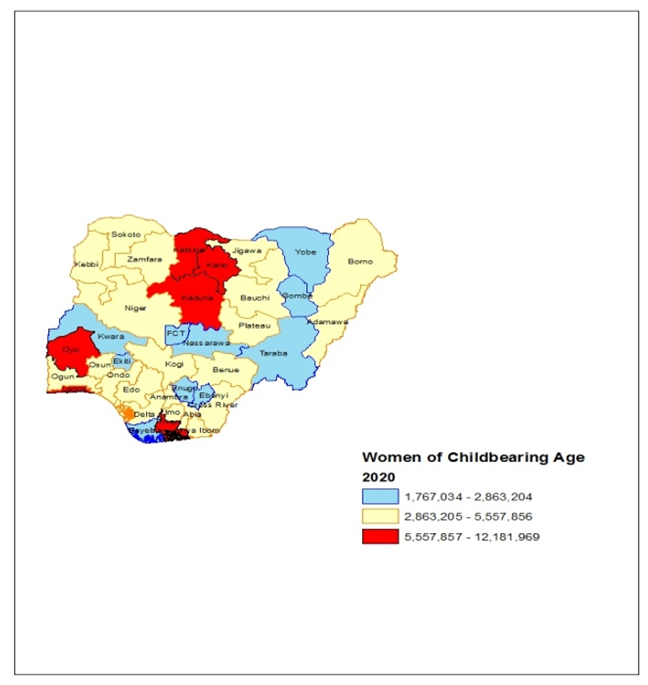 | Figure 3. Spatial Representation of Population of Women of Child-bearing Age in Nigeria 2020 by state |
5. Discussion
- Based on model adequacy, we see that the Revised Exponential Model is the best fit for the corresponding data. Upon comparison with the actual data via graphical representation, we notice that although the Revised Exponential Model is closer to the actual data than the hyperbolic (at the early years i.e before 2000), we equally observe that it eventually goes wider off the actual data unlike other models. The exponential J-curve is consistently closest to the actual data while the hyperbolic shows periods of serious deviation from the actual until around 2012 when it comes close to it. Yet from 2016, it shoots past the actual data.The results of our computation as seen in Table 1 show that the population of the cohort in 1991 and 2020 are 74,596,554 and 157,180,419 respectively representing a growth rate of 4.04% from independence in 1960 or 0.026% from 1991 to 2020.From the spatial representation of the 1991 population, we observe that the following states fall in the region of high population of the cohort: Oyo, Delta, Anambra, Imo, Rivers, Akwa Ibom, Katsina, Kano, Kaduna, Bauchi and Lagos. Meanwhile, the following have low population of the cohort: Bayelsa, FCT, Nassarawa, Yobe and Gombe. The other states fall in the middle.From the spatial representation of the 2020 population, the following states fall in the region of high population of the cohort: Oyo, Lagos, Rivers, Kaduna, Katsina and Kano while FCT, Nassarawa, Taraba, Gombe, Yobe, Enugu, Ebonyi, Bayelsa, Ekiti and Kwara are projected to have low population of the cohort compared to the national figure.
6. Summary
- In an effort to lend a voice to the discussion on the most suitable population growth model for the Nigerian population, this research uses the available census data of from 1960 to 2016 on different models like the Exponential, Hyperbolic and a Revised form of the Exponential model to examine which one provides the best estimate of the actual population data (especially for the census years). Having tested each model, we observe from the graph that the Exponential Growth model provides best estimate over the period under review. With this knowledge and the prior information of the cohort in 1991 obtained by simple calculation as a tool, we are able to estimate the population of women of child-bearing age by state in 2020. These were then represented spatially using ArcMap in ArcGIS in order to clearly visualize the data onto the map of Nigeria. By way of classification, the Geometrical Interval Classification Scheme integrated into the software was used to divide the data into three groups – Red Zone (region with high population of the cohort), Yellow Zone (region with medium population of the cohort) and Blue Zone (region wi [6] th low population of the cohort)
7. Conclusions
- Based on the results of this research we can conclude that the Exponential Growth Model compares favourably with the other models considered in this work and thus is preferred for use in population projections regarding the Nigerian population. From our calculations, the population of the cohort in 1991 and 2020 are 74,596,554 and 157,180,419 respectively representing a growth rate of 4.04% from independence in 1960 to 2020 and 0.026% within the period under review. This shows a steady growth rate and the positive outlook is evidence of high fertility of the country despite the dropping world population growth rate. This work also shows that while states like Lagos, Kaduna and Kano will continue to have high population of women of child-bearing age in 2020, states like Delta, Anambra and Akwa Ibom which had high population of the cohort in 1991 are not likely to do so in 2020. We also observe that states like Taraba, Kwara and Ekiti which had a medium population of the cohort in 1991 will have a low population of the same by 2020. This work is not concerned about the underlying reasons behind these changes in the population structure and in fact notes that some social and political instability like communal crises in Plateau, Benue and Rivers, insurgency in Yobe, Borno and Adamawa as well as other factors may affect the accuracy of these projections. To this effect, we recommend that a national population census be conducted in the nearest future to provide bedrock for further concrete research.