Samuel U. Enogwe 1, Ben I. Oruh 2, Happiness O. Obiora-Ilouno 3
1Department of Statistics, Michael Okpara University of Agriculture, Umudike, Abia State, Nigeria
2Department of Mathematics, Michael Okpara University of Agriculture, Umudike, Abia State, Nigeria
3Department of Statistics, Nnamdi Azikiwe University Awka, Anambra State, Nigeria
Correspondence to: Samuel U. Enogwe , Department of Statistics, Michael Okpara University of Agriculture, Umudike, Abia State, Nigeria.
| Email: |  |
Copyright © 2020 The Author(s). Published by Scientific & Academic Publishing.
This work is licensed under the Creative Commons Attribution International License (CC BY).
http://creativecommons.org/licenses/by/4.0/

Abstract
This study discusses the application of replacement model in the hotel industry. The ultimate objective is to determine the replacement age for LED bulbs in hotel rooms. The method adopted considered cost of replacement of LED bulbs as random variables and utilized goodness-of-fit test to determine the probability distribution of replacement costs. The result showed that the LED bulbs burn for about 7.53 hours and about 78 bulbs failed per hour, resulting to an average individual replacement cost of about ₦41,600.52 per period of replacement or ₦12.47 per hour. In addition, it was observed that individual replacement of LED bulbs is required from period 1 (i.e., between 4381 and 8760 hours) through period 6 (i.e., between 26281 and 30660 hours), and after period 6 (i.e., between 26281 and 30660 hours), the group replacement is implemented with a replacement cost of about ₦54,450.00. Consequently, the study recommended the use of individual replacement policy for the hotel under investigation over the group replacement policy.
Keywords:
Replacement Age, LED light bulbs, Hotel rooms, Modified (MODI) replacement
Cite this paper: Samuel U. Enogwe , Ben I. Oruh , Happiness O. Obiora-Ilouno , Determination of Optimal Replacement Age of LED Light Bulbs in Hotel Rooms, American Journal of Mathematics and Statistics, Vol. 10 No. 1, 2020, pp. 20-25. doi: 10.5923/j.ajms.20201001.03.
1. Introduction
An LED light bulb is a solid-state lighting device that fits in standard screw-in connections but uses LEDs (light-emitting diodes) to produce light. LED light bulbs are a more environmentally-friendly alternative to incandescent bulbs (Chaves, 2015 and Fred, 2006).In many hotel industries, LED light bulbs are installed in the hotel rooms so as to give light. These LED light bulbs do not give any indication of deterioration with the passage of time but fail all of a sudden and are rendered useless because they cannot be repaired. One major threat posed by failure of the LED light bulbs is that it may cause total collapse of a party programme especially when it fails during service. However, this type of problem requires the anticipation of failures to specify the probability of failure for any future time period. With this probability of failure and the cost information, a replacement decision may be taken to balance between the wasted life of the LED light bulbs, replaced before failure against the cost incurred when the LED light bulbs completely fails during service (Sharma 2009). From the foregoing, it is clear that the age at which replacement of LED light bulbs is to be done is an indispensable aspect of the decision making process in the hotel industries. In this study our interest is to determine optimal age of replacement of LED light bulbs in the hotel rooms. Therefore, the ultimate objective of this study is to construct a modified (MODI) replacement model that could be used to predict when to replace LED light bulbs and the cost of implementing such replacements in hotel industries. Specifically, the study (i) fitted the failure time and replacements cost data to appropriate probability distributions, (ii) determined the individual and group replacement costs, and (iii) constructed a modified (MODI) replacement model that could be used to offer optimal replacement of LED light bulbs in Nigeria hotel rooms. Based on the result of this model recommendation is made as to the most economical replacement policy to adopt in the replacement of LED light bulbs in hotel industries.
2. Literature Review
2.1. Theoretical Framework
Naturally, human beings, machines, equipment etc., are required in the industry for ease of work. They may be used for the provision of service or for the production of goods. In the course of using them for the aforementioned purposes they tend to wear and tear and as a result their efficiency decreases. The decrease in their efficiency can be predicted by the increasing number of breakdowns or reduced productivity. Since their decreased efficiency is inevitable, one may carryout maintenance in order to bring the man, machine or equipment back to work. Maintenance here may consist of replacing the worn out part, or oiling or overhauling, or repair etc. Even after maintenance has been carried out, provided the item is put back to work, the item will still require maintenance at some point in time. A time is reached when the maintenance cost becomes very high and the manager feels to replace the old machine, man or equipment by new one. This type of problem is known as replacement problem and can be solved by using replacement models, Murthy (2007). In replacement modeling, the appropriate age at which replacement should be implemented with minimal cost constitutes a large class of problem in organizations, Sharma (2009).Moreover, when an items stops working, invariably a failure has occurred. That was why Blanche and Shrivastava (1994) defined failure as the event when a required function is terminated, exceeding the acceptable limits. The word failure has got a wider meaning in industrial maintenance than what it has in our daily life. Murthy (2007) and Sharma (2009) categorized the failure in two classes. They are (i) Gradual failure and (ii) Sudden failure.(i) Gradual failure: This type of failure is progressive in nature in the sense that as the life of an item increases; its operational efficiency also deteriorates. Consequently, as the maintenance and operating costs increases, equipment productivity and resale value decreases. Gradual failure is common among automobiles, mechanical items like pistons, rings, bearings, etc.(ii) Sudden failure: A sudden failure could mean that the life of the equipment cannot be predicted with certainty and as such it could be looked at as some sort of random variable. For example, the LED light bulb under review dies suddenly.
2.2. Empirical Literature
Barlow and Proschan (1965) used the replacement policy in which the system will have a preventive replacement as soon as the age of the system reaches T, and a failure replacement as soon as it fails, whichever occurs earlier, and the replacement time was assumed to be negligible. The problem is to choose an optimal replacement policy T* such that the long-run average cost per unit time is minimized.Feldman (1976) in his work considered a system that is subject to a sequence of randomly occurring shocks, where each shock causes some damage of random magnitude to the system. He stressed that any of the shocks might cause the system to fail, and the probability of such a failure is a function of the sum of the magnitudes of damage caused from all previous. The purpose of the study was to derive the optimal replacement rule for such a system whose cumulative damage process is a semi-Markov process. This allows for both the time between shocks and the damage due to the next shock to be dependent on the present cumulative damage level. Only policies within the class of control-limit policies will be considered; namely, policies with which no action is taken if the damage is below a fixed level, and a replacement is made if the damage is above that. An example was given to illustrate the use of the optimal replacement rule.Barkan et al. (1988) carried out a study to determine the methods for monitoring the condition of high voltage circuit breakers. They stated that symptoms of wear, possible failure, and failure that can be detected by on-line monitoring of can be placed into four general categories: (i) Contact Wear - Damage from excessive interrupting duty, which is cumulative. According to them, catastrophic failures have occurred under this circumstance; (ii) Dielectric Compromise - Contaminated oil, worn baffles, nozzle ablation, and other items that cause excessive arc duration. These situations cause a longer clearing time, which may gradually increase to infringement on the breaker failure time; (iii) Mechanism Problems - Mechanical issues such as worn parts, “frozen” linkages, faulty latches, and pneumatic or hydraulic system malfunctions. These problems may either gradually develop (degradation), or suddenly develop from a component failure and (iv) Control Circuit Failure - Shorted coils, open coils, open or shorted circuits. These problems may either develop suddenly, as in a short circuit from wire abrasion or open circuit from termination failure, or gradually, as in insulation breakdown in a coil leading to a short.Murthy (2007) proposed a replacement model for items that fail suddenly. His model assumed that replacement cost is constant over time. Again, he utilized relative frequency approach in the calculation of probabilities of failure.Enogwe et al. (2018) modified Murthy (2007) model to accommodate replacement cost that are random in nature. They further utilized goodness-of-fit test to select the probability distribution that best describe the failure time and replacement cost and their model was regarded as modified (MODI) replacement model.
3. Methodology
The method of analysis adopted in this study is the modified (MODI) replacement model for items that fail suddenly. The modified (MODI) replacement model for items that fail suddenly consists of the individual and group replacement policies. The modified (MODI) individual replacement policy is given by Enogwe et al. (2018) as: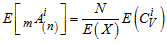 | (1) |
where is the expected value of the modified average cost of individual replacement per period
 is the expected life of the LED light bulband N is the total number of LED light bulbs in the hotel rooms.
 is the probability of items that fail at the end of jth periodk is the end of the period of each replacement
 is the variable cost of replacing an individual item on its failure
 is the variable cost of replacing an individual item on its failure.Similarly, the modified (MODI) group replacement policy is given by Enogwe (2018) as:
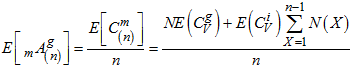 | (2) |
On the basis of Equation (2), we obtain the following replacement policies.Policy I: States that group replacement should not be made at the end of nth period if the expectation of modified average cost of individual replacement at the end of (n-1)th period is not less than the overall expectation of average cost per unit period by the end of (n-1) periods. Symbolically, we have 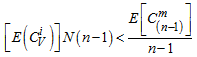 | (3) |
Policy II: States that group replacement should be made at the end of nth period if the expectation of modified average cost of individual replacement for the nth period is greater than the overall expectation of average cost per unit time period through the end of n periods. Symbolically, we have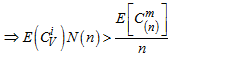 | (4) |
 | (5) |
3.1. Steps of Determining the Age of Replacement Using Modified (MODI) Replacement Model
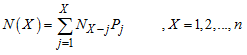
The steps involved in the implementation of the modified optimal replacement model for items that fail suddenly are as given below:Step 1: Calculate the probabilities of failure Pj of the LED light bulbs. This is done after we have used goodness-of-fit test to determine the distribution of failures. On the basis of the distribution of failure times, we compute the values of Pj (Enogwe, 2018).Step 2: Calculate the expected life of each LED light bulbs using the relation given in Murthy (2007): Step 3: Calculate the values of
  and
and  and hence the cost of individual replacement of the LED light bulbs by using the relation:
 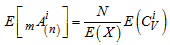 Step 4: Calculate the values of Nj using the relation given in Gupta and Hira (2013):
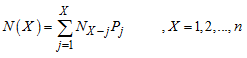 Step 5: Calculate the cost of replacement of all LED light bulbs at the same time using the relation:
 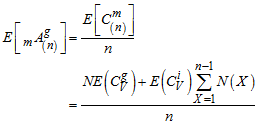 Step 6: Adopt either Policy I or Policy II
4. Data Analysis
4.1. Estimation of Probability of Failure for LED Light Bulbs
In order to estimate the probability distribution of failure times of the LED light bulbs, we first plot the histogram of the failure time data as follows: 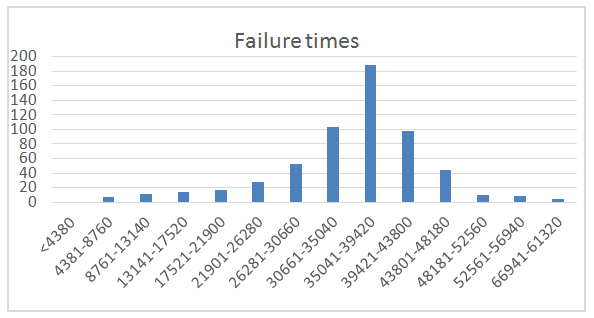 | Figure 1. Histogram of LED light bulb failure times |
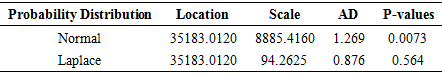
It is clear from Figure 1 that the data on failure times of the LED light bulbs is symmetric. This is true because the coefficient of skewness of the sample is 0.0000004, which is near zero. We then apply the Anderson-Darling (AD) test to determine the best distribution for the failure time of LED light bulbs from amongst the symmetric distributions (Normal and Laplace) and the results are shown in Table 1.Table 1. Maximum likelihood estimates of distribution parameters and Anderson-Darling (AD) statistics for the selected distributions for failure times of LED bulbs
 |
| |
|
As shown in Table 1, the Laplace distribution fits the failure time data because the P-value for the Anderson-Darling (A-D) statistic is greater than the 0.05 level of significance. Consequently, the fitted Laplace distribution is as given below: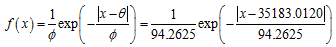
4.2. Determination of Probability Distribution of Individual Cost of Replacement
In order to determine the probability distribution of individual replacement cost of the LED light bulbs, we again plot the histogram of the individual replacement cost as follows: 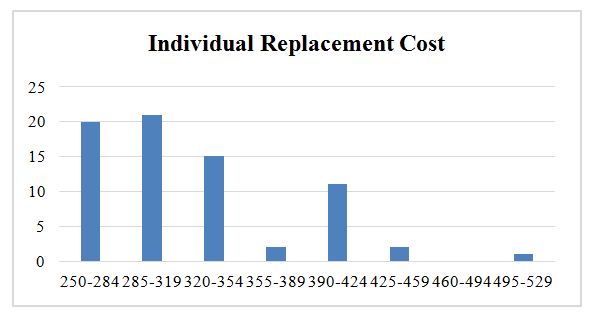 | Figure 2. Histogram for Individual Replacement Cost |
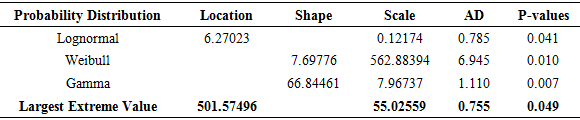
As shown in Figure 2, the individual replacement cost is skewed to the right. We then used Anderson-Darling (AD) test to determine the best distribution for the individual replacement cost from amongst the right-skewed distributions (Gamma, Webull, and Largest Extreme) and the results are shown in Table 2.Table 2. Maximum likelihood estimates of distribution parameters and Anderson-Darling (AD) statistics for the selected distributions for individual replacement cost
 |
| |
|
As shown in Table 2, we can see that the P-value for Largest Extreme Value distribution is greater than  significant level, therefore, we conclude that the Largest Extreme Value distribution with
  and
and  , fits the individual replacement cost.
4.3. Determination of Probability Distribution of Group Replacement Cost
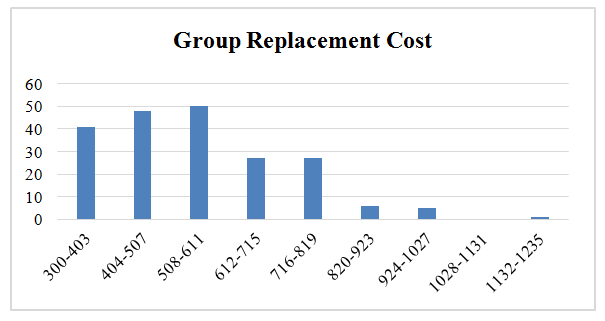 | Figure 3. Histogram for Group Replacement Cost |
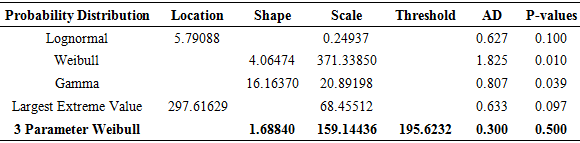
As shown in Figure 3, the group replacement cost is skewed to the right. We again used Anderson-Darling (AD) test to determine the best distribution for the individual replacement cost from amongst the right-skewed distributions (Lognormal, Weibull, Gamma, and Largest Extreme and many others) and the results are shown in Table 3.Table 3. Maximum likelihood estimates of distribution parameters and Anderson-Darling (AD) statistics for the selected distributions for group replacement cost
 |
| |
|
From Table 3, we observe that the Weibull (two “1”) distribution with parameters 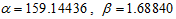 and
and  fits the group replacement cost data well.
4.4. Estimation of Modified Expected Value of Individual Replacement Cost
By utilizing the estimated parameters of the fitted cost distributions in Table 2, we obtain the expected value of individual replacement cost as: 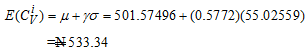 where
where  is the location parameter,
  is the scale parameter and
  is the Euler’s constant, usually taken to be approximately equal to 0.5772.
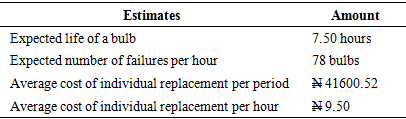
4.5. Estimation of Expected life of LED Light Bulbs
The results of the individual replacement policy are summarized in Table 4.Table 4. Individual replacement calculations for the data set under the proposed model
 |
| |
|
From Table 4, we observe that LED bulbs burn for about 7.53 hours and about 78 bulbs failed per hour, resulting to an average individual replacement cost of about ₦41,600.52 per period of replacement or ₦12.47 per hour.
4.6. Estimation of Modified Expected Value of Individual and Group Replacement Cost
By utilizing the estimated parameters of the fitted cost distributions in Table 3, we obtain the expected value of group replacement cost as: where
where  is the scale parameter,
  is the location parameter and
  is the Threshold parameter.
4.7. Estimation of Expected Number of Failures, 
Let  be the number of replacements made at the end of the jth period, if all the
  LED light bulbs are initially new. Thus, the expected number of failures at different hours is calculated using Equation (5) and the results are given as follows:
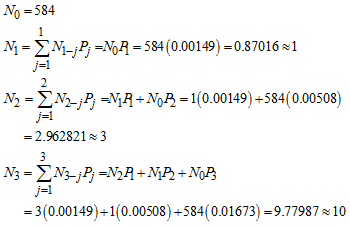 Other values of
  are calculated in the same manner.
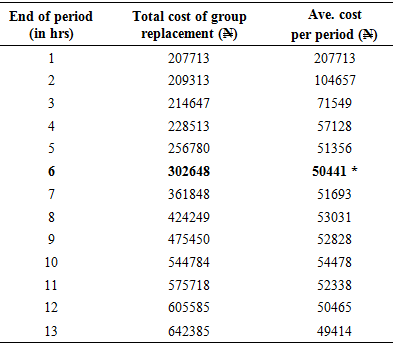
4.8. Estimation of Average Modified Group Replacement Cost
Notably, the asterisked value (i.e., 50441) in Table 5 is the minimum cost of replacement for the LED light bulbs.Table 5. Average group replacement cost of LED light bulbs
 |
| |
|
From Table 5, since the average cost per period (₦50,441.00) is obtained in the 6th period, it is optimal to have a group replacement after every 6th period (i.e., after every 30660 burning hours). Since the average group replacement cost period (₦50,441.00) is higher than the average individual replacement cost per period (₦41,600.52), it is better to stick to individual replacement policy.
5. Summary, Conclusions and Recommendations
This work discusses the application of modified (MODI) replacement model for items that fail suddenly using data obtained from Links Hotels, Owerri. The ultimate objective is to construct a MODI replacement model that could be used to predict when to replace LED light bulbs and to determine the average cost of implementing such replacements in hotel industries. The result of goodness-of-fit test shows that the Largest Extreme Value distribution with  and
and  , fits the individual replacement cost while the Laplace distribution fits the failure time data. The result showed that the LED bulbs burn for about 7.53 hours and about 78 bulbs failed per hour, resulting to an average individual replacement cost of about ₦41,600.52 per period of replacement or ₦12.47 per hour. In addition, it was observed that individual replacement of LED bulbs is required from period 1 (i.e., between 4381 and 8760 hours) through period 6 (i.e., between 26281 and 30660 hours), and after period 6 (i.e., between 26281 and 30660 hours), the group replacement is implemented with a replacement cost of about ₦54,450.00. Consequently, the study recommended the use of individual replacement policy for the hotel under investigation over the group replacement policy.
ACKNOWLEDGEMENTS
The authors are grateful to the reviewers for their constructive comments and suggestions, which have helped to significantly improve both the content and exposition of this paper.
References
| [1] | Barkan, J.A. Deni, A.K. McCabe, J.G. Reckleff, H.N. Scherer, Jr., R. C. Woodward, (1988). Methodology for Monitoring the Condition of High Voltage Circuit Breakers,” CIGRE, Session, 13-04. |
| [2] | Barlow, R. and Proschan, F.H. (1965). Mathematical Theory of Reliability. John Wiley, New York. |
| [3] | Blanche, K.M. and Shrivastava, A. B. (1994). Defining failure of manufacturing machinery and equipment. In proceedings from the Annual Reliability and Maintainability Symposium. |
| [4] | Chaves, J. (2015). Introduction to Nonimaging Optics, Second Edition. CRC Press. |
| [5] | Enogwe, S.U. (2018). A Modified Optimal Replacement Policy for Items That Fail Suddenly. An Unpublished M.Sc Thesis, Department of Statistics, Michael Okpara University of Agriculture, Umudike, Abia State-Nigeria. |
| [6] | Enogwe, S.U., Oruh, B.I. and Ekpenyong, E.J. (2018). A Modified Replacement Model for Items That Fail Suddenly with Variable Replacement Costs. American Journal of Operations Research, 8. 457-473. |
| [7] | Feldman, R. M. (1976). Optimal replacement with semi-Markov shock models. Journal of Applied Probability, Vol. 13, No. 1 (Mar., 1976), pp.108-117. |
| [8] | Fred, S. E. (2006). Light-Emitting Diodes. Cambridge University Press. |
| [9] | Gupta, P.K. and Hira, D.S. (2013). Operations Research. Revised Edition. S. Chand and Co Ltd., New Delhi, India. |
| [10] | Murthy, P.R. (2007). Operations Research. 2nd Edition, New Age International Ltd., Publishers, New Delhi, India. |
| [11] | Sharma, J.K. (2009). Operations Research: Theory and Applications. 4th Edition, Macmillan India Ltd., New Delhi. |

 Abstract
 Reference
 Full-Text PDF
 Full-text HTML