-
Paper Information
- Paper Submission
-
Journal Information
- About This Journal
- Editorial Board
- Current Issue
- Archive
- Author Guidelines
- Contact Us
American Journal of Mathematics and Statistics
p-ISSN: 2162-948X e-ISSN: 2162-8475
2020; 10(1): 1-9
doi:10.5923/j.ajms.20201001.01

Comparative Study of an ANN-ARIMA Hybrid Model for Predicting Karachi Stock Price
 Abstract
 Reference
 Full-Text PDF
 Full-text HTML
Shafaq Ayub 1, 2, Yasmin Zahra Jafri 1
1Department of Statistics, University of Balochistan, Quetta, Pakistan
2Agriculture Research Institute, Quetta, Pakista
Correspondence to: Shafaq Ayub , Department of Statistics, University of Balochistan, Quetta, Pakistan.
| Email: |  |
Copyright © 2020 The Author(s). Published by Scientific & Academic Publishing.
This work is licensed under the Creative Commons Attribution International License (CC BY).
http://creativecommons.org/licenses/by/4.0/

Autoregressive Integrated Moving Average (ARIMA) has been considered a popular linear model for forecasting time series. Artificial Neural Network (ANN) has been considered a powerful tool which is used to define the complex economic relationships with various patterns. In this study, the forecasting performance of Hybrid ANN-ARIMA is compared with Autoregressive Integrated Moving Average (ARIMA) and Artificial Neural Network (ANN) of KSE viz. National Foods (NATF) and Engro Foods (EFOOD). Experimental results obtained show the excellence of Hybrid NN-ARIMA model over ANN and ARIMA, respectively. Further, it can be concluded that Hybrid ANN-ARIMA model has the best forecasting accuracy for forecasting stock price.
Keywords: Time Series forecasting, Artificial Neural Network, ARIMA model, Zhang’s Hybrid model
Cite this paper: Shafaq Ayub , Yasmin Zahra Jafri , Comparative Study of an ANN-ARIMA Hybrid Model for Predicting Karachi Stock Price, American Journal of Mathematics and Statistics, Vol. 10 No. 1, 2020, pp. 1-9. doi: 10.5923/j.ajms.20201001.01.
Article Outline
1. Introduction
- A stock market defined as collection of buyers and sellers of stocks. Stock market is an essential part in country's economy. Karachi Stock Exchange (KSE) is oldest stock exchange of Pakistan. KSE is considered to be one of the best performing markets of Asia. Time series forecasting is very important in the research field over many years due to its various applications. Stock price prediction is one of the most popular issues in economics and finance which has motivated the researchers to develop better predictive model over the years. Time series data has increasing or decreasing trends having different characteristics. Statistical predicting models are used to develop forecasting methodology by using the data to predict stock values with the help to identify the trends of data.ARIMA (Box and Jenkins) as statistical technique is widely used for forecasting and analysis of time series data in different fields as social sciences, engineering, finance and agriculture [1]. ARIMA model is considered to be an efficient model in financial time series forecasting. ARIMA model has been explored in many literatures for better prediction of stationary time series data. ARIMA models represent different kinds of time series as AR, MA and ARMA series [2]. ARIMA models are flexible in nature and have powerful and efficient capability than other structural models to generate short run stock price forecasting [3]. Artificial Neural Network (ANN) a soft computing technique commonly used for forecasting time series with a high point of accuracy in different fields as social sciences, industry, business, finance and stock problems [3]. ANN performance is better than ARIMA when data show maximum volatility and multicollinearity. ANN is efficient for solving nonlinear real world problems; therefore it is not required to make data stationary. In this paper, the performance of ARIMA and ANN for stock prices forecasting is being compared and it further clarifies the superiority of each of the following models over one another. ANN model provided effective results as compare to ARIMA. The combination of different models or Hybrid models have been frequently used for better stock price prediction by manipulating the unique strength of each of the models [4]. A combination of ANN and ARIMA provide more precise predicting model for forecasting time series data as compared to an individual model [14]. The results being obtained from all datasets clarify that Hybrid model has higher prediction accuracy for one-step and multi-step ahead forecasts and a various number of NN models and Hybrid models have been used for obtaining accurate prediction [16-17]. In this paper, Hybrid model is developed by using unique modeling techniques of ARIMA and ANN for better forecasting performance and the performance of Hybrid model is contrasted with ANN and ARIMA.
2. Literature Review
- In this literature, the search for the productive stock price forecasting methods is studied for the sake of better results. Buyuksahin et al. [1] presented ARIMA –ANN Hybrid method that works in a more general structure and study revealed that ARIMA provides better forecasting accuracy with stationary data while ANN is more suitable for non-stationary data. The empirical results obtained from ARIMA indicated that ARIMA models are suitable to predict stock prices on short term forecasting. Zhang et al. [2] defined that Hybrid methodology of model is proposed to take advantage of unique strength of ANN and ARIMA in nonlinear and linear modeling respectively. Results showed that combined model has improved forecasting accuracy as compared to model are used individually. Adebiyi et al. [3] worked in comparison of the forecasting performance of ANN and ARIMA for forecasting New York Stock Exchange time series data. The study revealed that both models can achieve good forecasted results for stock price prediction. Merh et al. [5] worked to develop Hybrid models of ARIMA and ANN for forecasting future stock price index of Indian stock market viz. SENSEX, BSE Oil & Gas, BSE IT, S&P CNX Nifty and BSE 100. The results showed that work of Hybrid ANN-ARIMA better than Hybrid ARIMA-ANN. Xiong; L. et al. [6] introduced Hybrid ARIMA-BPNN for predicting the stock price of Chinese stock market. Hybrid ARIMA-BPNN model to forecast time series data of Chinese Stock Index, BPNN defines nonlinear structure and ARIMA defines linear structure and future values are predicted. Prybutok et al. [7] contrasted forecasting work of ARIMA, regression and ANN in predicting ozone concentration. The finding showed ANN provided better performance as compared to regression and ARIMA. The work reported in [9] compared the performance of ANN and ARIMA in forecasting Korean Stock Index. ARIMA provided more reliable forecasts as compared to BPNN model. Wijaya et al. [10] showed a comparison between ANN model and ARIMA model based on Indonesia Stock Exchange and results showed ANN provided better performance than ARIMA model. Khashei et al. [12] compared the work of ARIMA-MLP and MLP-ARIMA models for predicting Stock index. The results showed MLP-ARIMA Hybrid model provided better results than ARIMA-MLP. Tang et al. [13] discussed the results of a comparative study of the work of ANN and ARIMA for forecasting time series. The results proved that NN is better in the long term forecasting while Box-Jenkins model is better for short term forecasting. Babu et al. [14] explored ARIMA and ANN to tool a new Hybrid model for better prediction of time series. The results defined that Hybrid model which combines power of ANN and ARIMA is better than individual models. Wang et al. [15] presented Hybrid model combining ARIMA, ESM and BPNN for predicting Stock Index. The results of work reported in [19-20] indicated that Hybrid models improve the accuracy of ANFIS and ARIMA for time series forecasting. Taskaya-Temizel et al. [23] combined ARIMA and TDNNs models to form hybrid model to forecast nine real data sets. The results defined that Hybrid models don’t always perform well as model selection process plays an important role in the popularity of Hybrid models. Zhou et al. [24] suggested Hybrid model based on ARIMA model and Grey to predict gyro drift. It is concluded Hybrid method has a higher forecasting accuracy to real problems than single method.This paper further clarifies the conflicting views reported in literature reviews about the excellence of ANN over ARIMA in forecasting stock prices and Hybrid model to improve forecasting accuracy of time series by using unique strengths of ARIMA and ANN. The experimental results obtained are built on the study of stock price forecasting using data from KSE.
3. Research Methodology
3.1. Data Collection
- Data used in this research work is daily stock prices of two different products of Food and Personal care named National Foods and Engro Foods listed in KSE. Stock data included open, low, high and close prices of National Foods and Engro Foods. In this paper, close price is selected to be predicted and modeled as closing price defines every activity of stock price index of whole day. Matlab R2014a and Eviews9 are used for simulation of ANN model and ARIMA model, respectively. The data is taken from www.kse.pk.com.
3.2. Autoregressive Integrated Moving Average (ARIMA) Model
- Autoregressive Integrated Moving Average (ARIMA) is considered to be a powerful model that is applied to time series data. ARIMA models are based on three parameters i.e. autoregressive (p), moving average (q) and first differencing (d) of the time series. First, time series is transformed into stationary by differencing and suitable ARMA model is fitted to the series.General form of ARMA model is written as follows:
 | (1) |
3.2.1. ARIMA (𝑝, 𝑑, 𝑞) Model for National Foods (NATF) Stock Price
- NATF data is taken from the period 1st January, 2015 to 30th April, 2019 having total number of 1019 observations. The initial pattern of National Foods is illustrated in Figure 1 to review whether given series is stationary or not.
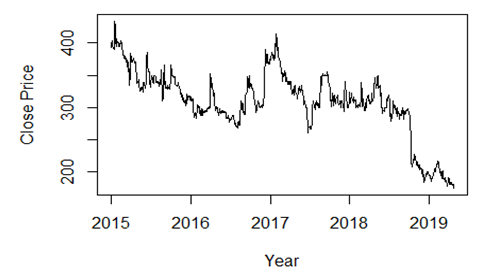 | Figure 1. Graphical representation of NATF closing price index |
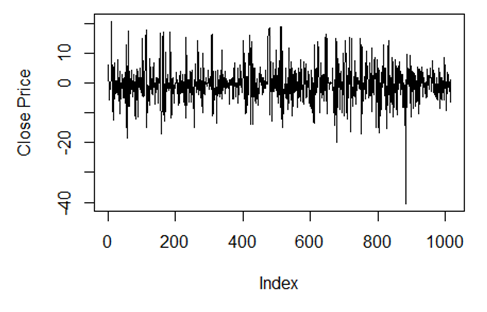 | Figure 2. Graphical representation of NATF stock index after differencing |
3.2.2. ARIMA (𝑝, 𝑑, 𝑞) Model for Engro Foods (EFOODs) Stock Price
- EFOOD data used in this study was taken from the period 1st January, 2015 to 30th April, 2019 having total no of 1077 observations. Figure 3 illustrates the pattern of EFOODs time series and series is found to be nonstationary.
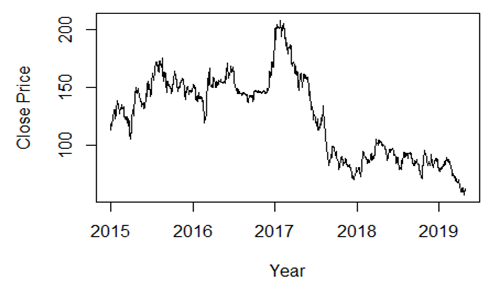 | Figure 3. Graphical representation of EFOOD closing price index |
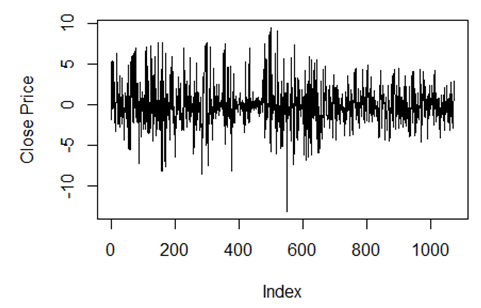 | Figure 4. Graphical representation of EFOODs stock index after differencing |
3.3. Artificial Neural Network Model
- NN is set of artificial neurons, perceptrons, nodes and groups of processing units that process and transfer information through activation functions. ANN is widely used for estimating the model and prediction. ANN is a nonlinear network and it is suited for prediction purpose because it doesn’t make assumptions. NNs model is referred for various predictive data mining applications because of its power, adaptability and a high level of accuracy. Multilayer perceptron (MLP) is most commonly used for forecasting time series. MLP network has input, output and hidden layer [18] and the nodes of one layer are linked with the nodes of the following layer to send information. The link between i and j nodes of the following layers is attached with a weight ωij.For the sake to choose best training algorithm for ANN model, several empirical results are made by changing the number of hidden nodes and layers with various training algorithms. The accuracy of NN can be increased by increasing the size of a number of layers and nodes. [1]
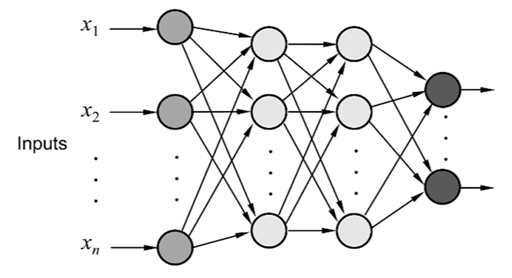 | Figure 5. Multilayer Feed Forward Neural Network |
3.3.1. Artificial Neural Network Model for National Foods (NATF)
- This study utilized a three-layer MLP model trained with back propagation algorithm. Open, high, low and close price of NATF time series data is taken to construct ANN. The constructive model of ANN involves input neurons, hidden layers with number of hidden neurons and output neurons. For the sake to establish predictive model, the data is normalized having a range between 0 and 1 by using the formula:
 | (2) |
 | (3) |
|
3.3.2. Artificial Neural Network Model for Engro Foods (EFOODs)
- MLP model contains three layers that are used to utilize EFOOD time series data. Open, high, low and close price of EFOOD is taken to construct ANN. For sake to train feed-forward backpropagation is used as network type. Open, high, low price taken as input data and close price is taken as a target data, TRAINGDM as training function, LEARNGDM as adaptation learning function, TANSIG is taken as transfer function and performance function MSE. The training parameters are set as lr = 0.01, mu = 0.9 and data is instructed with 1000, 2000 and 5000 epochs with different ANN structures.
|
3.4. Hybrid Model
- Zhang presented Hybrid ARIMA-ANN model [1, 15] to get more precise results as compared to using ARIMA and ANN individually. Hybrid techniques are used to divide time series data into its linear and nonlinear shape [1]. Various Hybrid techniques have been used for many years to take advantage of the unique strengths of each various types of models in real life data sets. The purpose of combining the models is due to the assumption that a single model can’t define all the characteristics of time series [12]. Hybrid ANN-ARIMA technique is proposed by Zhang [1,15] and Khashei et al. [1,24] that define the relationship between two components. Time series yt can be defined as:
 | (4) |
 | (5) |
 is the predicted values of ANN model. Secondly, ARIMA model forecasts linear component then the results are combined together to improve the performance of models. The new time series can be defined as:
 | (6) |
 is forecasted value from ARIMA model based on the residual data.
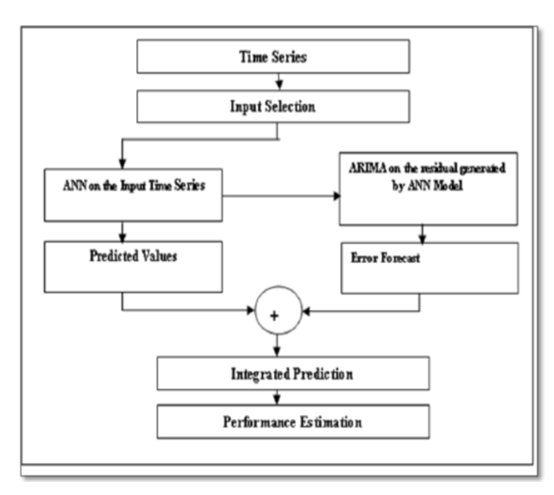 | Figure 6. Hybrid ANN-ARIMA Flow Chart |
4. Results and Discussion
- MatlabR2014a and Eviews9 are used for simulation of ANN and ARIMA, respectively. The experimental results are being obtained is described below:
4.1. Results of ARIMA Models
4.1.1. Result of ARIMA Model for National Foods Stock Price Prediction
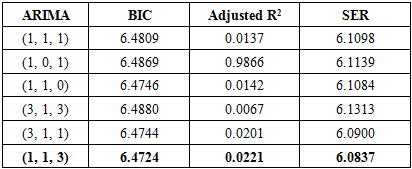
- ARIMA (1, 1, 3) is considered to be the best model for National Foods (NATF) to give the best forecast values having least BIC of 6.4724 and smallest SER of 6.0837. The best model showed as follows:
 | (7) |
 is a residual.
|
|
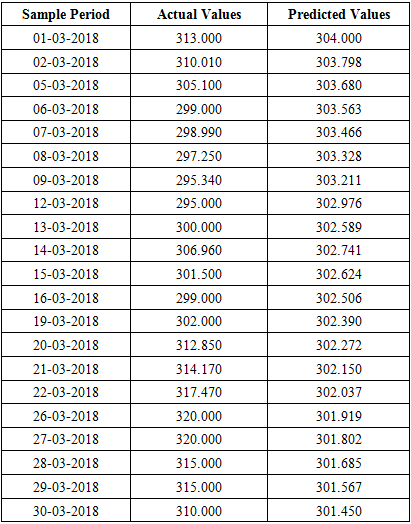
 | Figure 7. Graph of actual stock prices vs predicted stock prices of NATF using ARIMA |
4.1.2. Result of ARIMA Model for Engro Foods Stock Price Prediction
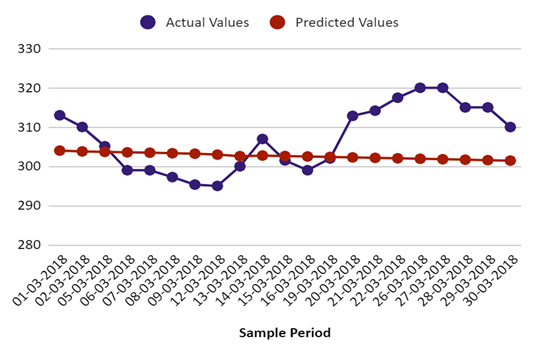
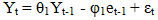
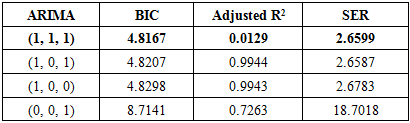
- ARIMA (1, 1, 1) is found to be best model for Engro Foods according to above-mentioned criteria with BIC of 4.8167 and smallest SER of 2.6599. The best model showed as follows:
 | (8) |

|
|
 | Figure 8. Graph of actual stock prices vs predicted stock prices of EFOOD using ARIMA |
4.2. Results of ANN Models
4.2.1. Result of ANN Model for National Foods Stock Price Prediction
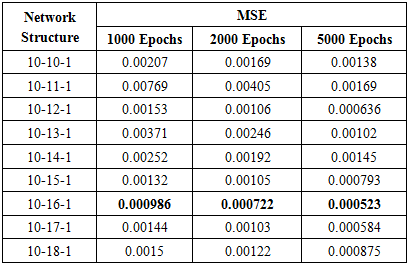
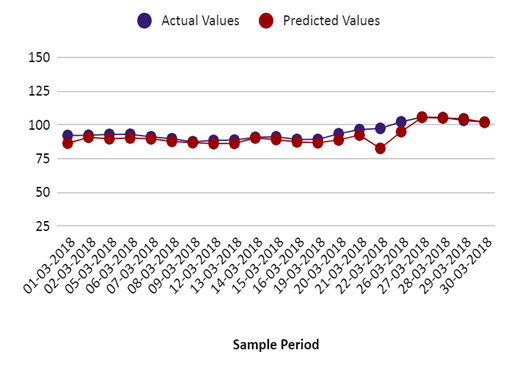
- Many experiments of various network architecture based on ANN are performed. The network structure with smallest MSE was considered to give the best prediction results. It was noticed that 10-16-1 (10 inputs, 16 hidden neurons in hidden layers and 1 output) is best forecasted model of daily price prediction with a high level of accuracy. The results of ANN are presented in Table 7 and Figure 9 is a graphical representation of ANN model of actual values against forecasted values for National Foods.
|
 | Figure 9. Graph of actual stock prices vs predicted stock prices of NATF using ANN |
4.2.2. Result of ANN Model for Engro Foods Stock Price Prediction
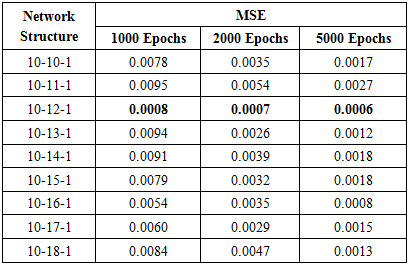
- Many experiments of various network architecture based on ANN are performed. It was noticed that 10-12-1 (10 inputs, 12 hidden neurons in hidden layers and 1 output) is best forecasted model of daily Efood stock price prediction with a high level of accuracy. The results of ANN model are presented in Table 8 and Figure 10 is a graphical representation of ANN of actual values against forecasted values for Engro Foods stock index.
|
 | Figure 10. Graph of actual stock prices vs predicted stock prices of EFOOD using ANN |
4.3. Hybrid ANN-ARIMA Model Results
4.3.1. Hybrid Model for Forecasting National Food (NATF)
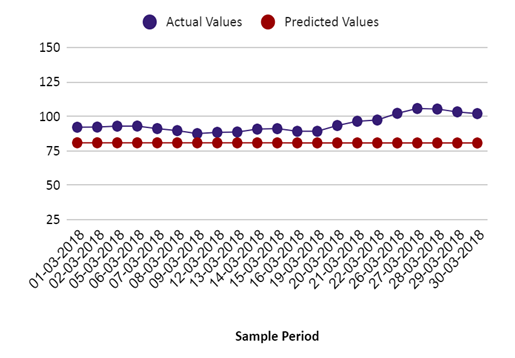
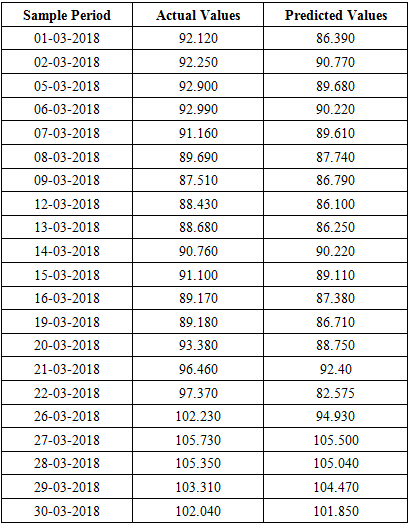
- There are two steps to build Hybrid ANN-ARIMA model for forecasting NATF as follows:In first step, ANN is used to predict close price of NATF and residuals et is produced and provided to ARIMA to predict error. In second step, the predicted close price by ANN is summed with error produced by ARIMA model to give the final predicted values. Where et = Yt - Nt, Yt is time series while Nt is the nonlinear component. ARIMA is used to reproduce et to generate forecast series of NATF. Table 9 defines the performance of Hybrid ANN-ARIMA verses ANN and ARIMA and Figure 11 defines graphical representation of Hybrid model of NATF against ANN and ARIMA.
|
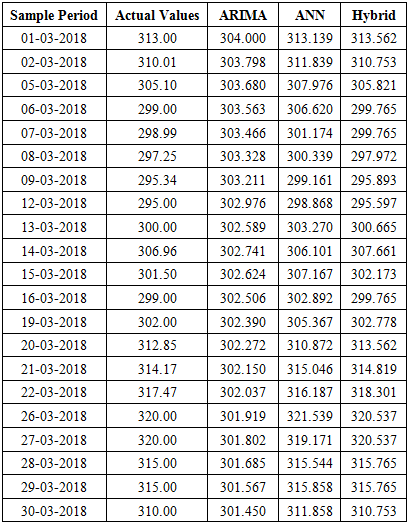
 | Figure 11. Graph of actual stock prices vs predicted stock prices of NATF using Hybrid model |
4.3.2. Hybrid Model for Forecasting Engro Foods (EFOODs)
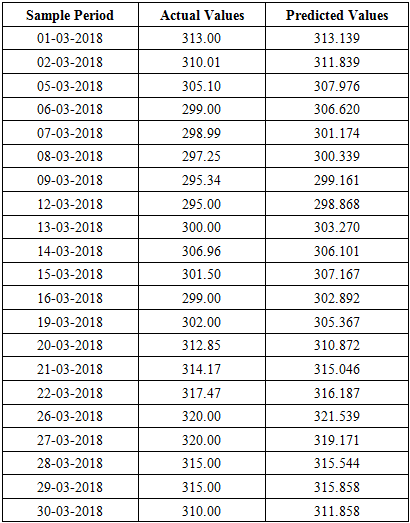
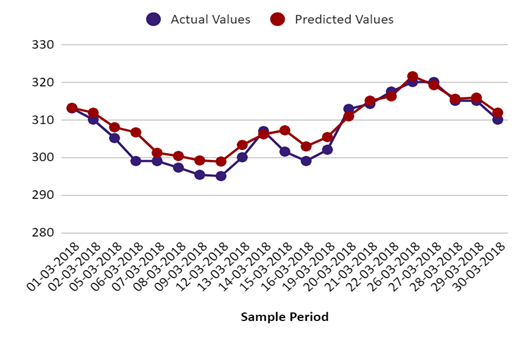
- Hybrid ANN-ARIMA model to forecast EFOOD consists of following two steps:In first step, ANN is used to predict close price of EFOOD then the residuals et being produced are provided to ARIMA to predict the error. In second step, the predicted close price by ANN is summed with error produced by ARIMA to give the final predicted values. Where et = Yt - Nt, Yt is time series while Nt is the nonlinear component. ARIMA is used to reproduce et to generate forecasted series of EFOOD. Table 10 defines the performance of Hybrid ANN-ARIMA verses ANN and ARIMA and Figure 12 defines graphical representation of Hybrid model of EFOOD against ANN and ARIMA.
|
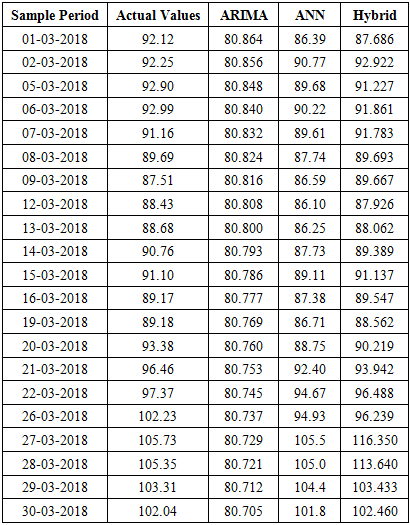
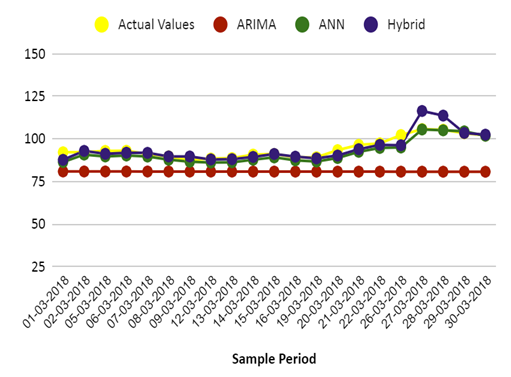 | Figure 12. Graph of actual stock prices vs predicted stock prices of EFOOD using Hybrid model |
5. Conclusions
- In this paper, the experimental results are being obtained by using ARIMA, ANN and Hybrid ANN-ARIMA for predicting NATF and EFOOD stock prices index. The performance of Hybrid model is compared with Artificial Neural Network (ANN) and ARIMA. ANN is applied to identify the nonlinear structure of data while ARIMA model is used to identify the linear structure of data. We also observed that ANN provided better results as compared to ARIMA where the pattern of ARIMA models is directional. In further studies, Hybrid ANN-ARIMA model achieved good forecasted values as compared to ARIMA and ANN. The work also clarified the contradictory theory reported in literature about the excellence of Hybrid model over ANN and ARIMA.