Fatoki Olayode
Department of Statistics, Ogun State Institute of Technology, Igbesa, Ogun State
Correspondence to: Fatoki Olayode, Department of Statistics, Ogun State Institute of Technology, Igbesa, Ogun State.
| Email: |  |
Copyright © 2019 The Author(s). Published by Scientific & Academic Publishing.
This work is licensed under the Creative Commons Attribution International License (CC BY).
http://creativecommons.org/licenses/by/4.0/

Abstract
We introduce a new lifetime distribution which is the generalization of Rayleigh distribution using the Topp-Leone generated family of distributions proposed by Rezaei et al. The new distribution is called the Topp-leone Rayleigh (TLR) distribution. The new distribution was found to be more flexible in modeling data that exhibits increasing, decreasing, non-monotone failure rate. Expressions for several probabilistic measures were provided, such as probability density function, hazard function, moments, quantile function, mean, variance and median, moment generating function, orders statistics etc. Inference is maximum likelihood based and tractability of model was shown by its application to a real data set.
Keywords:
Moment generating function, Rayleigh distribution, Survival function, Order statistics
Cite this paper: Fatoki Olayode, The Topp-Leone Rayleigh Distribution with Application, American Journal of Mathematics and Statistics, Vol. 9 No. 6, 2019, pp. 215-220. doi: 10.5923/j.ajms.20190906.02.
1. Introduction
Rayleigh distribution was first introduced by Rayleigh [6], Siddiqui [8] discussed theorigin and properties of the Rayleigh distribution also Lalitha et al. [4] and Abd Elfattah et al. [3]. Faton Merovci [5], generalizes the Rayleigh distribution using the quadratic rank transmutation map which was introduced by Shaw et al. [7] and named it Transmuted Rayleigh distribution. Inference for Rayleigh model has been considered by Sinha and Howlader [9]. Ahmad et al. [2] developed the Transmuted Inverse Rayleigh distribution and discussed its properties, Afaq Ahmad et al [1], examined the characterisation of the transmuted Rayleigh distribution. The probability density function (pdf) of Rayleigh distribution is given as: | (1) |
For real positive values of the variable  and a real positive parameter
  . It is named after the British physicist Lord Rayleigh (1842–1919). parameter
  is simply a scale factor.Integrating the equation (1) above will yield the cumulative density function of Rayleigh distribution given as
 | (2) |
2. Topp-leone Rayleigh Distribution
We shall refer to the new distribution using (3) and (4) as the Topp-Leone Rayleigh (TLR) distribution using the Topp-Leone generated (TLG) family of distributions which was introduced by Rezaei, S et al. The pdf and cdf of the TLG family of distributions are given by  | (3) |
And | (4) |
Where  is the shape parameter and ζ is the parameter vector of the baseline distribution G inserting equation (2) into (3), we have the cumulative density function of Topp-Leone Rayleigh distribution given as
 | (5) |
The graph of the cumulative density of the TLR distribution is given below for various values of the parameters.By differentiating the equation (5) above, we obtain the Pdf of TLR distribution given as  | (6) |
Using both the Taylor series and Prudnikov series expansion which is given respectively as follows | (7) |
 | (8) |
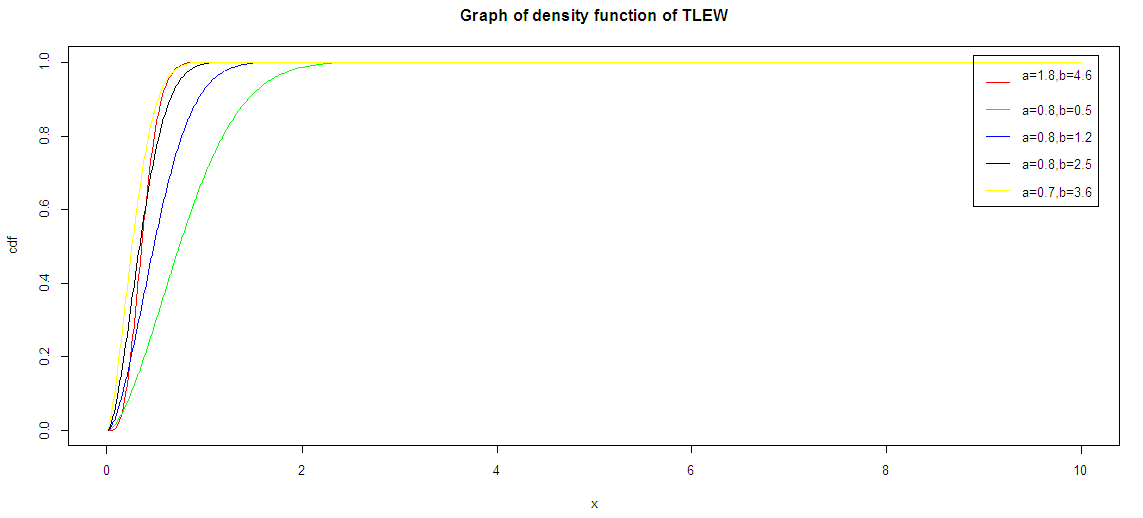 | Figure 1. The figure above shows the pdf of TLR distribution is a proper cdf |
On the equation (6) above then we have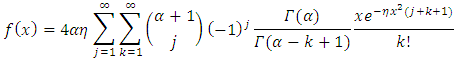 | (9) |
The graph of the probability density function for the TLR distribution is given below for various values of the parameters.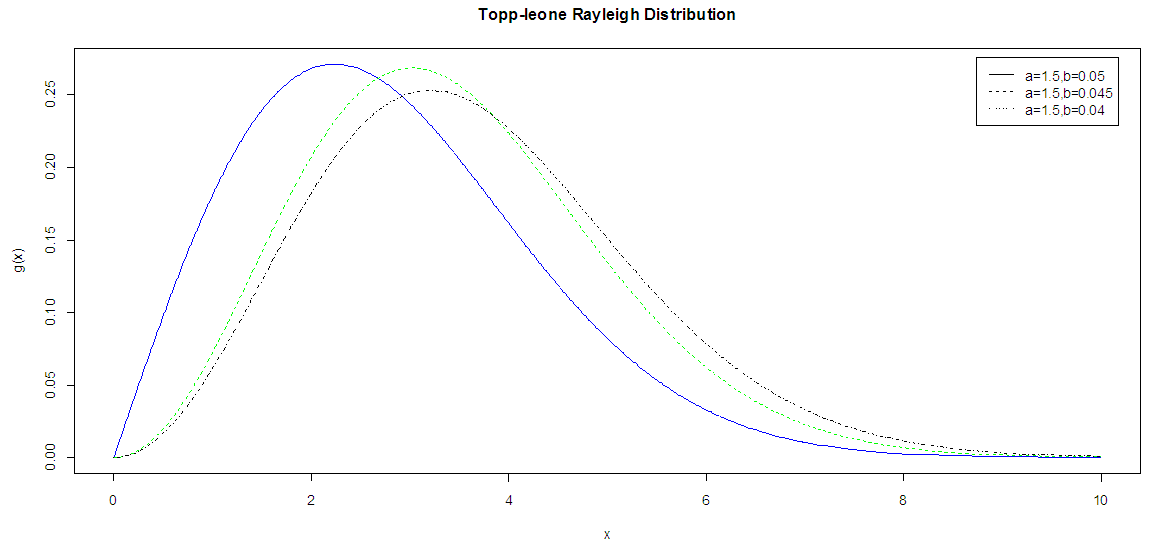 | Figure 2. The graph of the pdf of TLR distribution (P The graph of the pdf of ECTW distribution drawn above indicates that the distribution is positively skewed and unimodal) |
3. Reliability Function
The reliability function or the survival function of a random variable  is defined by
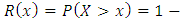
 It could be interpreted as the probability of a system not failing before some specified time
  The reliability function of the Topp-leone Rayleigh is given by
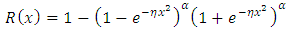 | (10) |
The graph of the Reliability function of Topp-leone is drawn below for various values of the parameters.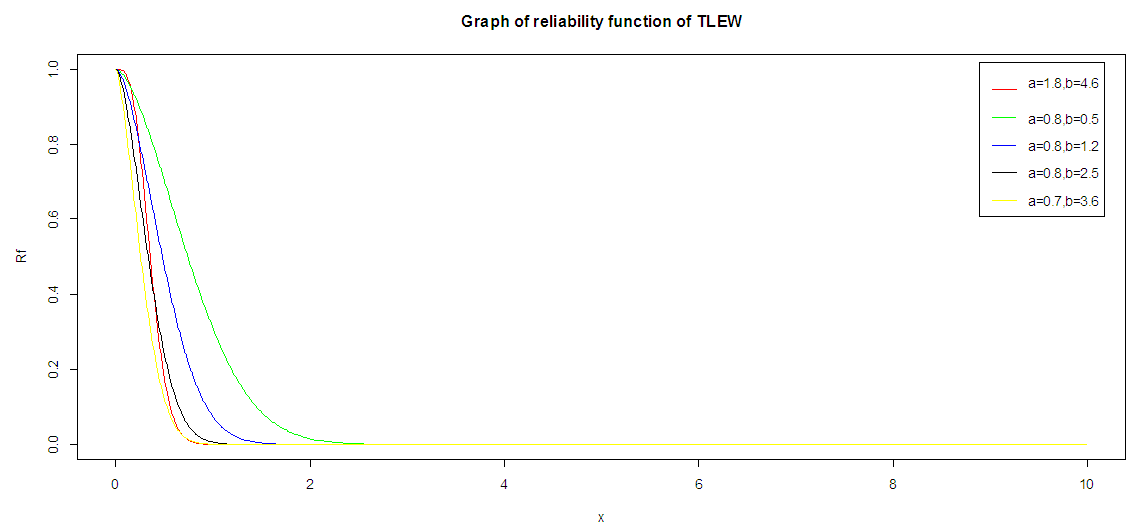 | Figure 3. The graph of the survival function of TLR distribution (P The graph of the reliability function drawn above shows that as the time increases the reliability probability decreases) |
4. Hazard Function
The hazard rate function  or the instantaneous failure rate of a random variable
  is the probability that a system fails given that it has survived up to time
  and is given by
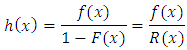 | (11) |
Then the hazard rate function of TLR distribution is given as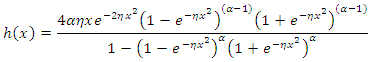 | (12) |
The graph of the hazard function for various values of the parameters is given as 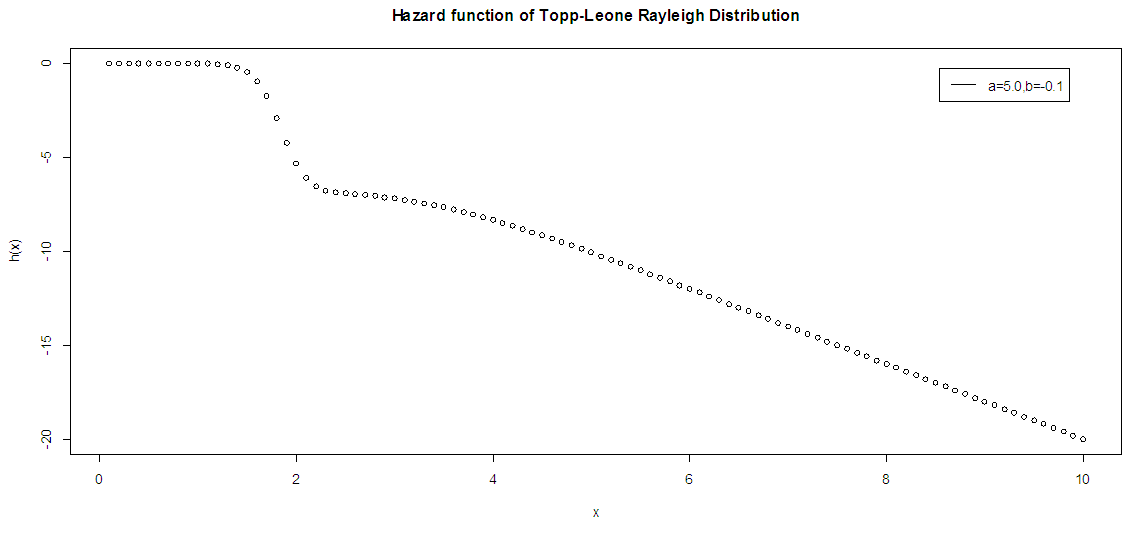 | Figure 4. The graph of the hazard function of TLR distribution |
5. Moments, Mean, Variance, Kurtosis and Skewness of (TLR) Distribution
In this section we shall present the moments and qunatiles for the (TLR) distribution. The  order moments, for (TLRD) can be obtained as follows for a random variable X,
 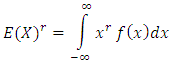 | (13) |
Putting equation (7) in (13) we have 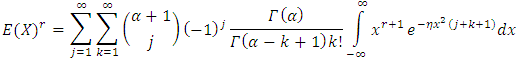 | (14) |
By letting 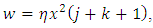 finally we have
 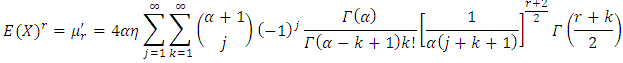 | (15) |
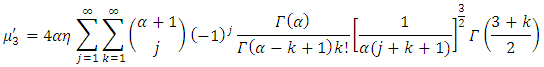
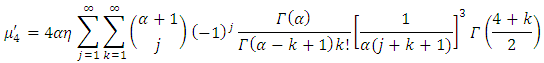
Using eq. (15), we obtain the 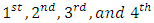 moment for
  .
.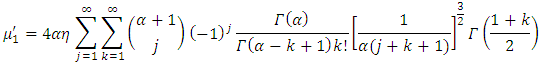 | (16) |
 | (17) |
 | (18) |
 | (19) |
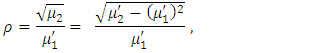
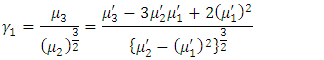
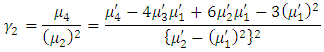
The mean of TLR distribution is the first moment about the origin  which corresponds to equation (16). It then follows that the variance
  , the coefficient of variation
  , the coefficient of skewness
  , and the coefficient of kurtosis
  of the TLR distribution are respectively, obtained as
 | (20) |
 | (21) |
 | (22) |
 | (23) |
6. Moment Generating Function of TLR Distribution
The moment generating function of a random variable x is defined by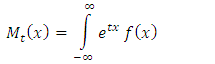 | (24) |
The above expression can further be simplify as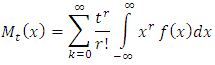 | (25) |
Since,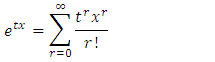 | (26) |
Inserting equation (15) in equation (26) we have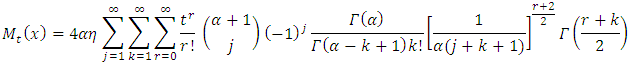 | (27) |
7. Quantile Function, Median and of the TLR Distribution
The quantile function  of the TLR distribution can be obtained as the inverse of Equation (6) as
 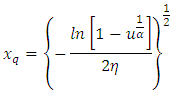 | (28) |
And the median can be obtained as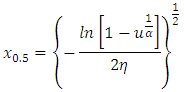 | (29) |
The lower quartile and upper quartile can also be derived from Equation (28) when q = 0.25and q = 0.75 respectively.
8. Maximum Likelihood Estimators
If  is a random sample from Topp-Leone Rayleigh distribution given by (6), then the Likelihood function (L) becomes:
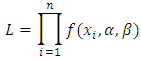 | (30) |
By substituting from equation (6) into Equation (30), we get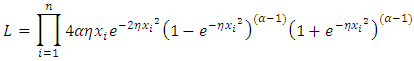 | (31) |
Then the log – likelihood  function becomes
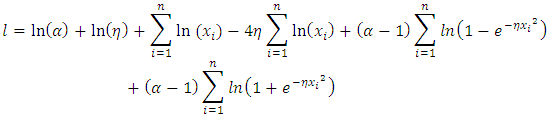 | (32) |
The Normal equation become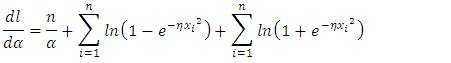 | (33) |
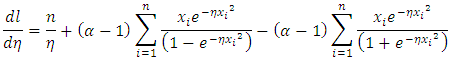 | (34) |
The MLE of  can be obtain by solving the eq. (33) and (34), using
9. Application
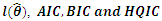
We consider the number of failures for the air conditioning system of jet airplanes. These data were reported by Cordeiro and Lemonte (2011) and Huang and Oluyede (2014): 194, 413, 90, 74, 55, 23, 97, 50, 359, 50, 130, 487, 57, 102, 15, 14, 10, 57, 320, 261, 51, 44, 9, 254, 493, 33, 18,209, 41, 58, 60, 48, 56, 87, 11, 102, 12, 5, 14, 14, 29, 37, 186, 29, 104, 7, 4, 72, 270, 283, 7, 61, 100, 61, 502, 220,120, 141, 22, 603, 35, 98, 54, 100, 11, 181, 65, 49, 12, 239, 14, 18, 39, 3, 12, 5, 32, 9, 438, 43, 134, 184, 20, 386, 182,71, 80, 188, 230, 152, 5, 36, 79, 59, 33, 246, 1, 79, 3, 27, 201, 84, 27, 156, 21, 16, 88, 130, 14, 118, 44, 15, 42, 106, 46,230, 26, 59, 153, 104, 20, 206, 5, 66, 34, 29, 26, 35, 5, 82, 31, 118, 326, 12, 54, 36, 34, 18, 25, 120, 31, 22, 18, 216, 139, 67, 310, 3, 46, 210, 57, 76, 14, 111, 97, 62, 39, 30, 7, 44, 11, 63, 23, 22, 23, 14, 18, 13, 34, 16, 18, 130, 90, 163, 208, 1, 24, 70, 16, 101, 52, 208, 95, 62, 11, 191, 14, 71. The data was observed to possess unimodal failure rate.Table 1 gives the exploratory data analysis of the data, Table 2 provides the maximum likelihood estimate of the unknown parameters (and the corresponding standard errors in parentheses) and the measure of goodness-of-fit tests that was used to verify which distribution fits better to the data set between the Topp-Leone Rayleigh distribution and the Rayleigh distribution. We consider the Akaike Information Criterion (AIC), Bayesian Information Criterion (BIC) and the Hanna Quinn Information Criteria (HQIC) as the selection criteria.Table 1. Descriptive Statistics of the failure data
 |
| |
|
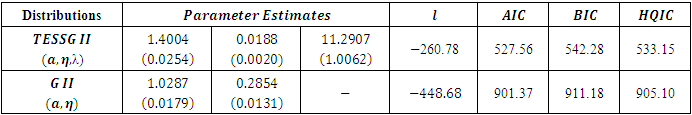
Table 2. MLEs (standard error in parenthesis) and the statistics
 |
| |
|
10. Conclusions
The smaller the values of the statistics which measures the goodness of fits the better the model in fitting the data. Since the Topp-leone Rayleigh distribution possesses the smallest Akaike Information Criterion (AIC), Bayesian Information Criterion (BIC) and the Hanna Quinn Information Criteria (HQIC), it can be considered to be the better model than the Rayleigh in modeling the data.
References
| [1] | Afaq Ahmad et al. “Characterization and Estimation of Transmuted Rayleigh Distribution”. Journal of Statistics Applications & Probability. Vol. 4, No. 2, 315-321 (2015). |
| [2] | Ahmad, S.P. Ahmad and A. Ahmed, “Transmuted Inverse Rayleigh distribution: A Generalization of the Inverse Rayleigh Distribution”, Mathematical Theory and Modeling, vol. 4, pp. 90-98, (2014). |
| [3] | Abd Elfattah, A.M, et al. “Efficiency of Maximum likelihood estimators under different censored sampling Schemes for Rayleigh distribution”, Interstat, (2006). |
| [4] | Lalitha, S and Mishra, A. “Modified maximum likelihood estimation for Rayleigh distribution”, Comm. Stat. Theory Methods, vol.25, pp. 389-401, (1996). |
| [5] | Merovci, F. “Transmuted Rayleigh distribution”. Austrian Journal of Statistics, vol. 42, pp. 21-31, (2013). |
| [6] | Rayleigh, J “On the resultant of a large number of vibrations of the same pitch and of arbitrary phase”, Philos. Mag, vol. 10, pp. 73-78, (1980). |
| [7] | Shaw and, W.T, Buckley, I.R“The alchemy of probability distributions: beyond Gram-Charlier expansions, and a skew-kurtotic-normal distributions from a rank transmutation map”, arXiv preprint, arXiv: 0901.0434, (2009). |
| [8] | Siddiqui, M.M. “Some problems conectede with Rayleigh distributions”, J. Res. Nat. Bur. Stand. 60D, pp. 167-174, (1962). |
| [9] | Sinh aand, S.K, and Howlader, H.A “Credible and HPD intervals of the parameter and reliability of Rayleigh distribution”, IEEE Trans. Reliab, vol. 32, pp. 217-220, (1993). |

 Abstract
 Reference
 Full-Text PDF
 Full-text HTML