-
Paper Information
- Next Paper
- Paper Submission
-
Journal Information
- About This Journal
- Editorial Board
- Current Issue
- Archive
- Author Guidelines
- Contact Us
American Journal of Mathematics and Statistics
p-ISSN: 2162-948X e-ISSN: 2162-8475
2019; 9(6): 203-214
doi:10.5923/j.ajms.20190906.01

Applicability of Time Series Analysis for Forecasting Senior Secondary Student Mathematics Achievement in Nigeria
 Abstract
 Reference
 Full-Text PDF
 Full-text HTML
Nduka Wonu, Reginald Ugochukwu Orlu
Department of Mathematics/Statistics, Faculty of Natural and Applied Sciences, Ignatius Ajuru University of Education, Port Harcourt, Nigeria
Correspondence to: Nduka Wonu, Department of Mathematics/Statistics, Faculty of Natural and Applied Sciences, Ignatius Ajuru University of Education, Port Harcourt, Nigeria.
| Email: |  |
Copyright © 2019 The Author(s). Published by Scientific & Academic Publishing.
This work is licensed under the Creative Commons Attribution International License (CC BY).
http://creativecommons.org/licenses/by/4.0/

This study modelled time-series data on the Mathematics achievement of senior secondary students for a period of twenty-nine (29) years. Trend analysis and Autoregressive Integrated Moving Average (ARIMA) techniques were employed in this study to determine the trend and forecast values that fitted the series (“linear and quadratic” trend). The result of the analysis revealed that the line graph was not stationary because of the change invariance. Unit Root Stationary Test conducted using the Augmented Dicky-Fuller Test (ADF) later confirms the line graph of the achievement of secondary school students in Mathematics, not stationarity because the p-value of 0.124 is greater than 0.05. The time plot of the first difference became stationary. The stationarity condition of the data series are observed by ACF and PACF plots and then checked using the statistic such as ADF. The model for which the values of the criteria are smallest is considered as the best model. ARIMA (2,1,0) is the best fit model based on the Akaike Information Criterion (AIC). Hence the residual analysis for ARIMA (2,1,0) fitted to the achievement of secondary school students in Mathematics data fits quite well.
Keywords: Time Series, Forecasting, Mathematics, Achievement
Cite this paper: Nduka Wonu, Reginald Ugochukwu Orlu, Applicability of Time Series Analysis for Forecasting Senior Secondary Student Mathematics Achievement in Nigeria, American Journal of Mathematics and Statistics, Vol. 9 No. 6, 2019, pp. 203-214. doi: 10.5923/j.ajms.20190906.01.
Article Outline
1. Introduction
- There is no doubt that mathematical principles and concepts have become part of almost every area of work in science and technology. The role of Mathematics as the foundation for nation-building, utility base for daily living, agent for the development of critical and disciplined mindsets in individuals and support-service to other disciplines cannot be over-emphasised (Roohi, 2014, Uwaezuoke & Ideozu, 2014). It is believed that Mathematics sharpens the human mind, develops logical thinking and enhances reasoning ability. Mathematics, without doubt, remains very important to all disciplines and fields of human work and study. Mathematics is indispensable for our daily lives. It occupies a central place in the school curriculum. Hence, for any nation to survive and develop, it has to improve her teaching and learning of Mathematics which is the foundation for technological development. It is due to these reasons that the subject is made compulsory at primary and secondary levels of education and each candidate requires at least a ‘credit pass’ at the ordinary level for admission into tertiary institutions.Irrespective of the importance and benefits of Mathematics in our daily lives, it is observed that among all the subjects in the secondary school subject curriculums, Mathematics appears to be the most disliked subject by the students. Every individual requires the knowledge of Mathematics to function effectively and efficiently in everyday life irrespective of the area of specialization. People are regularly confronted with different demand that needs mathematical competence for a successful decision. Ale (1989) in Simeon and Francis, (2012) opined that Mathematics is the queen of science and technology and also a tool for scientific and technological development.The knowledge of the future performance of students in Mathematics could help the stakeholders in education to plan ahead of time. This study, therefore, used the existing Mathematics achievement percentage scores to forecast future student achievement. Forecasting is a process of predicting the future. The study aims at describing a traditional system that is able to predict student Mathematics achievements for the next three years. This was based on past achievements by using time series analysis, which gives a result with minimal errors and controls the achievement during the years through the application of Mathematical and Statistical models such as Microsoft Excel and Minitab 16 to calculate the trend value of observations and prediction. It also uses trend analysis and ARIMA techniques for possible prediction and forecasting to get good control of the achievement. Research JustificationNotwithstanding, over the past decade, students’ performance in Mathematics has not been impressive (Uloko & Imoko 2007). This sorrowful condition of students’ performance in Mathematics is reflected in the annual national examinations. The reports from the West African Examination Council chief examiners established that candidates’ overall mathematics performance for the May/June 2010 to 2012 and 2015 examinations did not differ significantly from those of previous years (WAEC, 2010, 2011, 2012 & 2015). No matter how the learners are taught, if the foundation is deficient every effort made could sum to a rope of sand (Agashi, 2003). Student underachievement in Mathematics at both junior and senior school levels worsen as they go to higher classes. Many factors have been implicated in this woeful scenario. This includes but not limited to: lack of motivation or interest in learning Mathematics, low self-efficacy, high anxiety, inappropriate earlier teaching and so on (Munro 2003). It is however believed that the when teachers adopt innovative instructional models that can make learning relevant to life, learning achievement of students in Mathematics will improve (Wonu & Arokoyu 2016; Wonu & Charles-Ogan 2017; Wonu & Harrison 2018; Wonu & Paul-Worika 2019).The knowledge of the future performance of students in Mathematics is very important. The Chief examiners also reported that the Mathematics achievement of the candidates for May/June 2013 and 2014 examination seemed to have improved in comparison to previous years (WAEC, 2013 & 2014). In line with the foregoing, it becomes necessary to ask the question; what is likely to be the percentages (%) of students with credit passes and above (A1- C6) in Mathematics in the next three years. Hence, the researchers seek to use time series analysis to forecast student Mathematics achievement in the next three years.Purpose of the StudyThe aim of this study is to use time series analysis to forecast senior secondary student Mathematics achievement in Nigeria for three years ahead. Specifically, the study shall: i) investigate the pattern of student Mathematics achievement in WASSCE.ii) investigate the expected rates of Mathematics achievement in WASSCE.iii) forecast the student Mathematics achievement for the next three (3) years.
2. Materials and Methods
- Data and Statistical Software Package The results of the percentage of candidates who obtained credit passes and above(A1-C6) in the May/June West African Senior Secondary Certificate Examination in General Mathematics between the years 1991 and 2019 were used in the time series modelling. Most of the data from (1991-2016) were retrieved from Zalmon and Wonu (2017) whereas others were obtained from WAEC (2018) and Daily Trust (2019) for the purpose of this study, and consequently to forecast the future student Mathematics achievement. The statistical software packages that were used are Microsoft Excel and Minitab 16. This research work will serve as a decision-making tool to address the problem of accurate forecasting. Thus, an accurate forecast is necessary for future purpose activities. The approach that was adopted in this study was Box, Jenkins, and Reinsel, (1994) modelling techniques of time series data [ARIMA (p, d, q) model] and trend analysis. Model FormationTrend analysis and ARIMA techniques were employed in this study, to determine WASSCE result trend, the series was plotted and then the two trends were fitted on the series, “linear and quadratic” trend to obtain equations, such as
 | (1) |
 | (2) |
 and
and  are the parameter estimates (or estimate values) linear and quadratic trend.Then, the series
  was analysed using ARIMA Model for prediction.Stationarity of the SeriesWe will de-trend stochastic time series using differencing;
 | (3) |
 | (4) |
 | (5) |
 | (6) |
 is the transformed series,
  and
and  2. Multiplicative Seasonal Autoregressive Integrated Moving average ModelBox and Jenkins (1976), in order to account for non-seasonal and seasonal dependencies between observations, presented the multiplicative seasonal autoregressive-integrated-moving average model;
 as
as  | (7) |
 is defined in Equation (4),
  is defined in Equation (4),
  as given in Equation (7),
 and
and  .[See Robert and David, (2011); Gebhard and Jürgen (2007); Bowerman and Connell, (2007); Chatfield, (2004) and Pankratz, (1983)].Akaike Information Criterion (AIC)When more than one model is selected from the process enumerated in Equation (3) or Equation (5), the Akaike’s Information Criterion is then used to select the more suitable model amongst them. The AIC is most commonly given as;
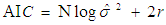 | (8) |
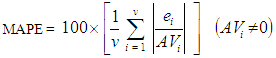
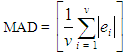
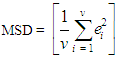
 is the estimated residual variance. [Akaike (1974); Biu and Iwueze (2011)]. Note: since several ARIMA (p, d, q) process models were considered for adequacy, then the least Akaike Information Criterion (AIC) model was selected as a suitable model. Accuracy Measures of the Forecast ValuesA. Estimated ErrorsTo gauge the accuracy of our estimates, the estimated errors were used to compare the expected estimated forecast values and observed values. This is done by subtracting the estimated forecast values (EFV) from the original values or [actual values (AV)] to obtain the estimate errors (Bradley et al. 2014). The estimated error
  is denoted by
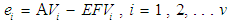 | (9) |
 | (10) |
 | (11) |
 | (12) |
3. Results
- The results of the percentage of candidates who obtained credit passes and above(A1-C6) in the May/June West African Senior Secondary Certificate Examination in General Mathematics between the years 1991 and 2019 were used in the time series modelling. The data contains 29 observations. Figure 1-4 shows the series appreciates and depreciates in linear or quadratic. Also examining Figure 1-4, we notice that the series appreciate from 1999 to 2019, which seems to indicate a trend component which is polynomials of suitable order (linear or quadratic).
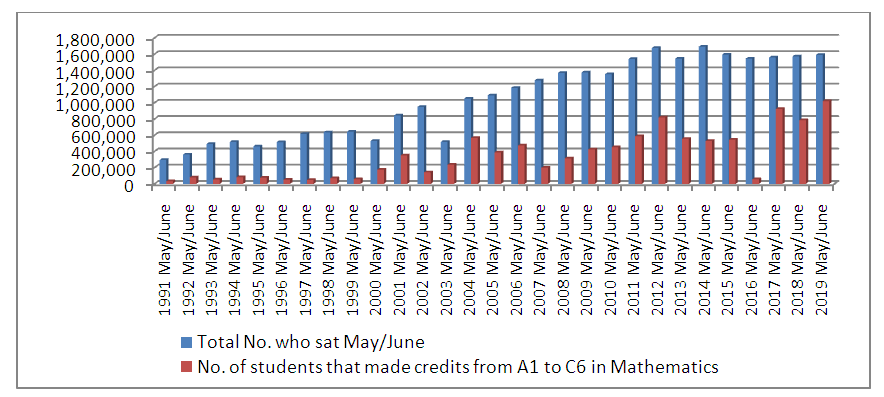 | Figure 1. Bar chart of the number of students that made A1-C6 in Mathematics with the number of students that enrolled for WASSCE 1991 to 2019 |
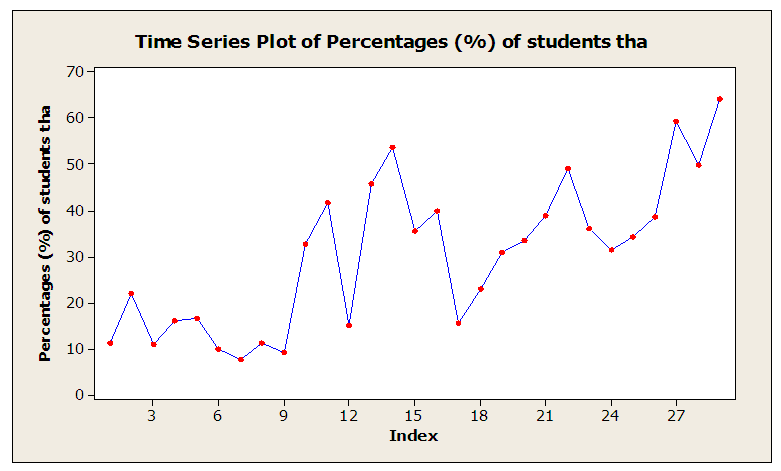
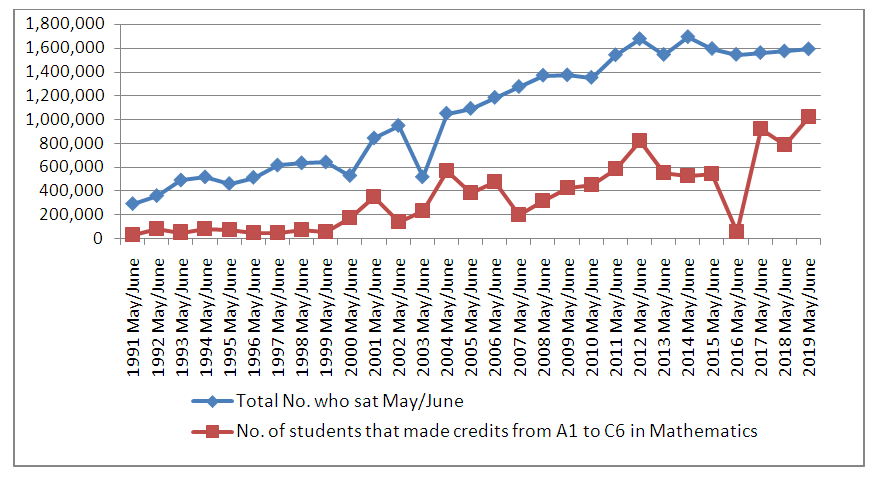 | Figure 2. Series Plot of number of students that made A1-C6 in Mathematics with the number of students that enrolled for WASSCE 1991 to 2019 |
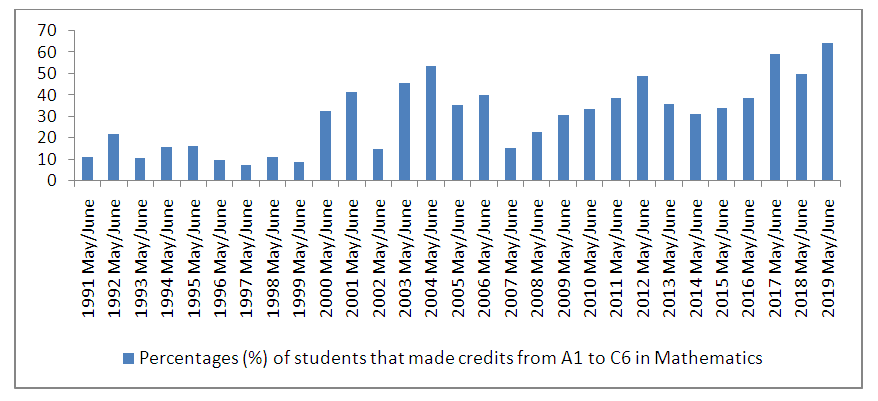 | Figure 3. Bar chart of the percentage of students that made credit passes from A1-C6 in Mathematics |
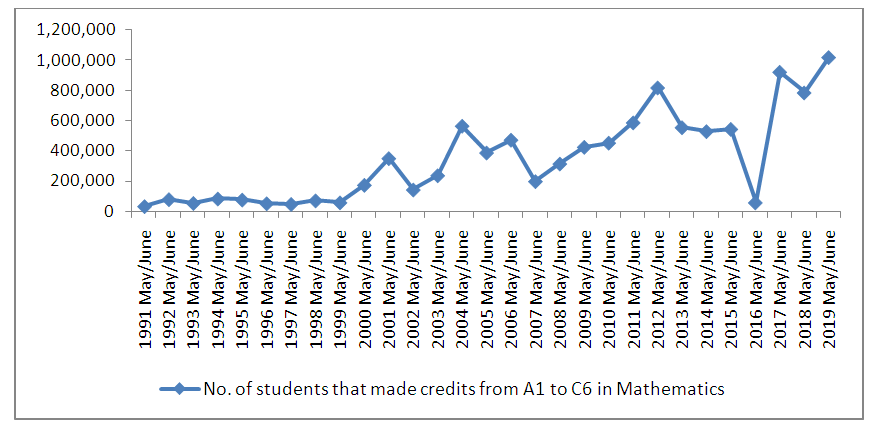 | Figure 4. Series Plot of the number of students the made credit passes, A1-C6 in Mathematics |
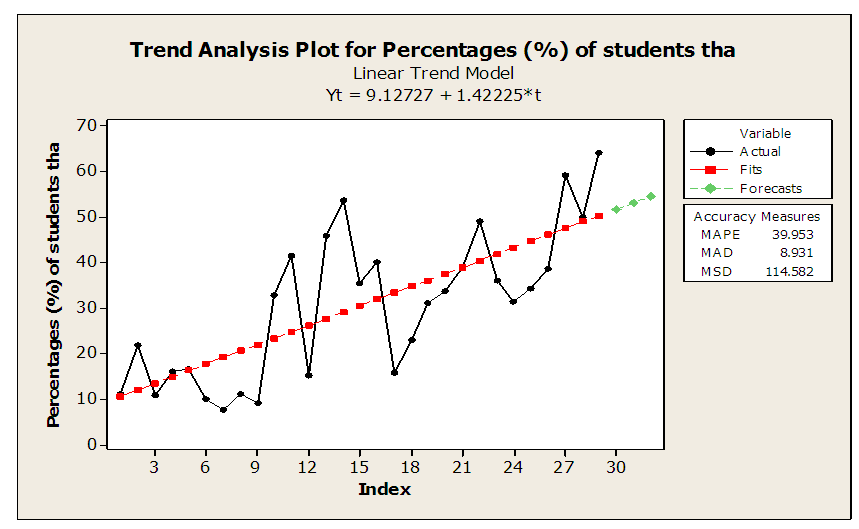
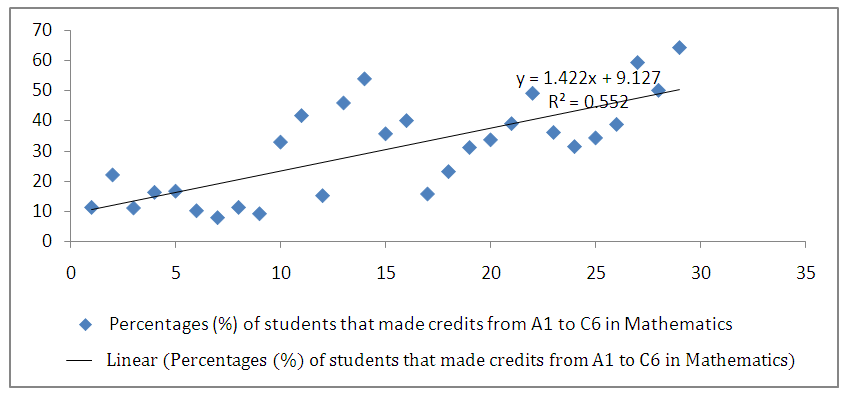 | Figure 5. Linear Trend Series Plot of WASSCE Mathematics Results |
|
 | (13) |
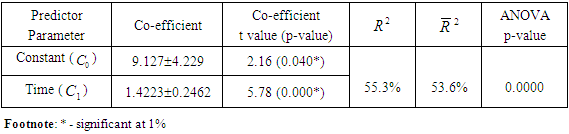
 is the linear Series Plot of WASSCE Mathematics Results. Table (13) also shows the
  and
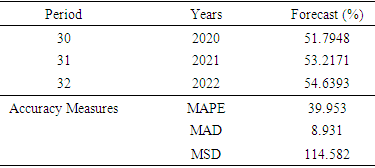
and  with 55.3% and 53.6% variation respectively. Forecasting of Model A:
|
 | Figure 6. Linear Trend Forecasts from 2020 to 2024 of WASSCE Mathematics Results |
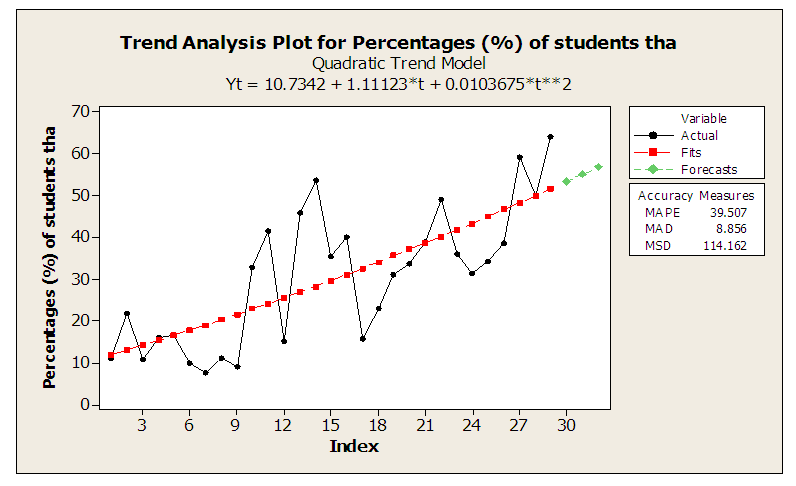
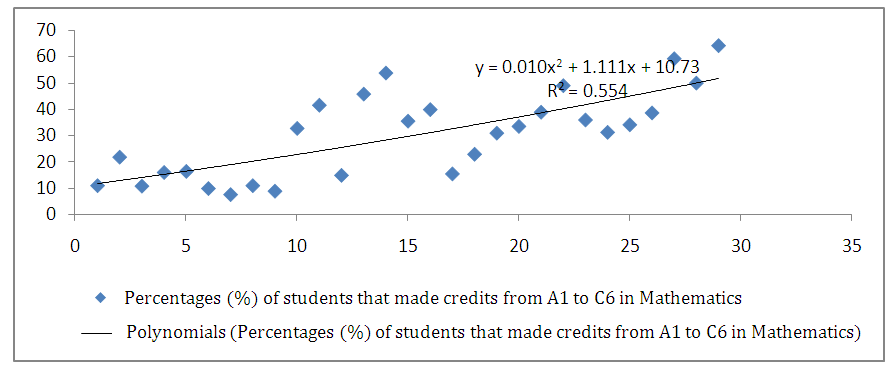 | Figure 7. Quadratic Trend Series Plot of WASSCE Mathematics Results |
|
 | (14) |
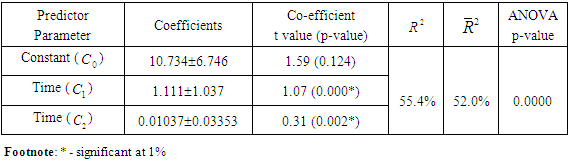
 is the quadratic Series Plot of WASSCE Mathematics Results. Table (3) also shows the
  and
and  with 55.4% and 52.0% variation respectively. Forecasting of Model B:
|
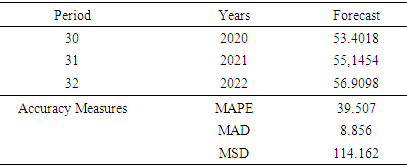
 | Figure 8. Linear Trend Forecasts from 2020 to 2022 of WASSCE Mathematics Results |
 | Figure 9. First Difference of WASSCE Mathematics Results |
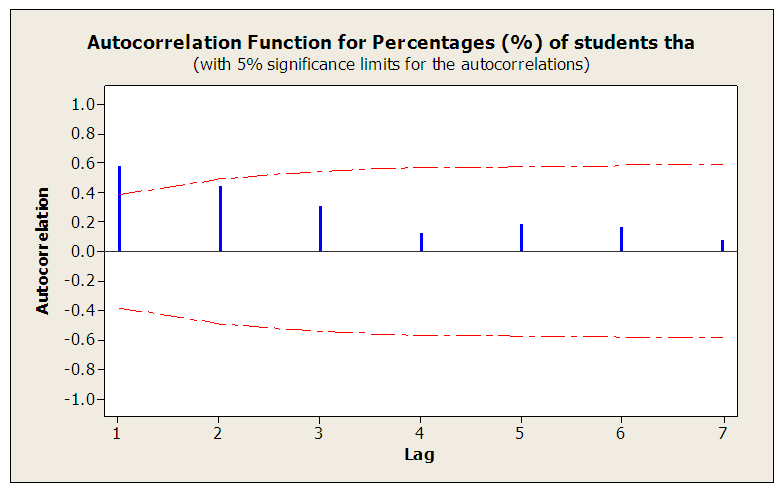 | Figure 10. ACF Correlogram of ‘Yt’ |
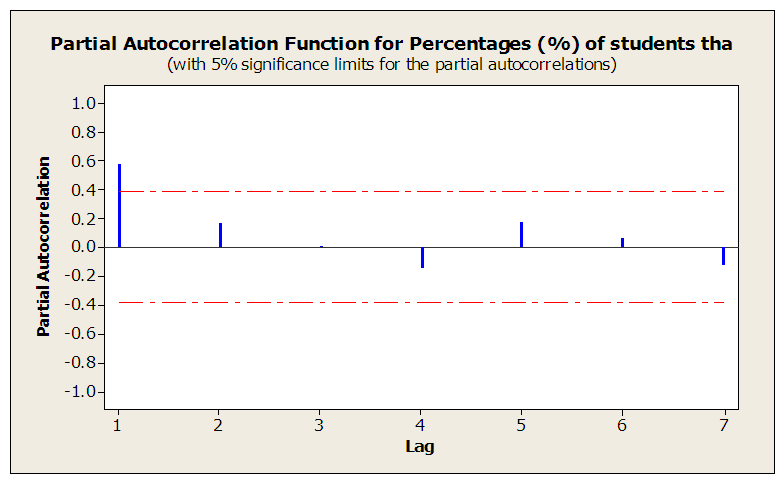 | Figure 11. PACF Correlogram of ‘Yt’ |
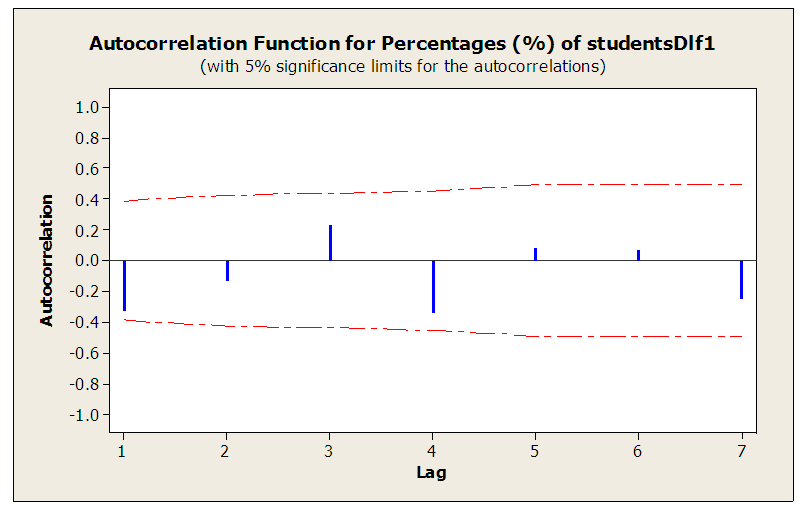 | Figure 12. ACF Correlogram of  |
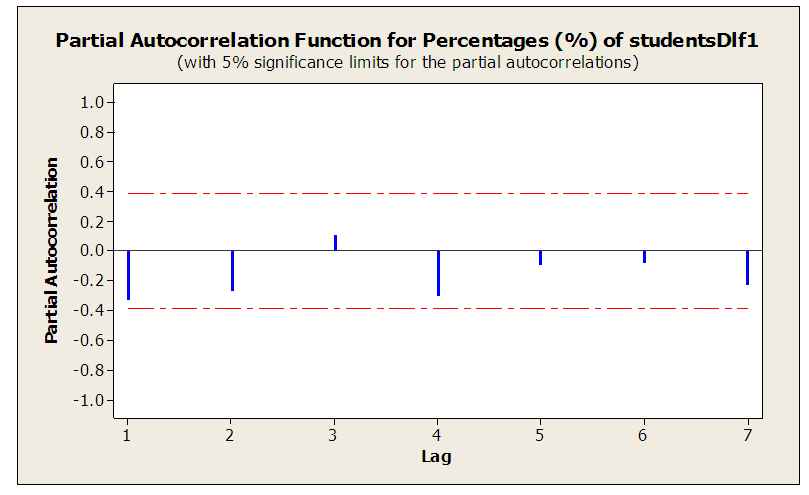 | Figure 13. PACF Correlogram of  |
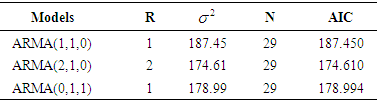
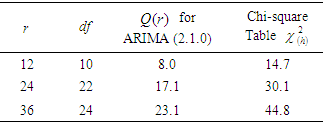
 may also be appropriate without stationarity.Therefore, several ARIMA (p, d, q) models were fitted to the series (1) with respective residuals as white noise and it’s summarized in Table 5. The model selection criteria used to select the best model amongst models is Akaike’s Information Criterion (AIC), equation 5. It is also detailed in Table 5.
|

 | (15) |
|
 | (16) |
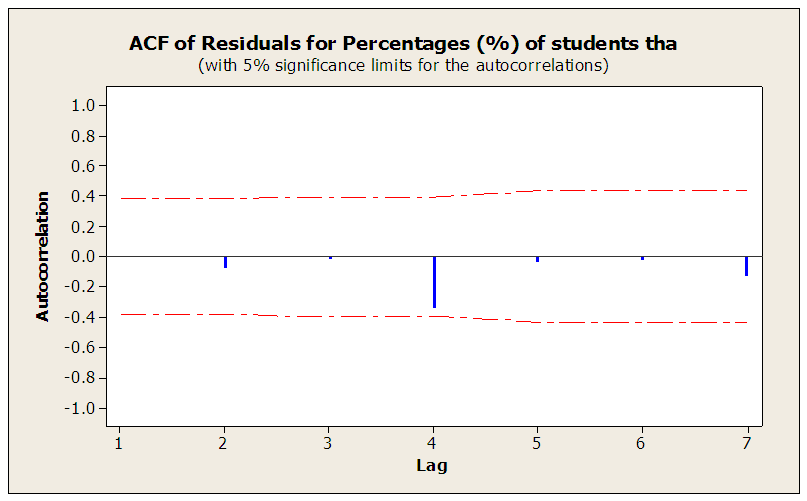 | Figure 14. Residual ACF correlogram of ARIMA(2,1,0) |
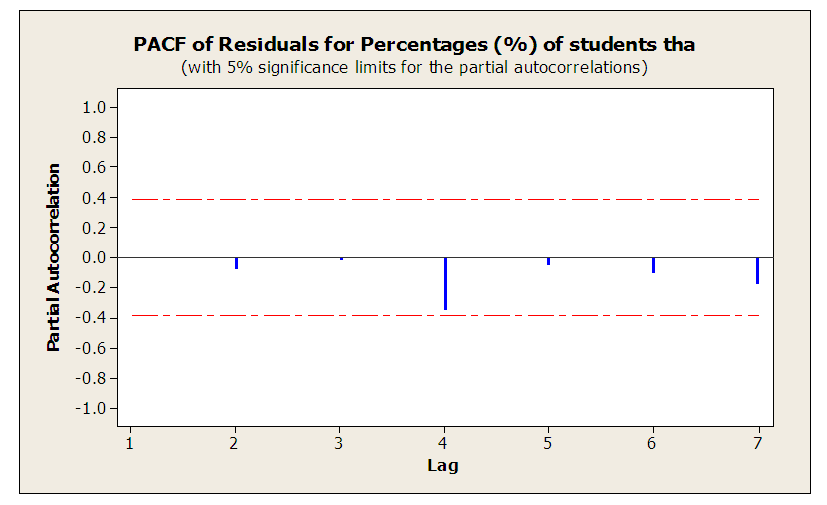 | Figure 15. Residual PACF correlogram of ARIMA(2,1,0) |
|
 with
with  , since
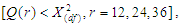 it is obvious that the models are adequate and they can be used for forecasting.Forecasting: We evaluate forecasts with the identified model ARIMA (2,1,0) from the starting origin point 29 for 3 years. We have observed 29 data points, so we say that we are at time origin
  . Then, the
  ahead forecasts denoted by
  for (t = 1, 2, 3 or
  ) with the 95% confidence intervals of the forecasts are shown in Table 8 [i.e. 2020 to 2022].
|
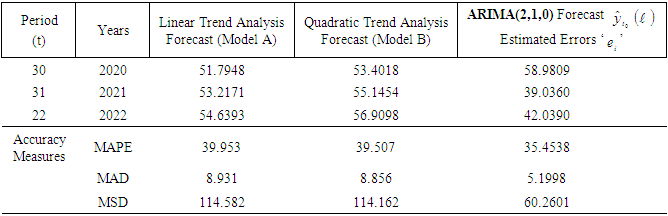
 | Figure 16. Comparison of Forecast Values (%) Plot using Trend Analysis and ARIMA Techniques from 2020 to 2022 |
4. Discussion of Findings
- The study is primarily aimed at finding the model that best fits the forecasting of student Mathematics achievement in Nigeria based on the previous data of the percentage of WAEC results of students who made credit passes from A1 to C6 in Mathematics from 1991 to 2019 in the state. To get the best fit model, there are two functions that are very useful in order to identify a time series model, the Autocorrelation Function (ACF) and the Partial Autocorrelation Function (PACF). Both functions were deplored because the linear time series model can be identified by its ACF and PACF. The method adopted for data analysis was trend analysis and ARIMA technique, to determine WASSCE results trend, the series was plotted and then the two trends were fitted on the series “linear and quadratic” trends to obtain the linear equation. The series was analysed using ARIMA Model for prediction. The raw data which showed significant presence of a trend, an indication of non-stationarity was differenced once using ARIMA {(p,d,q). (2,1,0)} for stationarity. Having critically analysed the sourced data and found out that the graph of the Unit Root Test shows model adequacy.
5. Conclusions
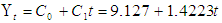
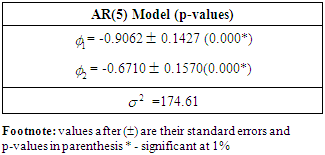
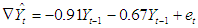
- The ARIMA (2,1,0) model for the achievement of secondary school students in Mathematics has the smallest (AIC) 174.610, therefore, this model is selected to be the best fit of all models fitted because the other models have greater AIC value. When the parameters of the best model ARIMA (2,1,0) was estimated, we have the following as results: 9.127 and 1.4223. The fitted model equation, in this case, reads:
 | (13) |
6. Recommendations
- The research work focused on the applicability of time series analysis to forecast secondary school student Mathematics achievement. Based on the findings of the study the following recommendations were made: 1. That ARIMA (2,1,0) is the best fit model for the period under review being from 1991 to 2019.2. That analyst is very free to use the model for a forecast to improve on the secondary school student Mathematics achievement.3. That this model can be used after forecasting to control secondary school student Mathematics achievement.
7. Limitations of the Study
- This research work is limited to secondary school student Mathematics achievement in Nigeria as a result of the availability of past WAEC results from 1991 to 2019.
8. Suggestions for Further Studies
- This study proffers the following suggestions for further studies:1. The study should be replicated in other subjects such as Physics, Chemistry and Biology.2. That the study should be expanded to other areas that will better our society.