Bosson-Amedenu Senyefia, Francis Hull Adams, Kojo Amuah Prah
Holy Child College of Education, Takoradi, Western Region, Ghana
Correspondence to: Bosson-Amedenu Senyefia, Holy Child College of Education, Takoradi, Western Region, Ghana.
| Email: |  |
Copyright © 2019 The Author(s). Published by Scientific & Academic Publishing.
This work is licensed under the Creative Commons Attribution International License (CC BY).
http://creativecommons.org/licenses/by/4.0/

Abstract
The study applies multinomial regression and survival analysis to a district level health insurance data in Ghana. The study had six response variables and two independent variables which were nominal. At the end of the five year cohort study, the survival plot qualified pregnant women, informal category, and children below age 5 respectively to have performed better with renewal of National Health Insurance Scheme (NHIS) membership. However, people aged 70 and above, were found to be the worst performing in renewal of membership. Log Rank, Breslow, and Tarone-Ware test statistics consistently showed a statistically significant difference among the six categories. Pregnant women were found to be five (5.400) times significantly more likely to renew their NHIS compared to the reference category. The informal category was found to be seven (7.400) times significantly more likely to renew their NHIS than the reference category. Children aged four and below were found to be two times (2.067) significantly more likely to renew their NHIS than the reference category. Children aged 4 and below who are male are less likely (B = -.101 < 0) to renew their NHIS cards compared to the reference group of females. Again, males and females of informal category are equally likely (B = 0) to renew their NHIS cards. For the informal category, males and females are equally likely (B = 0) to renew their NHIS cards. Male SSNIT contributors compared to females are more likely to renew their NHIS cards. The study recommended for the NHIS authorities to find more proactive ways to make renewal of membership easier.
Keywords:
Survival Analysis, Multinomial Regression, NHIS, Ghana, Categorical Analysis
Cite this paper: Bosson-Amedenu Senyefia, Francis Hull Adams, Kojo Amuah Prah, Survival and Multinomial Logistic Regression Analyses of Sekondi-Takoradi District Level National Health Insurance Data in Ghana, American Journal of Mathematics and Statistics, Vol. 9 No. 2, 2019, pp. 109-114. doi: 10.5923/j.ajms.20190902.06.
1. Introduction
Ghana, in her quest to provide free health care for her citizens by tax funded health care system, instituted the National Health insurance scheme (NHIS) in December, 2004. Government of Ghana appeared to be making progress with the ultimate goal of universal coverage with respect to the scheme. By the year 2005, the scheme had coverage strength of 27% and 67.5% in 2009 (Durieraj, et.al, 2010). However according to the NHIS 2014 annual report, it was estimated to have an active membership of 40% of the country’s population of 26.4 million at the time. The main source of funding for NHIS is primarily by NHIS levy (makes up 74% of total funding to the scheme), another 20% from contribution from Social Security and National Insurance Trust (SSNIT) and yet another 3% generated from the payment of premiums. The remaining 3% funding is obtained via interest accrued on investments. The NHIS registrations of members are done in 8 categories. These categories include pregnant women, children under 5, informal, SSNIT contributors, dependent, indigent, people aged 70 and above and the “other” category. The 2014 NHIS reports did a number of recommendations among which there was a need to monitor the scheme fervently by research in order to improve practice (NHIS report, 2014). By the year 2016 (i.e. 2 years after the 40% coverage record), the NHIS had a coverage of 41% which leaves a big question mark on why the insignificant (1%) improvement (Kennedy etal. 2016). To this end, this current study sought to study the various categories of membership to determine the renewal pattern of the various categories over a period of five years through survival and multinomial regression analyses subject to data availability.
2. Review of Related Literature
Multinomial logistic regression has been extensively applied in diverse areas of literature, particularly in areas of health, education, and social domains. Multinomial Logistic Regression is a very critical method applied in categorical studies. It is applied to nominal or ordinal data with the response variable having at least three categories. A study was conducted to study physical violence involving children from a survey of youth. The independent variables were eighteen in number with the dependent variable involving four categories. The study identified “sex” of a child as the most significant factor followed by “spread of physical violence among the younger folks”. Others included “drug abuse patronage“, “alcohol drinking by youth”, “and extent of begging” and “household population” as significant factors (El-Habil, 2012).Multinomial Logistic Regression has been applied to find out the significant factors that support students’ academic performance in mathematics. The paper used a random sample of 393 students from a cohort of first year students. The questionnaire instrument was used to collect relevant data. The findings of the research included that excellent academic output depended mainly on the students’ sex orientation in favor of male students. Age was yet another significant determinant of good academic output with younger students performing better than older ones. Employment status of the mother of a student was also a significant predictor of the respective students’ academic output with employed mothers having their wards performing better compared to wards of mothers who are unemployed (Asampana et.al, 2017).Survival analysis is a cohort study where subjects or participants are followed-up till an event of interest occurs. It has several application areas including medicine, engineering and insurance. A study was conducted to study the fixation times in reading using the Kaplan Meier estimate. The study concluded that structural uncertainty increase is inversely proportional to the risk of movement of the eyes (Nilsson et.al, 2011). Another study applied survival function to data on infant mortality collected from University of Nigeria Teaching Hospital spanning a period of ten years. The survival plot was found to confirm high mortality among infants population (Iguenagu et.al, 2014). Yet another study by Kovacheva (2017) sought to determine infant mortality by comparing life tables of Bulgaria and USA.As part of the findings of this study, the retirement age of Bulgarians which was 63 years was estimated to be reached by 74837 males and would live additional 15.6 years whereas females reaching 61 years will be 90061 in number and will live additional 20.6 years. On the other hand, USA with retirement age of 65 will have 80 724 males reaching it and will live additional 17.9 years. However, 88070 males were estimated to live additional 20.5.
3. Methodology
The study was partly a retrospective cohort study which examined six categories (a sample of 40 participants each from each category from the years 2013-2018) of Health insurance data to study their survival time over a period of five years. The categories used included children below age of 5, pregnant women, SSNIT contributors and Indigent. Others are People aged 70 and above, and informal categories. The Kaplan Meier method was used and the survival plot was studied to make necessary inference. Log Rank, Breslow, and Tarone-Ware test statistics were used to compare the consistency of statistically significant difference among the six categories. The data was collected from the Sekondi-Takoradi District Health insurance Scheme Centre, located in the western region of Ghana through convenience sampling technique. Multinomial study was carried out for the categorical set of data with nominal measurement levels. The response variables were the six NHIS categories mentioned above. The independent variables were the Outcome (renewal /no renewal) with two levels. The other independent variable considered was the gender (Male/ female). The IBM SPSS (version 25) was used for the analysis. The Kaplan Meier estimate of survival function is given by: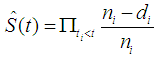 Where
Where  represent the number of population at time, t.
  represent the number dying at time, t.
4. Data Analysis and Results
The multinomial logit model is an extension (response variable has more than two possible outcomes) to the binomial logit (dichotomous) model. The response variables were nominal (no natural ordering no order in the outcome). The dependent variable was made up of six levels, including children aged 4 and below, pregnant women, indigent, informal, SSNIT contributor and people aged above 70. The independent variable had two levels (i.e renewal or no renewal). The reference category was people aged 70 and above. The treatments choices were compared to people aged 70 and above. The table shows only five out of six treatments because if there are k dummies, then the observable will be (k-1) dummy variables. In this analysis, the renewal tendencies (of their NHIS cards) of all the observable treatments groups were compared with the renewal tendency of people aged 70 and above. The independent variable was coded  and
and  . Due to the dummy rule again, the independent variable
  , was set as a reference variable, accounting for the reason why the
  row in the table is left empty.
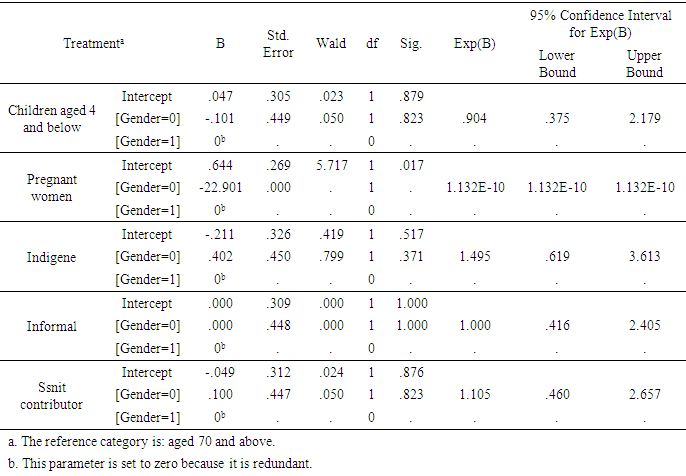
Table 1. Multinomial Logistic Regression Parameter Estimates (Tendency to renew NHIS cards)
 |
| |
|
Since the regression coefficient  is greater than zero implies that children aged 4 and below are more likely to have their NHIS cards renewed than people aged 70 and above. Again, pregnant women are more likely to have their NHIS cards renewed than people aged 70 and above. Again, Indigent are less likely
 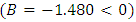 to have their NHIS cards renewed than people aged 70 and above. The informal group is more likely
 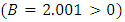 to renew their NHIS cards than the reference group. Also, SSNIT contributors are more likely to renew their NHIS cards relative to reference group. The odds ratio of the pregnant women category is
 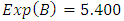 , meaning that as pregnant women category increases by one unit, the probability of renewing the NHIS card increases by 5.4 percent. This suggests that pregnant women are five
  times significantly more likely to renew their NHIS compared to the reference category. The Odds ratio column further suggests that the informal category is seven
  times significantly more likely to renew their NHIS than the reference category. Again, Children aged four and below are two times
  significantly more likely to renew their NHIS than the reference category.Test of Relationship between Dependent and Independent Variables
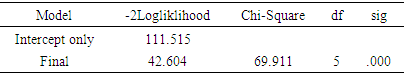
Table 2. Model Fitting Information for Outcome (Renewal or No Renewal)
 |
| |
|
The statistical significance of the chi-square model Multinomial Logistic regression analysis is an indication of the presence relationship between response variable and covariates. The table reveals the p-value is below  . The null hypothesis which states that there is no statistical difference between the model with covariates and the model without covariates is rejected. To this end, the alternative hypothesis that there exists a relationship between response and explanatory variables (renewal or no renewal) is accepted.
Table 3. Pseudo R- square
 |
| |
|
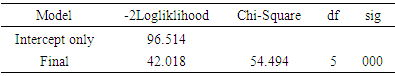
The Cox and Snell’s R squared and Nagelkerk R squared values suggests that the model explains roughly 20% and 21% of the variation in the outcome respectively.Similarly, according to the table, Children aged 4 and below who are male are less likely  to renew their NHIS cards compared to the reference group of females. Since pregnant women are only females, it is understandable why the Wald estimate and significant value were not assigned. Male indigenes are less likely
 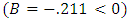 to renew their NHIS cards than females. Again, for the informal category, males and females are equally likely
  to renew their NHIS cards. Finally, for the category of SSNIT contributors, males compared to females are more likely to renew their NHIS cards.The odds ratio of male children aged 4 and below is
  , meaning that as the male children aged 4 and below increases by one unit, the probability of renewing the NHIS card increases by .904 percent.
Table 4. Parameter Estimates (Females compared to males)
 |
| |
|
Test of Relationship between Dependent and Independent VariablesTable 5. Model Fitting Information
 |
| |
|
The statistical significance of the chi-square model Multinomial Logistic regression analysis is an indication of the presence relationship between response variable and covariates. The table reveals the p-value is below  . The null hypothesis which states that there is no statistical difference between the model with covariates and the model without covariates is rejected. To this end, the alternative hypothesis that there exists a relationship between response and explanatory variables is accepted.
Table 6. Pseudo R- square
 |
| |
|
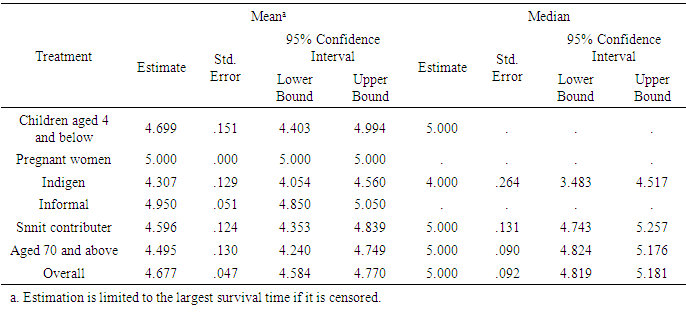
The Cox and Snell’s R squared and Nagelkerk R squared values suggests that the model explains roughly 25% and 26% of the variation in the outcome respectively.Table 7. Means and Medians for Survival Time
 |
| |
|
Pregnant women recorded the greatest mean of 5.00 followed by informal registrants with mean of 4.950. All the estimated means for the various categories were close and it is important to find out if the difference between the means of the various categories is significant.Table 8. Overall Comparisons
 |
| |
|
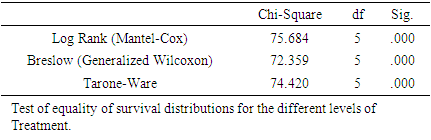
The Log Rank (Mantel-Cox) method tests the equality of survival functions with all the points in time weighted equally. Breslow (Generalized Wilcoxon) test the equality survival functions by weighing the time points based on the number of cases at risk in each time point. Tarone-Ware tests the equality survival functions by weighting the points of time by the square root of the number of cases. All the three statistics were used to check the consistency of the results. By all three statistics used, there was a statistically significant difference between the all the categories (treatments).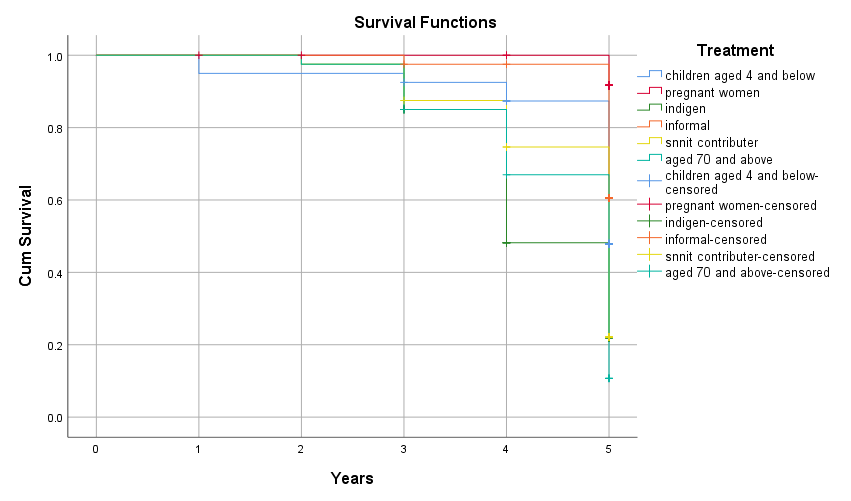 | Figure 1 |
The survival plot seeks to examine how long it takes for the event (failure to renew membership card) to occur. At the start of the study at time 0 years, 100% of the cohorts have not experienced the event. There are seven (7) treatment groups and each uniquely colored line represents a specific group. Cohorts for each category were followed for five years to measure their survival time. The drop in the graph represents a proportion of the cohorts experiencing the event of interest (inability to renew NHIS cards or membership). With the exception of children aged 4 and below, although some pregnant women were lost to follow-up in the first year, none of the categories experienced the event of interest in the first year of the study. At the end of the second year, indigent experienced the event of failure with some censored pregnant women. From the third year onwards, all categories experienced the event of interest at various stages. All censored points (indicated by a colored plus sign) before the fifth year were considered to have dropped out for some reason (without experiencing the event of interest). However, the colored plus sign at the fifth year shows those participants surviving (have not experienced the event of interest) at the end of the fifth year. At the end of the five year cohort study, the survival plot qualified pregnant women, informal category, and children aged 4 and below respectively to have performed better with renewal of NHIS membership. However, people aged 70 and above, were found to be the worst performing in renewal of membership.
5. Conclusions
The study applies multinomial regression and survival analysis to a district level health insurance data in Ghana. The study had six response variables and two independent variables which were nominal. At the end of the five year cohort study, the survival plot qualified pregnant women, informal category, and children aged 4 and below respectively to have performed better with renewal of National Health Insurance Scheme (NHIS) membership. However, people aged 70 and above, were found to be the worst performing in renewal of membership. Log Rank, Breslow, and Tarone-Ware test statistics consistently showed a statistically significant difference among the six categories. Pregnant women were found to be five  times significantly more likely to renew their NHIS compared to the reference category. The informal category was found to be seven
  times significantly more likely to renew their NHIS than the reference category. Children aged four and below were found to be two times
  significantly more likely to renew their NHIS than the reference category. Children aged 4 and below who are male are less likely
  to renew their NHIS cards compared to the reference group of females. Again, males and females of informal category are equally likely
  to renew their NHIS cards. For the informal category, males and females are equally likely
  to renew their NHIS cards. Male SSNIT contributors compared to females are more likely to renew their NHIS cards. Future research can consider increasing the sample size, the span of data points as well as the participant follow-up time in order to obtain sharper results. The Kaplan Meier method does not account properly for censored data in the event of competing risk. To this end, future studies can consider using competing risk analysis of cohort study in order to properly account for censored participants in order to result in more reliable results.
6. Recommendations
1. NHIS authorities to find more proactive ways to make renewal of membership easier such as resorting to mobile money mode of payment of premiums.2. The NHIS authorities could also serve members with reminders of dates of service expiry a month or two in advance.3. The NHIS authorities could also have service points at various health centers to facilitate renewal.
References
| [1] | Asampana G., Nantomah K.K., Tungosiamu E.K (2017). Multinomial Logistic Regression Analysis of the Determinants of Students’ Academic Performance in Mathematics at Basic Education Certificate Examination. Higher Education Research. Vol. 2, No. 1, 2017, pp. 22-26. doi: 10.11648/j.her.20170201.15. |
| [2] | El-Habil A.M. (2012). An application on Multinomial Regression Model. Pakistan Journal of Statistics and Operation Research. Vol. VIII. No. 2, 2012, pp271-291. |
| [3] | Nilsson M, Joakim N., (2011). Proceedings of the 2nd Workshop on Cognitive Modeling and Computational Linguistics, pages 107–115, Portland, Oregon, June 2011. c 2011 Association for Computational Linguistics. |
| [4] | Kennedy A. A. and John A. W. (2014), Development Policy Planning in Ghana: The Case of Healthcare Provision, European Scientific Journal, Vol. 10, no. 33. ISSN 1857-7881 (print), e-ISSN 1857-7431. |
| [5] | Igwenagu C.M. (2014). The Application of Life Table Functions: A Demographic Study. e-ISSN: 2278-5728, p-ISSN:2319-765X Volume 10, Issue 1 Ver. IV. (Feb. 2014), PP 80-82 www.iosrjournals.org. |
| [6] | Kovacheva T.P (2017). International Mathematical Forum, Vol. 12, 2017, no. 10, 469 - 479 HIKARI Ltd, www.m-hikari.com https://doi.org/10.12988/imf.2017.7225. |
| [7] | Durairaj V., D’Almeida S., Kirigia J., (2010). Obstacles in the process of establishing a sustainable National Health Insurance Scheme: Insights from Ghana. Denis Meissner WHO/GRA/DUP publisher. |

 Abstract
 Reference
 Full-Text PDF
 Full-text HTML