-
Paper Information
- Previous Paper
- Paper Submission
-
Journal Information
- About This Journal
- Editorial Board
- Current Issue
- Archive
- Author Guidelines
- Contact Us
American Journal of Mathematics and Statistics
p-ISSN: 2162-948X e-ISSN: 2162-8475
2019; 9(1): 23-29
doi:10.5923/j.ajms.20190901.04

Multiple Comparison of Demand and Sale Rate of Brands of Drinks in Cross River State Using Non-Parametric Test Statistics
 Abstract
 Reference
 Full-Text PDF
 Full-text HTML
Agu Friday I.1, Francis Runyi E.2, Nwokike Chukwudike C.3, Offorha Bright C.3
1Department of Statistics, University of Calabar, Calabar, Nigeria
2Department of Mathematics & Computer Science, Arthur Jarvis University, Akpabuyo, Nigeria
3Department of Statistics, Abia State University, Uturu, Nigeria
Correspondence to: Francis Runyi E., Department of Mathematics & Computer Science, Arthur Jarvis University, Akpabuyo, Nigeria.
| Email: |  |
Copyright © 2019 The Author(s). Published by Scientific & Academic Publishing.
This work is licensed under the Creative Commons Attribution International License (CC BY).
http://creativecommons.org/licenses/by/4.0/

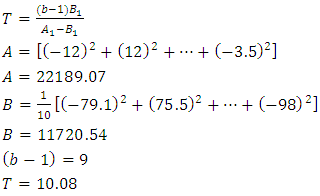
This research compared the demand and sale rate of ten brands of drink from store to store in Okuku community, Yala Local Government Area, Cross River State, Nigeria. The Quade test and the Friedman-Fr test are the methods used for comparison. The Quade test revealed that the test statistic T = 10.08 and the critical value  = 1.99 and 2.64 at 1% and 5% level of significance respectively which lead to the rejection of the null hypothesis since T >
  . The Friedman-Fr test analysis revealed that the test statistic
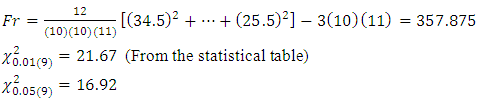
  = 357.875 and the value of
  and 16.92 at 1% and 5% level of significance respectively with 9 degrees of freedom in which the null hypothesis is rejected since
  . The result of the two analysis agrees that the null hypothesis be rejected and thus conclude that the demand and sale rate for at least two brands of drinks differ from store to store in Okuku community.
Keywords: Quade test, Friedman test
Cite this paper: Agu Friday I., Francis Runyi E., Nwokike Chukwudike C., Offorha Bright C., Multiple Comparison of Demand and Sale Rate of Brands of Drinks in Cross River State Using Non-Parametric Test Statistics, American Journal of Mathematics and Statistics, Vol. 9 No. 1, 2019, pp. 23-29. doi: 10.5923/j.ajms.20190901.04.
Article Outline
1. Introduction
- Generally, different brands of drink are classified as alcoholic and non-alcoholic drink consumed by the inhabitant of Okuku community. These drinks are demanded for at different sales points or stores according to the consumer choices. The probability that the demand rate for each brand of drinks of the same category will be the same is very unlikely since at some sales points the demand rate for some drinks might be low that the operator of the store cannot make ends-meet if analysis of sales data is not done.Multiple comparison analysis is used to compare statistical measure (mean, proportion, etc) of the properties of the effect of pairs of levels of factors (varieties, treatment, location, etc). In order to assess the rate of variation in the demand rate of each brand of drinks, a hypothesis will be formulated and the model will be analyzed by analysis of variance (ANOVA) to test the null hypothesis that the mean demand rate for each brand of drinks from store to store in Okuku community is equal against the alternative hypothesis.To enhance the analysis, a test statistic of ANOVA with the associated Quade test and the Friedman-Fr test which provide another method for testing to detect difference in the demand rate for each brand of drinks will be adopted where data is collected from randomized block design.From the data analytic viewpoint, in comparing the demand rate for the different brand of drinks, we rank the observation within each store (Block) and then compute the rank sums for each of the brand of drinks (Treatment). Tied observation within blocks is handled in the usual manner by assigning the average value of the ranks to each of the tied observations. With the null hypothesis, the probability distributions for the K treatment are identical against the alternative hypothesis. This enables us to know which brand of drinks has a demand sale that differ significantly from others, of which precisely is the reason of using multiple comparison.
2. Geographical Description and Location of Okuku Area
- Okuku is a community located in Yala Local Government Area in Northern Senatorial district of Cross River State, Nigeria with its geographical coordinates 6° 43' 0" North, 8° 47' 0" East. Okuku community shares border with Ugaga community in the North, Abachor community in the North East, Echumoga community in the East, Imaje community in the South and Igoli-Ogoja Local Government in the West in Cross River State. The above shows that Okuku community shares border with four communities in her Local Government and one community across her own Local Government. Okuku community is a commercial heartland of the Yala Local Government Area with its weekly market (Ida) which comes every five days in a week called Akpakpa market day. The Ida attract buyers and sellers of majorly farm produce and all kinds of goods from the Eastern, Western part of Nigeria and few from the Southern part through a road which passes through Ugaga community and several other communities in the Local Government called the Okpoma road and Abakaliki road. Traders from Calabar the State Capital and Akwa Ibom access Okuku community through the Okuku-Igoli road in the Western border. Traders from Benue access Okuku community from either Echumoga road or Imaje-Gboko road. The dominant language in the Okuku area is the Yala language and the commercial language is the Pidgin English, the inhabitant of the area are not different in the rich culture of the Yala Local Government Area.
3. Research Problem
- Good experimental design was adopted during the comparison of different brands of drink from store to store in Okuku community. Yet, the problems were attributed to inadequacy of data collection, lack of money and inability to compute the ranks of the demand rates from each brands of drinks per month.
4. Objectives of the Research
- The following are the Objectives of the research.To compare the demand rate of different brands of drink of the same category from store to store in Okuku community and check if there exist any difference in their demand rate from store to storeŸ To use the Friedman-Fr test which gives accurate and sufficient evidence that there is differences in the demand rate of different brands of drinks of the same category from store to store.
5. Significance of the Research
- This research will help store operators to know how to meet up with high demand (sale) rate in order to make ends-meet.
6. Scope of the Research
- The research compare the variation in the demand rate of each brand of drinks of the same category from store to store only in Okuku community in Cross River State. The analysis of variance (ANOVA) as a method of multiple comparison depending on its experimental design is adopted for this research and also the Friedman-Fr test is adopted to verify the study involved collection and analysis of data, calculation of sample statistics based on the experimental design used (Randomized Block design).The t-statistics is adopted only to verify the preconceived null hypothesis that the mean demand rates are equal against the alternative hypothesis that the mean demand rates are not equal.
7. Methodology
- The method adopted in this research is the randomized block design which involves comparing more than two population means whereby independent random samples are drawn from each of the populations of interest.The associate analysis of variance (ANOVA) is also adopted which allows the sampling variation of quantity from store to store and the testing variation to be separated and their magnitude estimated.
8. Literature Review
- The demand and rises in prices of different brand of drinks thus discourage the consumption. How much consumption reduce actually depend on the amount charged for the drink and the degree of consumers respond by reducing their consumption rate. Agnieszka and Douglas (2001) estimate the demand for alcohol from pooled data across states in the US. They tested a hypothesis and it confirmed the presence of measurement of error and endogeneity in the price data. Their study revealed that two stage least squares estimates of the demand for alcohol yield significantly larger estimates of the response to price than ordinary least squares estimates using state and federal tax rates as instrumental variables. They estimated the price elasticity of demand range from about minus one-half to minus 1.2 which is consistent with the result of Manning et al in 1995. Ayyagari et al., (2011) estimated the price elasticity of demand for alcohol using health and retirement study area data to account for unobserved heterogeneity in price responsiveness using finite mixture models. They observed two latent groups, one with significant responsiveness to price and the other is unresponsiveness. The group with greater responsiveness is disadvantaged in multiple domain such as health, financial resources, education and perhaps even planning abilities. The unresponsive group drinks more heavily suggesting that a higher tax would fail to curb the negative alcohol related externalities. In contrast, they observed that disadvantaged group is more responsive to price, thus suffering greater deadweight loss yet the group consumes fewer drink per day. The demand for alcoholic beverages is extensive and growing, with a wide range of econometric models being applied in various parts of the world. Most studies, such as those by Walsh and Walsh (1970), Johnson and Oksanen (1974, 1977), McGuinness (1980), Duffy (1983), Adrian and Ferguson (1987), Godfrey (1988), and Johnson et al., (1992) have followed the traditional single-equation estimation techniques. Others, such as those by Clements and Johnson (1983), Jones (1989), Selvanathan (1988, 1991), Alley et al., (1992), Amoako-Tuffour and Leblanc (1995), and Andrikopoulos et al., (1997) have adopted the system-wide analysis employing variants of the Rotterdam or the Almost Ideal Demand System (AIDS). The results have been mixed even among those by the same authors (Johnson and Oksanen, for example) due primarily to the methodological differences.Yu and Chen (1998) provided a thorough time series analysis of the demand for alcohol beverages (beer, wine and spirit) for the province of New Brunswick, Canada. They used three cointegration tests, namely the Engle-Granger cointegration test, the Johansen test, and the Leybourne and McCabe test. They concluded based on the last two tests, that there exists a long-run demand function for each alcohol category (beer, wine and spirits). Their finding for the province of New Brunswick that the demand for beer is price unit-elastic in both the short and long-run, that the demand for wine is price inelastic in both the short and long-run, and that the demand for spirits is price unit-elastic in the short-run but elastic in the long-run. They also observed that the demand for all three alcoholic beverages is income inelastic in both the short and long-run in New Brunswick. With respect to substitution, they observed that wine is a good substitute while spirits are poor substitutes for beer that both beer and spirits are poor substitutes for wine, and that wine is a good substitute but beer is a poor substitute for spirits at least in the short-run. This suggests that the degree of substitution and even the direction of substitution can be different among the three alcoholic beverages. Within one category of alcohol, one type may be a very close substitute for another. But among the three categories, the degree of substitution might be different. A person who is addicted to spirits might find wine as the only interesting substitute.
9. The Quade Test
- The data consists of b – mutually independent k – variates random variables
 , called the b blocks, where
  . Then, the variable
  is in block i and is associated with brand j. And the b - blocks are arranged as follows:
 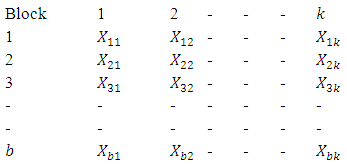 Let
Let  be the rank from 1 to k assigned to
  within block (row) i that is, for block i the random variables
 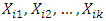 are compared with each other and the rank 1 is assigned to the smallest observed value, 2 to the next observed value and so on to the rank k which is assigned to the largest observation in block i. Ranks are assigned in all of the b blocks and average rank is used in case of tie observations. From the original observation
  , ranks are also assigned to the blocks themselves according to the size of the sample range in each block.The sample range within block i is the difference between largest and smallest observations within that block.There are b sample ranges, assign rank 1 to the smallest range, 2 to second smallest range and so on to the largest range, this get rank of b. Let
  be the ranks assigned to blocks 1, 2, …, b respectively. The block ranks
  multiplied by the difference between the rank within i,
  and the average rank within blocks,
  to get the product
  , where
 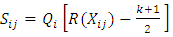 | (1) |
 is the relative size of each observations within the block, adjusted to reflect the relative significance of the block in which it appears.Let
  denote the sum for each brands.
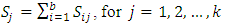 | (2) |
 Each ranking of the random variables within a block is equally likely (The brands have identical effects)
  At least one of the brands tends to yield larger observed values than at least one other brands. The test statistic is
 | (3) |
 If
If  , the point is considered to be in the critical and calculate the critical level as

10. The Friedman Fr-test
- The Friedman Fr-test provides another method for testing to detect a shift in location of a set of k populations. Like other non-parametric tests, it does not require any assumptions about populations.Consider a situation where a complete randomized design was used to compare the reaction times of subjects under the influence of one or two drugs. When the effect of the drug is short-lined and when the drug effect varies greatly from person to person it may be beneficial to employ a randomized block design.Using the subjects as blocks, we would hope to enhance the variability among subjects and thereby increase the amount of information in the experiment. Suppose that three drugs, A, B and C, are to be compared using a randomized block design. Each of the three drugs is administered to the same subject with suitable time lags between the three doses. The order is determined to each subject. Thus, one drug would be administered to a subject, a reaction time noted and after a sufficient length time the second drug is administered, etc.Suppose that six subjects are chosen and that the reaction times are ranked within each subject (block) and compute the rank sums for each of the drugs (treatments). The null and alternative hypothesis are:
 The populations of reaction times are identically distributed for all three drugs
  At least two of the drugs have probability distribution of reaction times that differ in location.The Friedman Fr-test statistic, which is based on the rank sums for each treatment, is
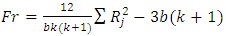 | (4) |
 Rank sum of the jth treatment, where the rank of each measurement is computed relative to its position within its own blockAssumptions: 1. The treatments are randomly assigned to experimental units within the blocks2. The measurements can be ranked within blocks3. Either the number of blocks (b) or number of treatments (k) should exceed 5 for the
  approximation to be adequate.Note that no assumption have been made about the shape of the population probability distribution rejection region:
 with
with  degrees of freedom.
11. Data Collection and Analysis
- The data used in this research work is collected using method of random sampling. That is, from 10 stores where 10 different brands of drinks were selected. The data is that of the completely randomized design (CRD).The following alphabets denote the different store.A - McCentee BarB - Melody JointC - JonakD - River SideE - Asika StoreF - EmaronG - Chinedu JointH - Ogbono TreeI - Okpara JointJ - Love GardenNext, the following denotes the different brand of drinks:X1 - Guinness LargeX2 - Guinness SmallX3 - Guinness Extra SmoothX4 - HarpX5 - Gordon’s SparkX6 - StarX7 - GulderX8 - 33X9 - HeneikenX10 - LegendData presentation in randomized block design
|
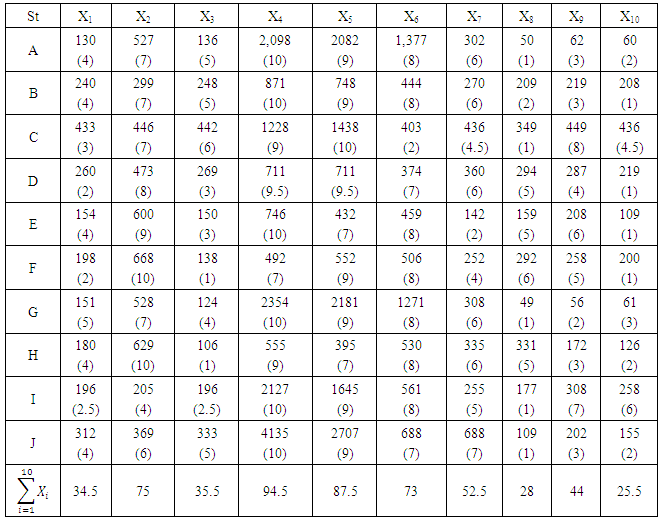
|
 Hypothesis testingTest to compare brands means
  The average demand/sales of all the brand of drinks are the same i.e
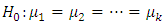
 The average demand/sales of at least two brands of drinks differ i.e
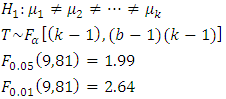
 is significant at 1% and 5% levels respectively; hence the average demand/sales of at least two brands differ.Hence, the null hypothesis is rejected at both 1% and 5% significance levels. Therefore, the alternative hypothesis will be accepted and we conclude that the average demand/sales of drinks at least two brands of drinks differ.The use of Friedman Fr-Test for Data Analysis
 The probability distribution of k treatments are identical i.e
 At least two of the probability distributions differ in location i.e
 Test Statistics
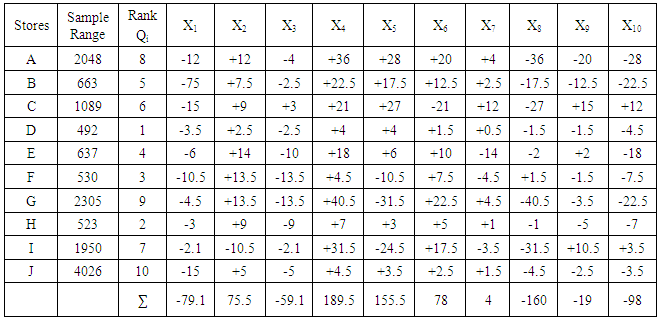
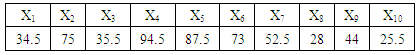
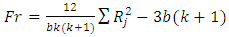 The rank sum of
  treatment is shown below;
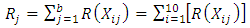
|
 Comparing the
  with the
  is significant at 1% and 5% levels respectively. Hence, the null hypothesis is rejected. That is, the alternative hypothesis is accepted. The
  result obtained is in agreement with that obtained from the
  statistics.
12. Results Interpretation
- When using the randomized block design, the test statistic
 and the critical
  at both 5% and 1% level of significance are 1.99 and 2.64 respectively. Since
  , the null hypothesis is rejected concluding that the average demand/sale for at least two brands of drinks differ at both 1% and 5% level of significance. For further investigation, the Friedman
  test is used. The result showed that the value of
  at 1% and 5% level of significance are 21.67 and 16.92 respectively and that
  we therefore reject the null hypothesis and conclude that the average demand/sale for at least two brand of drinks differ at both 1% and 5% level of significance with
  df.From the above results, we see that all the analysis are in agreement with each other. The study carried out therefore concludes that the demand/sale for at least two brands of drinks of the same category differ using both the Quade test statistic and the Friedman test statistic.
13. Summary
- In this research, data collected was analyzed and an adequate corresponding inference drawn. The aim of the research is to investigate if there any significant difference in the average demand/sale rate for each brand of drinks of the same category in Okuku community, Yala Local Government Area, Cross River State which was treated using two statistical tools at 1% and 5% levels of significant. The result revealed that the average demand/sale for at least two brands of drinks of the same category differs.
14. Conclusions
- This research presents clearly the treatment of the basic concept of comparing brand of drinks of the same category from store to store in Okuku community. It is very obvious that the same size, type and quality of drinks have different demand/sale rate of the same category from one store to another within the same geographical area.When studying multiple comparisons, the key focus is the statistical application of the analysis of variance (ANOVA) which is the method of comparing mean of more than two populations. The aim of the application of ANOVA in this research is to reduce the probability of committing statistical errors.Based on the numerical analysis in this research, the average demand/sale rate for each brands of drinks of the same category from store to store cannot be exactly the same in all stores in Okuku community, in Cross River State of Nigeria.The research therefore recommends to enlighten operators and the public that the average demand/sale rate for at least two brands of drinks differ. It is therefore imperative for operators to be conscious of those factors (Location, Varieties, and Treatment) that promotes the increment in demand rate in order to meet up with their own business targets and needs.